


Servicios Personalizados
Articulo
 Inglés (pdf)
 Articulo en XML
 Referencias del artículo
Indicadores

Links relacionados
-
 Citado por Google
 -
 Similares en Google
Compartir

 Permalink
Journal of the South African Institution of Civil Engineering
versión On-line ISSN 2309-8775
versión impresa ISSN 1021-2019
J. S. Afr. Inst. Civ. Eng. vol.59 no.2 Midrand jun. 2017
http://dx.doi.org/10.17159/2309-8775/2017/v59n2a6
TECHNICAL PAPER
The application of continuous surface wave testing for settlement analysis with reference to a full-scale load test for a bridge at Pont Melin, Wales, UK
G Heymann; J Rigby-Jones; C A Milne
ABSTRACT
The presence of a significant thickness of soft silts beneath the site of a proposed new road bridge caused concerns over the suitability of shallow foundations. Despite extensive conventional ground investigations, it was not possible to obtain reliable stiffness data, and so a full-scale, fully instrumented load test was undertaken to better determine ground stiffness. The data obtained was used in conjunction with sophisticated numerical analysis to demonstrate that the settlement of shallow foundations would be acceptable. Following completion of the bridge construction, Continuous Surface Wave testing was undertaken and a range of simple non-linear elastic settlement analyses conducted to model the behaviour of the load test. Through these analyses this paper demonstrates the benefit of using continuous surface wave ground stiffness testing in conjunction with simple analysis methods. It underlines the importance of obtaining high-quality stiffness data to accurately predict settlement of shallow foundations.
Keywords: continuous surface wave test, CSW, soil stiffness, non.linear analysis, foundation settlement
INTRODUCTION
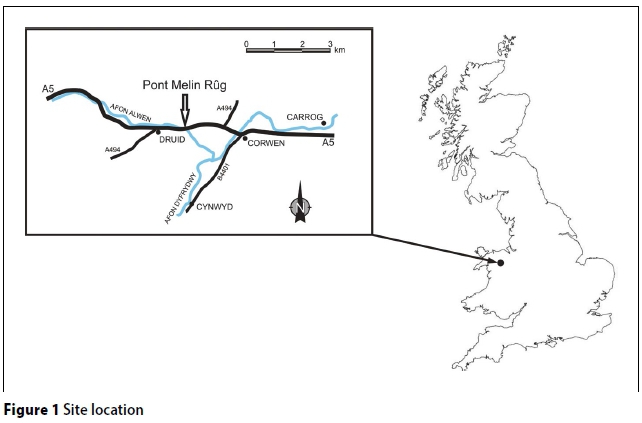
The existing 18th century masonry arch bridge which crosses the river Afon Alwen at Pont Melin, 2 km west of Corwen in North Wales, was replaced in 2008 with a new 45° skew bridge with 60 m single span between bearings (Figure 1). The presence of a 50 m thick sequence of saturated, soft silts of glacio-lacustrine origin (the Rüg Silts) caused concern that excessive settlement would be generated by construction of the new bridge on spread foundations. The thickness of the silt deposits limited options for deep foundations (Solera & Milne 2009). Accurate settlement prediction was required given the tight tolerance of the bridge bearings to foundation movements. Consequently, extensive ground investigations and a large-scale load test were undertaken at considerable cost to provide data for settlement analysis of the foundations.
Accurate measurement of stiffness in the poorly understood and sensitive Rüg Silts was challenging, with a wide range of values and significant scatter identified from data from different sources. Solera and Milne (2009) give details of the settlement analysis, which adopted a conservative approach and resulted in predictions of settlement in the range of 75-85 mm. This level of settlement provided significant constraints on the construction methodology, with the installation of bearings and landing of deck beams requiring programme hold periods and careful monitoring. The actual settlements suffered by the bridge foundations were observed to be less than half the predicted values. Whilst conservatism was justified in terms of the scale and risk of the project, the availability of accurate stiffness values would have permitted a less conservative and simplified analysis approach, and provided greater confidence in the results and potentially removed the constraints on construction associated with the high-predicted settlements.
Seismic testing techniques have been used successfully for the design of many projects around the world (Stokoe et al 2004), but its wider adoption has been limited to date by the familiarity of designers with more conventional, often intrusive and empirically based methods. Continuous Surface Wave (CSW) testing is a rapid and cost-effective technique for measuring seismic surface wave velocities at a range of frequencies allowing an in situ ground stiffness profile to be determined. Unlike the most frequently used techniques for assessing ground stiffness, CSW is non-intrusive and measures the undisturbed stiffness of the ground at the current in situ stress conditions. Furthermore, the technique measures stiffness at small-strain levels (Go), which can then be adjusted for the desired design strains using well understood and simple to apply stiffness reduction models which are remarkably independent of soil type. The intimate fundamental relationship between shear wave velocity and soil stiffness, combined with the CSW technique's direct measurement of in situ soil properties, makes the technique a highly attractive method for the measurement of ground stiffness profiles. The extensive data set available for Pont Melin Rüg, including a wide range of intrusive testing and a fully instrumented load test, afforded an excellent opportunity to evaluate the accuracy of settlement prediction using the CSW technique on this problematic ground not well suited to other types of stiffness measurement.
SITE INVESTIGATION
The Rüg Silts deposits were formed by seasonal deposition of glacially derived rock flour within a glacial lake (Nichol and Reynolds 2002). The behaviour of the Rüg Silts was fundamental to foundation design at the site and there were concerns that the properties of these deposits were not fully understood. Low SPT N-values recorded during an early investigation, ranging from less than 1 to 4, caused particular concern that the deposits may be inhomogeneous, with the potential for large or differential settlements. Furthermore, experience during an early investigation of casing loss whilst drilling, together with the very low blow counts from SPT testing, suggested that the deposits could be sensitive to disturbance and hence difficult to evaluate through intrusive testing.
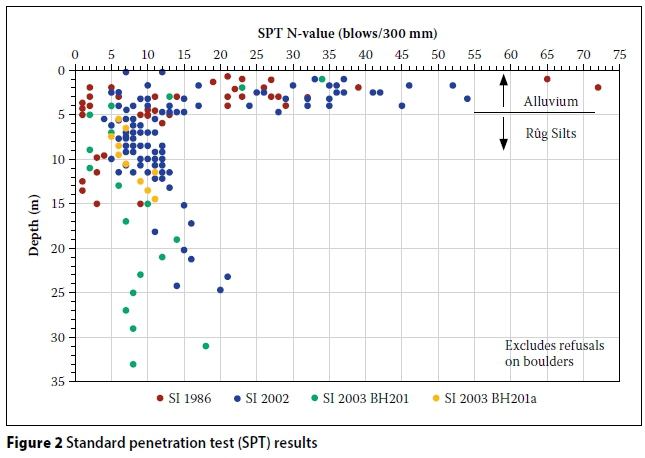
Figure 2 shows the SPT N-values measured at the site. The data set clearly shows the interface of the alluvial gravel and the Rüg Silts, with significantly higher SPT N-values recorded for the gravel than the Rüg Silts. Very large scatter of the SPT N-values may be seen, particularly for the alluvial gravels. SPT testing was done for each of the three site investigations conducted for the bridge foundations. The very low blow counts measured during the first investigation in 1986 were subsequently discounted, as it was concluded that the material was disturbed due to inadequate water balance during drilling. During the later site investigations in 2002 and 2003, full-time supervision was conducted on site to ensure good quality control during the drilling, and in particular to monitor the water balance. Figure 2 shows that in general the SPT N-values were higher for these investigations. Notwithstanding the higher N-values, the data was still scattered, indicating the difficulties in reliably quantifying the in situ properties of these soils, which are sensitive to disturbance, by a process which inherently causes disturbance. Stroud (1989) recognised the importance of strain level on soil stiffness and suggested relationships between the drained Young's modulus (E') for foundations on sand and energy-corrected SPT N-value (N60) as a function of the factor of safety. Using this data, Clayton (1995) argued that most foundations have a factor of safety considerably in excess of 3, and suggested E' = 2N60 (MPa) for normally consolidated sands. The N-values of between 6 and 15 measured in the upper part of the Rüg Silts therefore indicate a drained Young's modulus (E') of between 12 and 30 MPa. The scatter in the SPT N-values for the alluvial gravel was too large to make a meaningful estimation of the Young's modulus.
Figure 3 shows a typical cone penetration test (CPT) result. The interface of the alluvial gravel and Rüg Silts is also clearly evident, but the data scatter again demonstrates the difficulties of quantifying suitable stiffness values for design. For qcless than 10 MPa, Lunne and Christoffersen (1985) suggested the relationship between cone resistance (qc) and the drained Young's modulus for normally consolidated sands as E' = 4qc. For qcranging from 2 to 6 MPa this relates to a drained Young's modulus of 8 to 24 MPa. The cone resistances in the alluvial gravel again exhibited large scatter, making the estimation of design stiffness difficult.
Laboratory stiffness measurement of the alluvial gravel and the underlying soft silt material also proved challenging because of the difficulty in obtaining high-quality samples, due to the susceptibility of the material to disturbance during borehole drilling. The Rüg Silts were particularly vulnerable to drilling disturbance, and during the first site investigation the drillers recorded numerous cases of "blowing" where the base of the borehole raised several metres inside the casing overnight, probably exacerbated by inadequate water balance during the drilling process. In another instance the borehole casing settled 2.7 m under its own weight.
Given the difficulty experienced in accurately determining stiffness moduli from the SPT and CPT testing, as well as the laboratory testing, a full-scale load test was undertaken to provide more reliable data for settlement prediction.
FULL-SCALE LOAD TEST
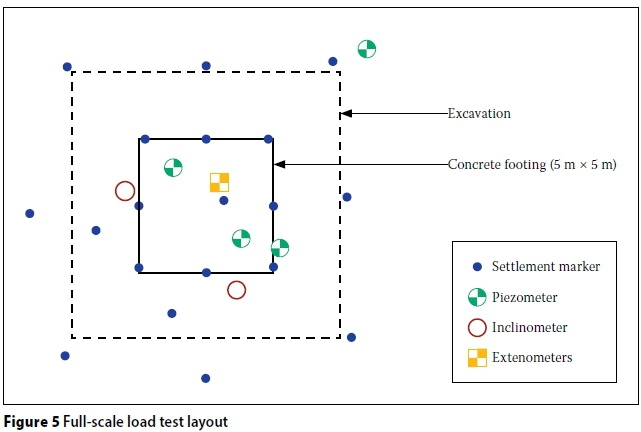
A 5 m χ 5 m χ 0.5 m thick concrete footing was constructed 2.5 m below the natural ground level, and loaded with 442 tonne steel kentledge, as shown in Figure 4. The load test was undertaken approximately 8 m north of the northern edge of the east abutment. The boreholes close to the footing indicated that the footing was between 2.1 m and 3.0 m above the base of the alluvial gravel, with an average depth of 2.6 m. Numerous instruments were installed to monitor the behaviour of the soil and foundation during the load test. Eight magnetic extensometers were installed in a borehole near the centre of the concrete footing. Four vibrating wire piezometers were installed in the Rüg Silts to monitor the pore pressure regime below the foundation and to detect possible excess pore pressure during loading. Two inclinometer tubes were installed adjacent to the footing to measure lateral movement of the soil. Precise levelling with an accuracy of 0.1 mm was conducted of the footing and adjacent ground surface at the positions shown in Figure 5. This included eight ground settlement markers adjacent to the excavated area and eight settlement markers at the edge of the concrete footing. The settlement markers situated around the periphery of the test slab were domed-head Feno-type steel pins set in concrete, and the markers fixed to the concrete test slab sides were Hilti-type bolts. One benchmark was used a distance of 48 m from the footing.

Loading was applied in five increments of 48 T, 152 T, 248 T, 344 T and 442 T over a period of six days, and all the instrumentation was read before and after each load increment. The load settlement behaviour of the footing is shown in Figure 6. At the maximum applied load of 442 T, corresponding to a contact stress of 176.8 kPa, the average settlement of the levelling points was 18.3 mm. The maximum settlement observed was 21.8 mm and the maximum differential settlement was 5.7 mm. Settlement took place almost immediately after load application. The vibrating wire piezometers registered no excess pore pressure, confirming that consolidation occurred almost immediately, and confirming the relatively free draining nature of the gravelly alluvium and sandy upper 3 to 4 m of the Rüg Silts. For the first three load increments the load was held constant overnight, and during this time settlement creep of between 0.2 and 0.6 mm occurred. Before the last load increment was applied, a rest period of three days was observed during which creep of 3.3 mm took place. The footing exhibited stypical non-linear settlement behaviour, with stiff response during the first and second load increments, becoming less stiff for the subsequent load increments.
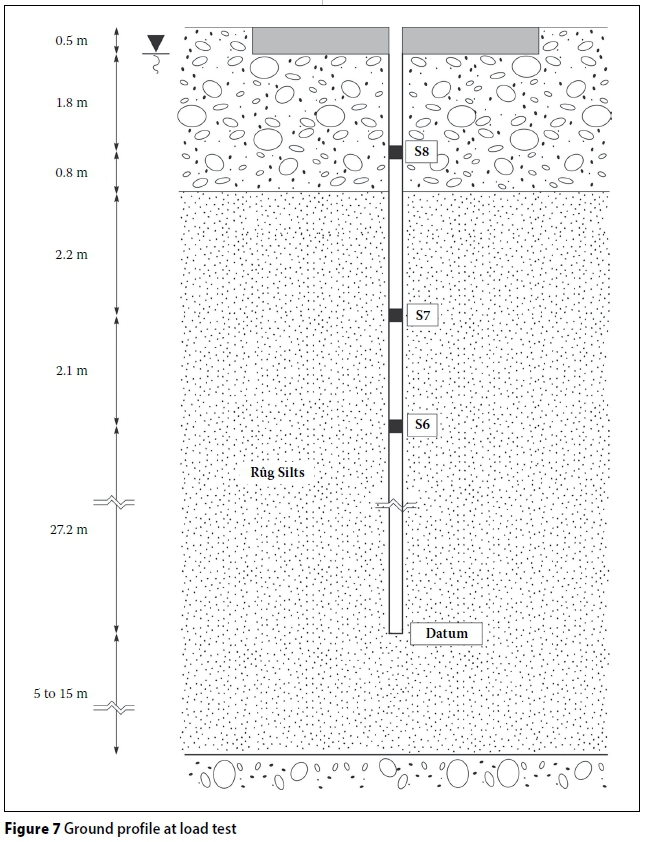
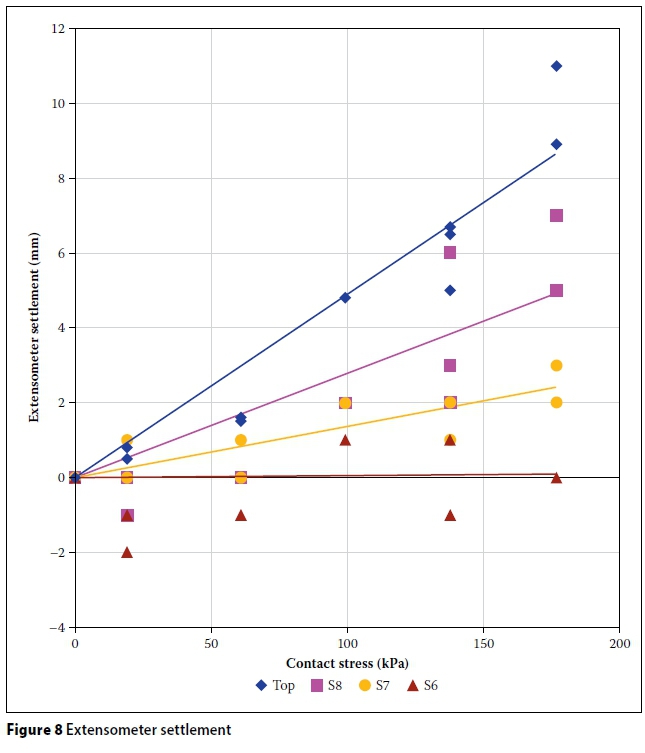
Figure 7 shows a cross-section of the profile and the positions of the top three magnetic extensometers. The magnetic extensometer had a resolution of 1 mm, which was low compared to the maximum measured vertical settlement at extensom-eter position S8 of 7 mm. Figure 8 shows the settlement measured by the top three exten-someters, as well as the settlement of the top of the extensometer borehole casing that was measured using precise levelling. Despite the data scatter due to the low resolution of the extensometers, settlement of the exten-someters near the footing was observed as the load was increased. Figure 8 also shows linear trend lines for each extensometer magnet. Extensometer S6 at a depth of 7.4 m below the footing measured very little movement, as did the deeper extensometers (S1 to S5) which ranged in depth between 9.5 m and 26.5 m. The bottom of the casing, taken as the datum, was 34.5 m below the footing. From the lack of movement of extensometers S1 to S6 it is clear that the soil deformation was confined to a depth of approximately 1.5 times the width of the footing.
The stiffness of the soil may be computed between any two extensometer positions. If axisymmetrical conditions are assumed, the Youngs modulus (E) is:

Where:
E' = drained Young's modulus
Δσ'v= vertical effective stress increment
Δσ r= radial effective stress increment
Δε ν = vertical strain increment
v' = Poisson's ratio.
The vertical strain in the Rüg Silts between extensometers S6 and S7 ranged between 0.015% for the contact stress of 19.2 kPa at the first load increment and 0.115% at 176.8 kPa. Using Equation 1, the Young's modulus of the Rüg Silts was calculated as 41 MPa. Unfortunately the non-linear stress strain behaviour of the soil could not be quantified due to the low resolution of the magnetic extensometers.
The full-scale load test was completed in 2003, and on the basis of the results the decision was made to build the bridge on shallow foundations founded in the alluvial gravel. Subsequent to the construction of the bridge the opportunity arose to conduct continuous surface wave testing immediately adjacent to the load test area, with the aim of assessing the application of the CSW test for settlement prediction of shallow foundations.
CONTINUOUS SURFACE WAVE TESTING
The Continuous Surface Wave (CSW) test is a seismic test which uses a vibratory source placed on the ground surface. It induces Rayleigh waves which radiate along the ground surface and are detected by a linear array of geophones also placed on the ground surface. The vibrator can be used as a harmonic source at a particular frequency or as a transient source which sweeps through a frequency range of interest. The CSW test has the advantage over impact source techniques (SASW and MASW) that the frequency content of the source is known and can be controlled. This allows the signal quality to be assessed in the field and a poor signal or interference from background noise is easily detected. Also, a vibratory source provides a significantly higher signal-to-noise ratio compared to impact sources (Jiang et al 2015). Simons et al (2002) found the CSW test to give more repeatable results than the SASW test.
The geophone response is recorded for a range of source frequencies, and at each frequency the Rayleigh wave phase velocity is calculated. Due to the dispersive nature of ground profiles, the phase velocity is frequency-dependent. High frequency excitation induces short wavelengths which penetrate only to shallow depth, whereas low frequencies generate long waves which penetrate deeper. The response at high frequency is therefore determined by the shallow soils, whereas the response at low frequency is also influenced by deeper material. Ground motion is insignificant at depths below one wavelength.
An important part of the analysis of CSW results is the inversion of the dispersion data. Inversion is the process by which theoretical Rayleigh wave dispersion curves of a model ground profile are matched with the measured dispersion data. Calculation o the theoretical dispersion curves of a model ground profile requires the solution of the Rayleigh eigenvalue problem. Thompson (1950) and Haskell (1953) used the transfer matrix method and formulated an algorithm to model surface waves propagated by a layered medium known as the Thomson-Haskell algorithm. Kausel and Roësset (1981 derived a formulation based on the finite element dynamic stiffness matrix method, and Kennett (1974) developed the reflection and transmission coefficient method. Numerous other techniques have been used to model surface waves propagated by a layered medium, including the finite difference method (Boore 1972), numerical integration (Takeuchi & Saito 1972) and the boundary element method (Manolis & Beskos 1988). These methods determine the Rayleigh dispersion curves for fundamental and higher modes of Rayleigh wave propagation.
Fundamental mode propagation is dominant in normally dispersive profiles, where stiffness increases with depth. For inversely dispersive profiles, where soft layers occur below stiff layers, higher modes also contribute to Rayleigh wave propagation. Correct mode identification of the experimental data is important to ensure matching of the same modes of the theoretical and experimental data. Leong and Aung (2013) developed a weighted average velocity method to calculate the effective Rayleigh phase velocity which includes the contribution of more than one mode when mode superposition occurs. The effective Rayleigh phase velocity implicitly accounts for the existence of higher modes, and therefore eliminates the requirement for mode identification. This is particularly useful for inversely dispersive profiles, as higher modes also contribute strongly to Rayleigh wave propagation. The weighted average velocity method ignores any contribution from near field effects.
Search algorithms are used as part of the inversion analysis to find the model ground profile for which the dispersion curves best match the measured data. Numerous algorithms have been proposed, including neighbourhood algorithms (Wathelet 2008), genetic algorithms (Lomax & Snieder 1994) and simulated annealing algorithms (Sen & Stoffa 1991). The inversion process is ill-posed, which implies that there may be two or more theoretical profiles which fit the experimental data equally well. It is therefore helpful to have additional information, such as borehole logs to constrain the inversion problem.
During 2011 the opportunity arose to conduct CSW testing close to the position of the full-scale load test. The testing was conducted using a shaker and an array of five 4.5 Hz geophones spaced at equal distances of 0.75 m giving a spread length of 3.0 m. The output from the geophones was passed through a pre-amplifier before being logged using a field computer and data acquisition hardware. The shaker was a 70 kg mechanical shaker with counter-rotating balanced eccentric weights driven by a three-phase motor (Heymann 2013). The tests were conducted in the frequency range 92 Hz to 7.6 Hz, and the induced wavelengths varied between 2.0 m and 19.1 m. Figure 9 shows the dispersion data for the three tests. The tests show that the Rayleigh wave phase velocity decreased at low frequency. This is due to the Rüg Silts being less stiff than the overlying alluvial gravel. The best fit effective dispersion curve was determined using the weighted average velocity method (Leong & Aung 2013) and a Monte Carlo search algorithm for the inversion analysis. The typical production rate to conduct three CSW tests is approximately two to three hours for the field work and a similar length of time for data analysis. This high production rate makes CSW testing significantly more cost-effective than other tests, including SPT, CPT, downhole seismic testing and full-scale load testing.


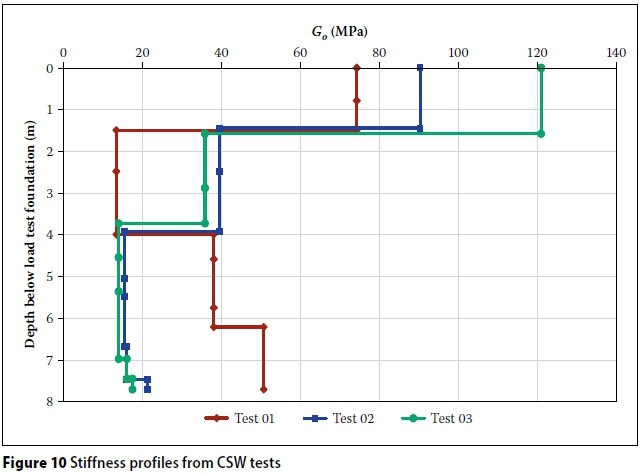
The profiles of small-strain shear stiffness for the material below the full-scale load test footing are shown in Figure 10 for the three CSW tests. The stiffness profiles clearly show the interface between the gravel and Rüg Silts. At the foundation level of the full-scale load test the small-strain shear stiffness (Go) of the alluvial gravel ranged between 74.3 MPa and 121.0 MPa (midrange value 97.7 MPa). At the top of the Rüg Silts the small-strain shear stiffness for the three profiles ranged between 13.4 MPa and 39.4 MPa (midrange value 26.4 MPa).
SETTLEMENT ANALYSIS
The settlement of the full-scale load test was analysed using the small-strain stiffness data obtained from the CSW tests, and the calculated settlement compared to the observed behaviour. A number of analyses were undertaken with a range of complexity. However, all calculation methods were based on the application of a simple linear elastic soil model which subdivided the gravel alluvium into three layers of thicknesses (0.6 m, 1.0 m and 1.0 m respectively) and the underlying Rûg Silts into layers of thicknesses 0.4 m, 0.5 m, 1.0 m, 3.0 m and 4.5 m respectively. The same layered model was used for all analyses. A rigid boundary was assumed at 12 m depth equal to 2.4 times the foundation width and below the depth of any significant stress increase.
The small-strain shear modulus (Go), as measured by the CSW test, was used to assign a small-strain drained Young's modulus (E'o) to each layer. E'o = 2(1 + v')Go where the Poisson's ratio (v') was taken as 0.26, which is a typical value for drained loading of intermediate soils. Axisymmetrical conditions were assumed in all analyses, and Boussinesq's theory used to calculate the vertical and horizontal stress increment for each layer below the centre of the footing.
In all analyses using small-strain stiffness values, the non-linear stiffness response of the soil to straining was accounted for. Many stiffness reduction curves have been proposed to describe the non-linear stress strain relationship observed for soils, including Vucetic and Dobry (1991), Rollins et al (1998), Clayton and Heymann (2001), and Archer and Heymann (2015). For all analyses representative stiffness values were calculated by applying the stiffness reduction function suggested by Rollins et al (1998, Equation 2 below) to the midrange values determined from the CSW tests.

Where: γ is the current shear strain of a sub-layer.
Single-stage loading of manually softened soil
In the simplest analysis method the nonlinear response of the soil was modelled through a wholesale reduction of all stiffness values to an assumed operational strain level. Mair (1993) suggested that strain levels beneath typical shallow foundations are of the order of 0.1% and this value was used as the basis for reducing the small-strain stiffness values. Application of the Rollins et al (1998) stiffness reduction function (Equation 2) to the midrange CSW small-strain stiffness values for the alluvium and Rüg Silts resulted in drained Young's modulus values of 83.9 MPa and 22.7 MPa respectively. The settlement of the load test foundation was then calculated using these softened stiffness values at each load stage with the proprietary software GEO5 Spread Footing which facilitates the automated linear elastic analysis of a shallow foundation on a layer model.
The results of the GEO5 analysis are shown in Figure 6 and demonstrate a linear load settlement response corresponding to the softened soil stiffness values. It can be seen that at intermediate load stages, settlements are over-estimated due to the use of overly softened stiffness values corresponding to a strain in excess of true values. The error reduces with increased loading and strains in the ground until, at the final load stage, the calculated settlement of 18.9 mm is close to the observed settlement of 18.3 mm. However, it must be noted that there is a degree of good fortune that the selected softened strain level and actual strain level correspond at this loading stage.
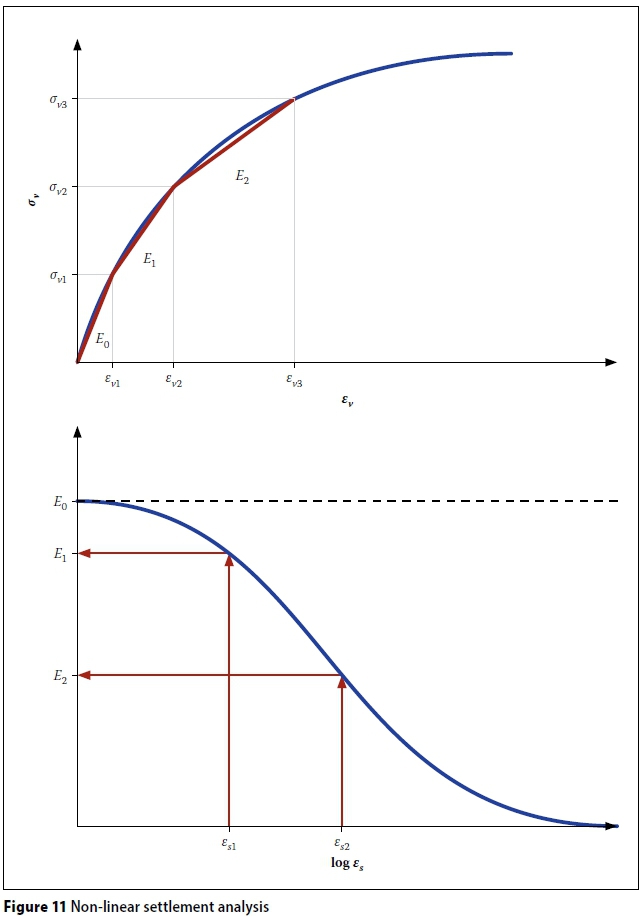
Stepwise non-linear settlement analysis
This method allows simple linear elastic settlement calculations to be used to model the non-linear behaviour of soil without the need to assume an operational strain level. The maximum stress σ ν is applied incrementally in a number of steps, with the layer stiffnesses in each step being progressively softened from an initial value of E0to correspond to the calculated strain level from the previous step. The calculated strains from all previous steps are summed to determine the applicable strain for a particular step. The methodology for the stepwise non-linear settlement analysis is shown in Figure 11.
An analysis was undertaken using a total of five steps and the GEO5 Spread Footing software. The progressive stiffness reduction of the layer stiffnesses was undertaken using the calculated vertical strain from the previous step and not the shear strain. The results of the 5-step non-linear GEO5 analysis are shown in Figure 6 and demonstrate a clear non-linear response representing the progressively softened stiffness values used in the analysis. It can be seen that the analysis overestimates the settlements at low stress levels, although there is a significant improvement in accuracy over the single-step analysis. Overall there is a much improved agreement between the observed data, with the calculated settlement of 17.6 mm at the final loading stage being close to the observed settlement of 18.3 mm.
To explore the effects of undertaking stepwise analysis using a larger number of steps, software (Versak v2.0) was written to undertake a 100-step analysis where the stiffness for each layer is automatically softened after each load increment. In contrast to the GEO5 analysis, stiffness reduction was undertaken using the shear strain determined from the calculated vertical strains using  .
.
The result of the 100-step non-linear Versak analysis is also shown in Figure 6. As would be expected the 100-step analysis provides a smoother non-linear response curve than the 5-step analysis. Whilst both the 5-step and 100-step curves provide very similar overall load settlement curves, it is noted that the 100-step analysis provides a slightly softer response, reflecting the more frequent stiffness reduction. The calculated settlement of 18.7 mm at the final loading stage is close to the observed settlement of 18.3 mm.
DISCUSSION
Conventional site investigation methods to quantify the design stiffness for the materials at the location of the bridge at Pont Melin (constructed in 2008) achieved only limited success. This was because the materials were susceptible to disturbance during the drilling process, and also because the materials were not well suited to conventional invasive in situ tests. Clayton et al (1995) pointed out that uncemented sands, silty sands and gravels are at particular risk of borehole disturbance. They argued that if the casing is extended to the bottom of the borehole it is virtually impossible to prevent disturbance, due to boiling of the soil into the casing when the drilling tools are withdrawn from the hole, unless the hole is constantly recharged with drilling fluid. Data reported by Mallard (1983) suggests that SPT N-values may reduce to %thof the correct value when unsuitable drilling techniques are used in sands and gravels. The disturbed zone that occurs below the bottom of a borehole depends on the size of the borehole and may be as much as three times the borehole diameter (Clayton et al 1995). SPTs conducted at the bottom of the borehole will therefore be affected by this disturbance.
The SPT had limited success in the coarse alluvial gravels with a mean particle size (D50) of 13.3 mm. Tokimatsu (1988) showed that SPT results are affected by particle size, and when the mean particle size exceeds about 0.5 mm the N-value increases rapidly. The large scatter of the SPT N-values in the gravel is immediately apparent from Figure 2, and cases where refusal occurred have been omitted for clarity. Clearly reliable stiffness parameters could not be obtained for the alluvial gravel from the standard penetration test.
The effect of disturbance on the SPT results from the Rüg Silts were clear from the significantly higher SPT values that were obtained when mechanisms were put in place to ensure water balance during all stages of the drilling process. For the first investigation in 1989, without site supervision, the N-values for the Rüg Silts were generally below 5, and for the subsequent investigations in 2002 and 2001, with site supervision, the N-values were generally between 5 and 15, with a trend to increase with depth. This highlights the importance of sound drilling and testing techniques in loose cohesionless soils.
Clayton et al (1995) argued that settlement prediction using CPT results are significantly more accurate than for SPT results, because the CPT does not suffer from borehole disturbance. At Pont Melin, CPT was successfully conducted in the Rüg Silts, but achieved limited success in the alluvial gravels, probably as a result of the large grain size relative to the size of the cone tip.
The in situ test methods employed at Pont Melin to characterise the ground properties were SPT and CPT penetration tests. Relationships between these tests and stiffness are empirical and rely on selection of an appropriate relationship for the material type. The stiffness values derived using this approach are therefore inevitably inaccurate, and a suitably conservative approach to parameter selection for design must be adopted.
Stiffness determined by laboratory testing on undisturbed samples was not available for the new bridge at Pont Melin. It is well known that relatively modest strains induced during sampling can significantly alter the stiffness of soils. In addition, high-quality undisturbed sampling of the alluvial gravels were not feasible using conventional sampling techniques, and would have required specialised methods such as ground freezing or possibly using a piston sampler in a mud-filled borehole for the soft Rüg Silts.
From the above discussion it is clear that conventional in situ testing and laboratory techniques were of limited use to characterise the stiffness of the alluvial gravel and soft Rüg Silts. For this reason a full-scale load test was conducted. This was an expensive and time-consuming method, but was justified, as the cost-saving for using shallow foundations as opposed to deep foundations was considerable.
At the time of the project the continuous surface wave (CSW) test was not available.
It is an attractive test method, because it is a non-disturbing and non-intrusive test and because the seismic wave velocity of the material is directly related to stiffness. It is therefore well suited to quantify the small-strain stiffness of the geomaterials encountered at the location of the bridge at Pont Melin. However, small-strain stiffness (Go or Eo) cannot be used directly for settlement calculation, as the stress-strain behaviour of soil is highly non-linear and an appropriate stiffness reduction function is required as part of the settlement analysis.
Settlement analyses to predict the load settlement behaviour of the full-scale load test conducted at Pont Melin were undertaken using a range of simple analysis techniques in conjunction with the stiffness parameters determined from CSW testing. This is in contrast to the more complex finite element analysis undertaken as part of the bridge design.
The first single-stage manually softened analysis requires the average operational strain level beneath the foundation to be assumed, and therefore at strain levels below the assumed value this method overestimates settlements and at higher strains provides an underestimation of settlement. The method is, however, rapid and uses the conventional linear-elastic analysis approach widely adopted by practising engineers for routine analyses.
The use of a stepwise analysis method allows the non-linear response of the soil to be modelled. The use of proprietary software requires user intervention between each step to interrogate the output strains in each layer, undertake reduction of layer stiffnesses and adjust the input layer stiffnesses for the next analysis step. Even whilst automating this process with a spreadsheet as far as possible, the process is time-consuming. A small number of load steps are typically used to keep analysis time within practical limits; however, the results obtained from a 5-step analysis provided a reasonable approximation to the observed load settlement curve.
The automated stepwise non-linear analysis undertaken using Versak software allowed a large number of load steps (100) to be conducted efficiently with no user intervention. However, whilst the modelled load settlement curve provided a smoother response than the 5-step analysis, the improvement in accuracy to the observed data was small.
Engineers have to balance resources, including money, time and effort, between site investigation and design. Clearly both these processes are important, but the above case history suggests that better results were achieved by focusing on obtaining accurate material parameters than increasing the sophistication of the analysis method.
CONCLUSIONS
Valuable lessons were learnt during the series of site investigations and field testing that were conducted before and after the construction of the new bridge at Pont Melin. Quantifying stiffness parameters from conventional in situ tests such as the SPT and CPT, as well as laboratory testing, was difficult and achieved only limited success. For the alluvial gravel the large scatter in the SPT and CPT data made selection of the representative stiffness difficult. The Rüg Silts were particularly sensitive to disturbance and the SPT data from the first site investigation was anomalously low, due to borehole disturbance as a result of poor water balance. Only during later site investigations, when full time-site supervision was available and particular care was taken to ensure good water balance, were more reliable SPT data obtained. Even then the uncertainty associated with the selection of an appropriate empirical relationship between SPT N-values and stiffness resulted in the adoption of conservative stiffness values for design.
The CSW test was successfully used to rapidly quantify the stiffness of the alluvial gravel and Rüg Silts, due to the fact that it is non-invasive and does not cause any disturbance during testing. In addition, the CSW test excites a large volume of material and therefore quantifies the mass stiffness of the material and avoids the difficulties which large gravels and cobbles cause for traditional invasive tests. Clearly, the CSW test proved to be a more suitable test to quantify the stiffness of both the alluvial gravel and the Rüg Silts.
The use of a stepwise non-linear analysis method over a single-stage method was shown to provide a significantly more accurate model of the observed settlement. Little improvement was gained by increasing the number of analysis steps from 5 to 100.
The use of CSW stiffness data, coupled with simple analysis techniques, compared well with observed settlements, and provided a far better prediction of settlements than the complex finite element analysis used during the original bridge design in conjunction with conservative soil stiffness values.
ACKNOWLEDGEMENTS
The authors are grateful for the support of the Welsh Government, sponsor of the new bridge, who facilitated CSW testing at the load test site. The supervision of the load test and design of the bridge foundations was undertaken by Hyder Consulting (UK) Limited (now Arcadis Consulting UK Limited).
REFERENCES
Archer, A & Heymann, G 2015. Using small-strain stiffness to predict the load-settlement behaviour of shallow foundations on sand. Journal of the South African Institution of Civil Engineering, 57(2): 28-35. DOI: 10.17159/2309-8775/2015/v57n2a4. [ Links ]
Boore, D M 1972. Finite difference methods for seismic wave propagation in heterogeneous materials. In: Bolt, B.A (Ed.), Methods of Computational Physics, Vol. 11, New York: Academic Press, 1-36. [ Links ]
Clayton, C R I & Heymann, G 2001. The stiffness of geomaterials at very small strains. Geotechnique, 51(3): 245-256. [ Links ]
Clayton, C R I 1995. The standard penetration test (SPT): Methods and use. CIRIA report R143. London: CIRIA [ Links ]
Clayton, C R I, Matthews, C & Simons, N E 1995. Site Investigation, 2nd ed. Oxford: Blackwell Science. [ Links ]
Haskell, N A 1953. The dispersion of surface waves on multilayered media. Bulletin of the Seismological Society of America, 43: 17-34. [ Links ]
Heymann, G 2013. Vibratory sources for continuous surface wave testing. In: Coutinho, R Q & Mayne, P W (Eds.), Geotechnical and Geophysical Site Characterization (ISC4), London: Taylor and Francis, 1381-1386. [ Links ]
Jiang, P, Tran, K T, Hiltunen, D R & Hudyma, N 2015. An appraisal of a new generation of surface wave techniques at a test site in Florida. Paper presented at the International Foundations Congress and Equipment Expo 2015 (IFCEE), 17-21 March, San Antonio, TX. [ Links ]
Kausel, E & Roësset, J M 1981. Stiffness matrices for layered soils. Bulletin of the Seismological Society of America, 71(6): 1743-1761. [ Links ]
Kennett, B L N 1974. Reflections, rays, and reverberations. Bulletin of the Seismological Society of America, 64(6): 1685-1696. [ Links ]
Leong, E & Aung, A 2013. Global inversion of surface wave dispersion curves based on improved weighted average velocity method. Journal of Geotechnical and Geoenvironmental Engineering, 139(12): 2156-2169. [ Links ]
Lomax, A J & Snieder, R 1994. Finding sets of acceptable solutions with a genetic algorithm with application to surface wave group dispersion in Europe. Geophysical Research Letters, 21(24): 2617-2620. [ Links ]
Lunne, T & Christoffersen, P 1985. Interpretation of cone penetrometer data for offshore sands. Norwegian Geotechnical Institute, Publication No. 156, Oslo, Norway, 1-12. [ Links ]
Mair, R J 1993. Developments in geotechnical engineering research: Application to tunnels and deep excavation. Unwin Memorial Lecture. Proceedings of the Institution of Civil Engineers, Civil Engineering, 93: 27-41. [ Links ]
Mallard, D J 1983. Testing for liquefaction potential. Proceedings, NATO Workshop on Seismicity and Seismic Risk in the Offshore North Sea Area, 1-4 June 1982, Utrecht, Netherlands. Dordrecht: Reidel Publishers, 289-302. [ Links ]
Manolis, G D & Beskos, D E 1988. Boundary Element Methods in Elastodynamics. London: Unwin Hyman. [ Links ]
Nichol, D & Reynolds, J M 2002. Application of reflection seismology to foundation investigation at A5 Pont Melin Rüg, North Wales. Quarterly Journal of Engineering Geology and Hydrogeology, 35, 247-256. [ Links ]
Rollins, K M, Evans, M D, Diehl, N B & Daily, W D III 1998. Shear modulus and damping relationships for gravels. ASCE Journal of Geotechnical and Geoenvironmental Engineering, 124(5): 396-405. [ Links ]
Sen M K & Stoffa P L 1991. Nonlinear one-dimensional seismic waveform inversion using simulated annealing. Geophysics, 56, 1624-1638. [ Links ]
Simons, N E, Menzies, B K & Matthews, M C 2002. A Short Course in Geotechnical Site Investigation. London: Thomas Telford. [ Links ]
Solera, S A & Milne, C A 2009. The influence of soft ground conditions on new bridge design at A5 Pont Melin Rüg, Corwen. Urban Geology in Wales: 3. National Museum of Wales Geological Series No. 26, Cardiff, 23-33. [ Links ]
Stokoe, K H, Joh, S & Woods, R D 2004. Some contributions of in situ geophysical measurements to solving geotechnical engineering problems. In: Viana da Fonseca, V & Mayne, P W (Eds.), Proceedings, ISC'2 on Geotechnical and Geophysical Site Characterization held on 19-22 September 2004, Porto, Portugal. Rotterdam: Millpress, 97-132. [ Links ]
Stroud, M A 1989. The standard penetration test - its application and interpretation. Proceedings, ICE Conference on Penetration Testing in the UK. London: Thomas Telford, 29-46. [ Links ]
Takeuchi, H & Saito, M 1972. Seismic surface waves. In: Bolt, B A (Ed.), Methods of Computational Physics, Vol. 11, New York: Academic Press, 217-294. [ Links ]
Thomson, W T 1950. Transmission of elastic waves through a stratified solid medium. Journal of Applied Physics, 21, 89-93. [ Links ]
Tokimatsu, K 1988. Penetration testing for dynamic problems. In: De Ruiter, J (Ed.), Proceedings, 1st International Symposium on Penetration Testing (ISOPT-1), 20-24 March 1988, Orlando, FL, Vol. 1, Rotterdam: Balkema, 117-136. [ Links ]
Vucetic, M & Dobry, R 1991. The effect of soil plasticity on cyclic response. ASCE Journal of the Geotechnical Engineering Division, 117(1), 89-107. [ Links ]
Wathelet, M 2008. An improved neighborhood algorithm: Parameter conditions and dynamic scaling. Geophysical Research Letters, 35(9), DOI:10.1029/2008GL033256, 2008. [ Links ]
 Correspondence:
G Heymann
Department of Civil Engineering
University of Pretoria
Pretoria 0002
South Africa
T: +27 12 420 3627
E: gerhard.heymann@up.ac.za
J Rigby-Jones
Ground Stiffness Surveys Ltd
35 Church Hill
Arnside
Cumbria
LA5 0DJ
United Kingdom
T: +44 7879 457210
E: john@groundstiffnesssurveys.com
C A Milne
Ground Stiffness Surveys Ltd
35 Church Hill
Arnside Cumbria
LA5 0DJ
United Kingdom
T: +44 7921 492853
E: chris@groundstiffnesssurveys.com

PROF GERHARD HEYMANN (Pr Eng, MSAICE) is a professor in the Department of Civil Engineering at the University of Pretoria. He holds BEng, BEng (Hons) and MEng degrees from the University of Pretoria, and a PhD from the University of Surrey. He has been involved with teaching and research in geotechnical engineering for many years. His field of interest includes the characterisation of soil behaviour and its application in geotechnical engineering.

JOHN RIGBY-JONES (CEng, EurIng, MICE) holds BEng and MSc degrees, and has more than 24 years of geotechnical engineering, geophysical and research experience gained from universities, large consultancies, and lately RJM Ground Solutions Ltd, a specialist consultancy set up with co-author Chris Milne. At RJM, John led the development of a commercial CSW (continuous surface wave) system, which was recognised in the 2013 Ground Engineering Awards where RJM was a finalist in the Ground Investigation Specialist of the Year category. In 2016 John and Chris set up Ground Stiffness Surveys Ltd in order to focus on the delivery of a CSW testing service.

CHRIS MILNE (CEng, FICE, EurIng, CGeol, FGS, EurGeol) holds BSc (Hons) and MSc degrees and a Postgraduate Diploma in Geotechnical Engineering Design & Management. He is currently a director of Ground Stiffness Surveys, a specialist CSW ground stiffness profiling developer and contractor established with fellow director John Rigby-Jones. Chris has over 25 years of geotechnical engineering, geophysical and commercial experience, including for large consultancies working at senior level on major infrastructure projects. His current role focuses on promoting the commercial application of CSW testing in UK practice.

