


Services on Demand
Article
 English (pdf)
 Article in xml format
 Article references
Indicators

Related links
-
 Cited by Google
 -
 Similars in Google
Share

 Permalink
Journal of the South African Institution of Civil Engineering
On-line version ISSN 2309-8775
Print version ISSN 1021-2019
J. S. Afr. Inst. Civ. Eng. vol.59 n.2 Midrand Jun. 2017
http://dx.doi.org/10.17159/2309-8775/2017/v59n2a4
TECHNICAL PAPER
Revised regional sediment yield prediction methodology for ungauged catchments in South Africa
V C Msadala; G R Basson
ABSTRACT
This paper presents the research on the revision of the regional probabilistic method (Rooseboom et al 1992) for the prediction of catchment sediment yields in South Africa. The determination of sediment yields using probabilistic or empirical methods is suitable for ungauged catchments in the absence of observed data. The prediction of sediment loads is a key component in the quest to deal with reservoir and river sedimentation which is a potential threat to the sustainability of water resources in southern Africa.
The revision was necessitated by increased sediment data availability and improved data analysis tools. Ten new sediment yield regions were demarcated in South Africa and Lesotho. Two analytical approaches were developed, namely probabilistic and empirical. The probabilistic approach is applicable in sediment yield Regions 3, 6 and 9. The empirical approach is applicable in sediment yield Regions 1, 2, 4, 5, 7 and 8. The estimation of sediment yields in Region 10 (Lesotho Highlands) needs to be based on direct measurements and locally observed data since no adequate analysis of sediment loads was possible due to limited data. GIS and electronic portable document file (pdf) copies of maps were produced for the retrieval of catchment data.
Keywords: sediment yield, analytical, probabilistic method, empirical method, ungauged catchments
INTRODUCTION
Sediment affects the water quantity and quality in rivers, lakes and reservoirs. The analysis of reservoir sedimentation rates in South Africa indicated an estimated mean annual loss in original storage capacity of 0.4% per year. Although the estimated global reservoir sedimentation rate is 0.8% per year (ICOLD 2009), the sedimentation rate in South Africa is quite significant considering the extent of increased water demand across southern Africa. Almost 25% of the total number of reservoirs that were analysed in South Africa had lost between 10% and 30% of their original storage capacity. This calls for increased attention towards reservoir sedimentation problems.
There have been extensive studies with regard to sediment transport in rivers and reservoirs in South Africa dating back some 50 years. Some of the studies resulted in the development of the sediment yield map of southern Africa and a treatise on sediment transport in rivers and reservoirs by Rooseboom et al (1992). The latter resulted in what was considered as a basic handbook for sediment yield prediction. With time it became apparent that the methods contained in the book needed to be updated to take into account the additional observed sediment data and technologically advanced data analysis tools.
OBJECTIVES OF THIS PAPER
This paper discusses the work carried out recently to revise the sediment yield prediction method by Rooseboom et al (1992). The detailed information on the research project is contained in a report to the Water Research Commission of South Africa (Msadala et al 2012). The objectives of the research project on the revision of the 1992 methodology were to use the most recent reservoir sedimentation and river sediment transport data, and to evaluate a regional empirical stream power approach in addition to the original probabilistic sediment yield prediction methodology, in order to improve the prediction accuracy.
SEDIMENT YIELD PREDICTION APPROACHES
In practice, the sediment yield at any reference point is found by applying the following four major approaches:
■ Direct measurements from reservoir sediment deposit surveys
■ River suspended sediment sampling
■ Catchment sediment yield mathematical modelling
■ Analytical methods such as sediment yield maps.
Two analytical approaches were evaluated, namely the probabilistic method (Rooseboom et al 1992) and the empirical method. The probabilistic method was based on statistical analysis of observed data, particularly newly calculated sediment yield data, and the revised erosion hazard classes. The empirical method was based on the total input stream power concept in terms of the direct relationship between the observed sediment yields or loads and the selected predictor variables within a region. South Africa, including Lesotho, was demarcated into ten relatively homogeneous sediment yield regions. The new empirical method was observed to have better predictive accuracy levels (when compared to the probabilistic method) in sediment yield regions with relatively large sample sizes. Based on the guidelines by Knofczynski and Mundfrom (2008) on the minimum sample size and the squared population multiple correlation coefficients needed for better predictions, it was observed that the empirical method could only be considered more accurate in sediment yield Regions 1, 2, 4, 5, 7 and 8. Since the prediction levels of the multiple regression models for the empirical method in Regions 3, 6 and 9 were not good, a revised probabilistic method (Rooseboom et al 1992) was implemented. As such, the probabilistic method is applicable to sediment yield Regions 3, 6 and 9, while the empirical method is applicable to sediment yield Regions 1, 2, 4, 5, 7 and 8. The estimation of sediment yields in Region 10 (Lesotho Highlands) should be based on direct measurements and locally observed data since no adequate probabilistic or deterministic analysis of sediment loads and predictor variables was possible due to limited data.
DATA COMPILATION AND ANALYSIS PROCEDURES
The observed sediment yields were obtained from the latest reservoir survey data and river suspended sediment sampling data. The Department of Water and Sanitation (DWS 2015) dam list of 2015 provided data on reservoir sediment deposition. Where reliable information was available, the sediment yields were obtained from technical or research reports of individual dams. The criteria for the validation of sediment deposit data for quality control purposes included evaluating the following aspects: records or period between surveys had to be longer than ten years, a reliably high reservoir sediment trap efficiency (at least 97%) and the effects of raising or lowering of a dam (if any was done).
The mean annual runoff (MAR) was used to compute the trap efficiency indicator based on the storage capacity of a particular dam. The trap efficiency is indicated by the ratio of the storage volume (VW) against the MAR of the reservoir. The trap efficiency indicator was then used to quantify the estimated amount of sediment that was trapped out of the total sediment inflow. In semi-arid regions, the storage capacity of a reservoir for irrigation or potable water use is usually in the order of the MAR of the catchment, and the reservoirs therefore trap approximately 97% of the sediment yield, with only colloidal sediment transported through the reservoir (Basson & Di Silvio 2008). The MAR data was obtained from the Surface Water Resources of South Africa 1990 (WR90) (Midgley et al 1994), which gives the MAR for each quaternary catchment in South Africa.
The effective catchment area was applied in the calculation of the sediment yield where reliably high reservoir sediment trap efficiency was computed for an upstream dam (if any). Furthermore, the trap efficiency was taken into consideration only if there was a common period of sampling or surveying between cascaded dams.
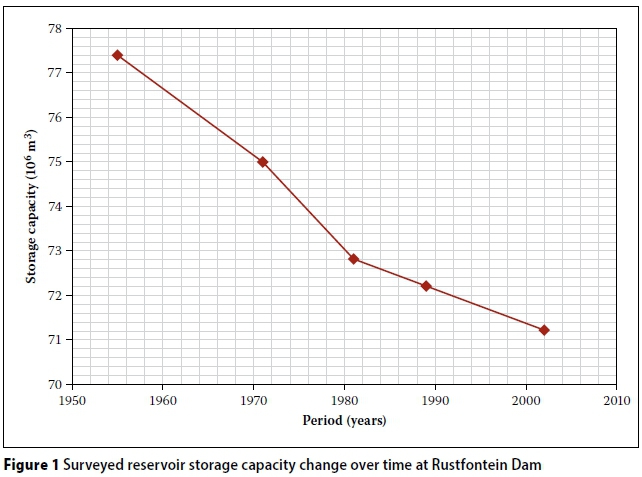
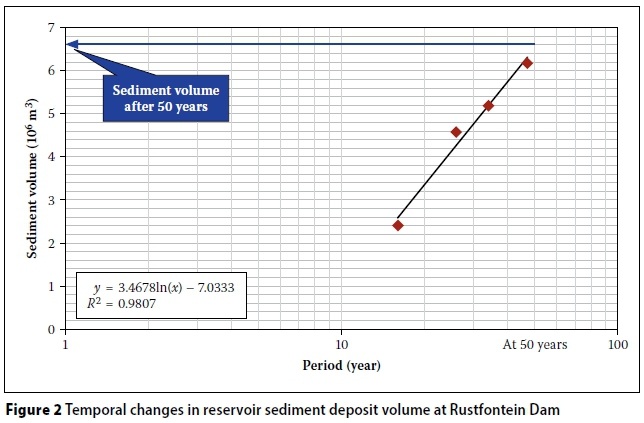
The difference between the initial storage capacity and the subsequent storage capacities, as illustrated in Figure 1, is related to the surveyed sediment that is deposited in the reservoir. A graph was used to predict the volume of sediment in the reservoir after or at 50 years, as shown in Figure 2. According to Rooseboom et al (1992), the sediment volume after 50 years is considered to be a true reflection of accumulated sediment in the reservoir, because by that time sufficient consolidation is expected to have taken place. After 50 years of deposition, the average sediment density can be taken as 1.35 t/m3. This average density of sediment is considered in this case, due to the potential consolidation characteristics of fine sediment (clay and silt). A logarithmic trend line was fitted through the data points to determine the 50-year sediment volume from the equation of the trend line. This was based on the assumption that a logarithmic relationship exists between the sediment deposited in a reservoir and the time period (Rooseboom et al 1992). The 50-year sediment volume and the effective catchment area were used to compute the sediment yield or load at the dam.
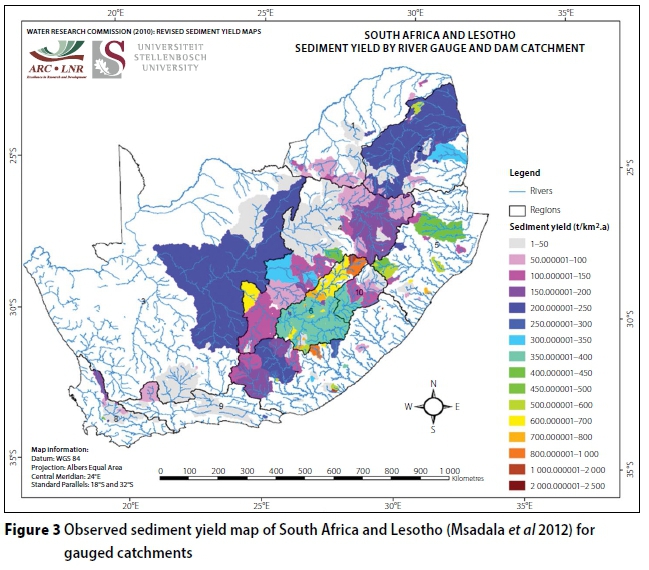
A map of observed sediment yields is given in Figure 3. It should be noted that it was not an objective of this study (Msadala et al 2012) to develop a sediment yield map by extrapolating the map in Figure 3 to ungauged catchments, but to develop a calculation methodology for the prediction of sediment yields or loads in ungauged catchments in South Africa.
The revised sediment yield values were sometimes higher for similar dams when compared to those of the 1992 sediment yield map of Rooseboom et al (1992) and vice versa. Nevertheless, a statistical analysis of the general trends in the sediment yields showed that the newly calculated sediment yields were comparatively higher. Based on this finding, the sediment yields in South Africa are generally increasing and this could be attributed to land use change.
THE PROBABILISTIC APPROACH Background
The probabilistic approach was an updated methodology that was based on the previous report's (Rooseboom et al 1992) fundamental assumptions. The main underlying assumption in the probabilistic approach is that the fine cohesive sediment transport is dependent on sediment availability, and in turn sediment availability is influenced by the soil erosion hazard. This was a rather crude assumption, considering the dominant role of other significant sediment-controlling factors, such as river network density and floods that could also affect the sediment yield of a catchment. The probabilistic analysis approach relates the erosion hazard classes within known catchment areas to the corresponding observed sediment yields within a homogeneous sediment yield region.
Demarcation of the new sediment yield regions
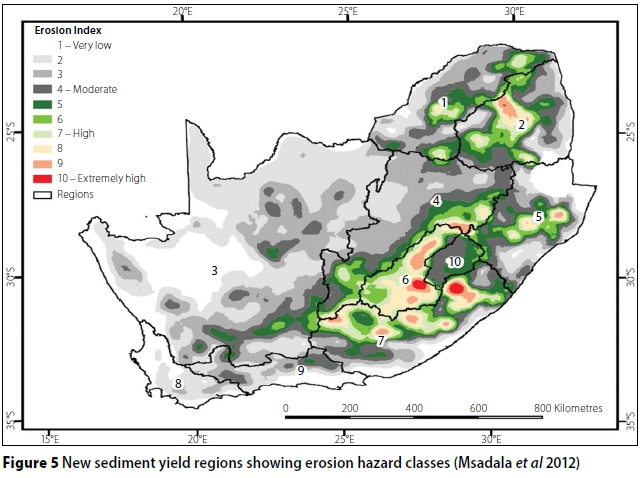
The identification and demarcation of regional boundaries were based on the latest calculated sediment yields, hydrological parameters such as watershed quaternary boundaries, flood regions and soil erosion hazard classes. The previous sediment yield regions of Rooseboom et al (1992) are shown in Figure 4, and the revised sediment yield regions (Msadala et al 2012) are shown in Figure 5. Figures 4 and 5 give erodibility indices and erosion hazard classes respectively, which are basically different quantitative classification criteria of erosion risk at national scale.
Soil erosion hazard classes
The erosion hazard classes were generated after a re-assessment of the soil erosion risk in South Africa and Lesotho. Lesotho was included due to its importance in the Senqu-Orange River catchment. The soil erosion hazard classes were based on the original erosion map by Morgenthal et al (2006) and the water erosion prediction map by Le Roux et al (2008), whereby newly improved cover and topography factor maps were applied. Ten erosion hazard classes were identified using Geographical Information Systems (GIS) spatial data analysis tools. According to Figure 5, very low erosion hazard was taken as Class 1, and Class 10 represented extremely high erosion hazard. The decision to use ten erosion hazard classes was necessitated by the high variability in erosion hazard potential across southern Africa. The use of three groups of erodibility indices in the previous methodology (Rooseboom et al 1992) was found to be not representative enough with respect to the observed erosion potential in the characteristically diverse homogeneous regions. Hence, the current approach proved to be a significant improvement in the prediction accuracy of sediment yields.
The probabilistic methodology
The probabilistic analysis applied the proportion of area out of the total catchment area that was covered by each individual erosion hazard class. Each observed sediment yield value was associated with its corresponding single dominant erosion hazard class (Erosion Index - EI) within the catchment area. The single dominant erosion hazard class per catchment was based on the weighted average erosion hazard class that was converted to the nearest integer in the range of 1 to 10. The sediment yield values for dam and river catchments with similar dominant erosion hazard classes were grouped together. The median values of the sediment yield values with similar dominant erosion hazard class were computed.
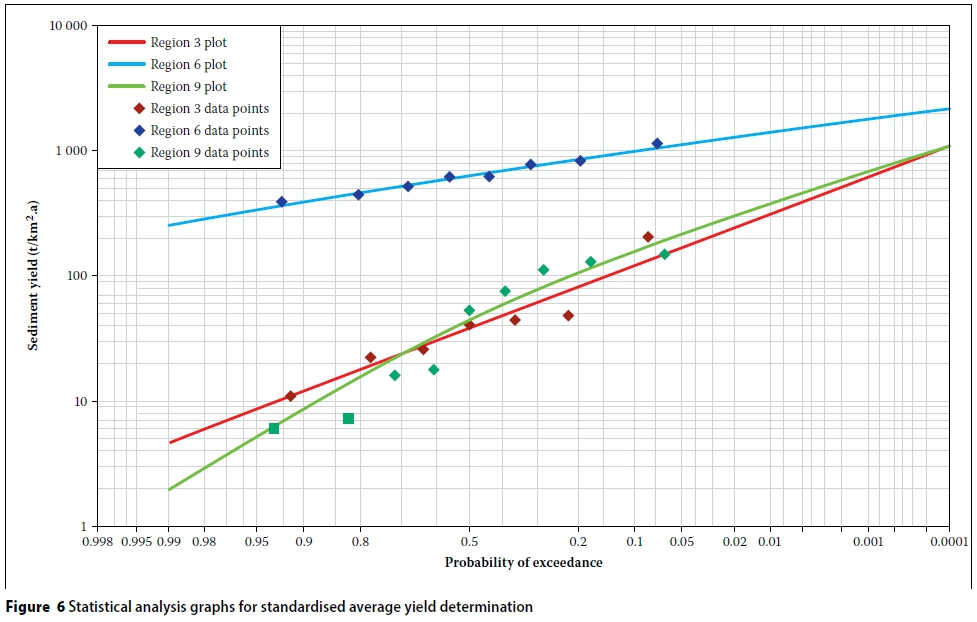
Probabilistic analysis was done to obtain sediment yields for all the required probabilities of exceedance within a region. The plotting of sediment yields data on a graph at the required exceedance probability was done manually using Microsoft Excel. Three distribution parameters were employed to statistically analyse the data, namely the Log Normal (LN), the Log Pearson III (LP3) and General Extreme Value using Mean Moments (GEVmm). The LN distribution was found to be best suited to data for Regions 3 and 6, while data for Region 9 was based on the average between the LN and Log GEVmm distributions' values, which gave a better fit. The main assumption in the probabilistic analysis was that the standardised average yield (SYsty) for each region, could be taken as the sediment yield at 50% exceedance probability from the statistical analysis plots in Figure 6.
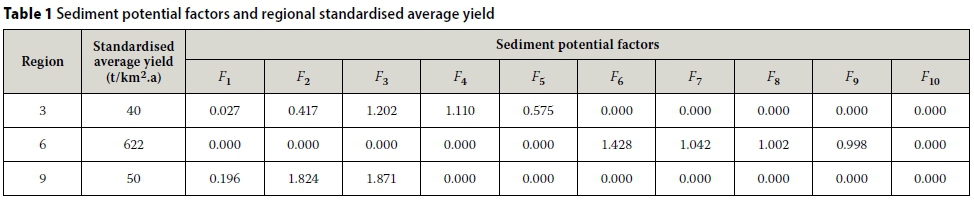
The probabilistic approach was designed to use sediment potential factors to relate the standardised average yield (SYsty) per region to the estimated sediment yield SYestfor an ungauged catchment within a homogeneous sediment yield region. The sediment potential factor was taken as the ratio of the median of each group of observed sediment yield with similar dominant erosion hazard class and the standardised average sediment yield.
For any ungauged catchment within these three regions, Equation 1 is used to predict or estimate the sediment yield SYest.

Where:
SYest= estimated median sediment yield value (t/km2.a)
SYsty= standardised average sediment yield value (t/km2.a) for a specific region.
The standardised average yield for each sediment yield region is shown in Table 1. to F10 are sediment potential factors, of which the values are also given in Table 1. A1 to in Equation 1 are catchment areas that are covered by erosion hazard classes 1 to 10 respectively within the total catchment AT.
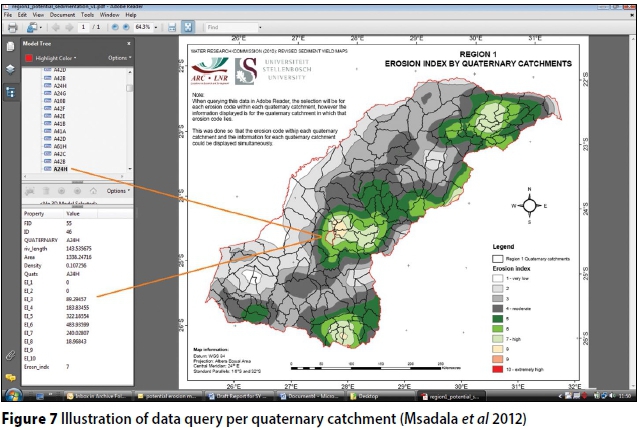
The determination of the area covered by each of the erosion hazard classes within the ungauged catchment to be applied in Equation 1 is illustrated in Figure 7, which shows a sample of an electronic portable document file (pdf) copy for sediment yield Region 1. The quaternary catchments are labelled based on the WR90 nomenclature, and in this particular case it relates to A24H. The area covered by each of the erosion hazard classes within a quaternary catchment can be displayed upon querying each of the individual quaternaries within the catchment boundary. The querying is done using the 'Object Data Tool' functionality in the 'Model Tree' viewing mode in Adobe Acrobat Reader. As shown in Figure 7, the user is provided with sediment-related quaternary data (as shown on the left pane) upon clicking within any quaternary.
Equation 1 only calculates the estimated median sediment yield value (SYest). In order to get the predicted sediment yield (termed the 'factored estimated sediment yield' (SYfest)), the estimated median sediment yield (SYest) value should be multiplied by a special multiplication factor. The multiplication factor, which is dependent on the preferred confidence limit, catchment area size and sediment yield region is obtained from sediment yield confidence limits graphs, which were specifically prepared for each of the three sediment yield regions. The relationship is shown below:
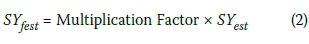
Where:
SYfest = Factored estimated median sediment yield value (t/km2.a).
Multiplication factors and confidence limits
The confidence limits are required to act as envelope values on the regional standardised average yield upon application of Equation 2. A 50% exceedance probability within a given region indicates that 50% of the predicted values could be lower, or 50% of the predicted values could be higher. By default a multiplication factor of 1 is applied at 50% probability of exceedance, such as when Equation 1 is used without considering confidence limits. The multiplication factors for selected confidence limits for Regions 3, 6 and 9 can be obtained from the appendices in the Water Research Commission Report (Msadala et al 2012).
Verification of results
The predictive accuracy of the probabilistic method was evaluated by using the discrepancy ratio test at 50% exceedance probability. The technique compares all the predicted sediment yields against all the observed sediment yields in terms of the discrepancy ratio Xiwhereby each predicted value is divided by the corresponding actual observed value. In mathematical terms the discrepancy ratio is given by the following relationship:
The predicted sediment yields were calculated using Equation 2 at 50% exceedance probability. The results were as follows:
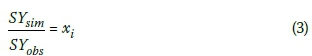
Where:
SYsim = predicted sediment yield
SYobs = observed sediment yield.
0.33 < xi< 3 (81% of the data was in this range)
0.5 < xi< 2 (68% of the data was in this range)
0.67 < xi<1.5 (43% of the data was in this range)
The predictive accuracy was also compared with the previous probabilistic approach (Rooseboom et al 1992) results, which were as follows:
0.33 < xi< 3 (70% of the data was in this range)
0.5 < xi< 2 (47% of the data was in this range)
0.67 < xi< 1.5 (32% of the data was in this range)
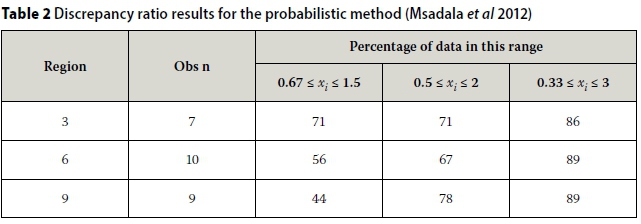
The results for each of the three regions are shown in Table 2 for the probabilistic approach.
These ranges were within the limits of acceptable predictive accuracy, considering the complex nature and spatial variability in sediment yields. The small number of observations in Table 2 had sufficient statistical significance within the objectives of the study, since the combined effect of the catchment areas represented a large significant proportionate area with respect to the total area in each of the homogeneous sediment yield regions that were under consideration.
Special considerations in using the probabilistic approach
The estimation of the sediment yield was developed from the average of the observed data series which was taken as the 50th percentile. For higher or lower percentiles, multiplication factors were proposed. These factors are supposed to be applied with caution in order to avoid over-prediction. The probabilistic approach predicts a sediment yield value that statistically masks all possible values with respect to the selected probability of exceedance for a specific region. Specifically the results showed that for some low observed sediment yields, particularly less than 100 t/km2.a, the method gives relatively higher predicted sediment yields for ungauged catchments, and vice versa.
Two cautionary measures are recommended. Firstly, it is necessary to check the predicted sediment value at 50% confidence limit against the nearest observed yield values within the region. Secondly, the graphs for the statistical distribution shown in Figure 6 (probability of exceedance) of the observed sediment yields for the each of the regions can be used to compare the predicted value against the expected sediment yield value on the graph at any specific probability of exceedance. These graphs give an estimate of the general variation of the expected sediment yields within a given homogeneous region.
THE EMPIRICAL APPROACH
Theoretical basis - the concept of total input stream power
The empirical approach was aimed at establishing the relationships between sediment yield and any data that pertains to significant variables which are involved in sediment transport and yield processes. The total input stream power was the basis on which the empirical equations were derived through regression analysis. The regression analysis of the variables was done per sediment yield region.
The rate of energy dissipation that would be required to transport material is related to the rate of material to be transported according to the general concept of physics. According to Yang (1996), the sediment transport rate is directly related to the unit stream power. Therefore, sediment transport can be described by the following total input stream power relationship:
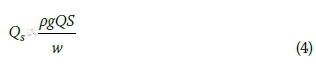
Where:
Qs= sediment load (t/a)
Q = discharge (m3/s)
s = energy slope (m/m)
w = settling velocity of sediment (m/s)
pgQS = total input stream power (pg is assumed constant).
Equation 4 assumes that there is sediment transport capacity based on the local hydraulic conditions and sediment characteristics. This is generally true for coarse sediment (sand and gravel), but in the South African conditions where more than 75% of the sediment transported consists of clay and silt fractions, the sediment transport capacity is high, but the sediment availability from the catchment could be limited. Therefore, additional variables had to be considered to account for the sediment availability. In other words, it was assumed that there is a combined effect of both sediment production and transport capacity controlling factors related to hydraulic conditions and sediment characteristics. The settling velocity variable was not included in the regression model, because of the difficulty with which it could be universally determined at a catchment scale.
A weighted erosion hazard class (EIw) was added to the regression model to account for sediment production. River network density (Rn(j) is a parameter that affects sediment transport through the catchment. The catchment area (A) was also added to describe the sediment source spatial extent and characteristics. The discharge (Q) was based on a recurrence interval flood proposed to be the 10-year annual recurrence interval (ARI) flood. This was established through regression analysis accuracy checks of all available recurrence interval floods to determine the ARI that best fitted the data. The energy slope (S) for a catchment was taken as the average river slope of the longest water course.
Derivation of the empirical equations
According to Rooseboom et al (1992), sediment transport is a hydrological process, and therefore is a function of the same parameters that influence all hydrological processes. Hydrological data is usually strongly skewed, but the logarithms of the data have a near symmetrical distribution (Hazen 1914). The dependent variable of sediment load and the independent variables were logarithmically transformed and applied in multiple regression analysis in order to derive a better regression model. A column of the sediment load as a dependent variable, and five columns comprising the recurrence interval flood, average river slope, river network density, catchment area and weighted erosion hazard class (index) were prepared. The regression analysis was performed in Microsoft Excel 2007.
The proposed equations showing the results of the derived coefficients after regression analysis and correlation against observed data are shown in Table 3.
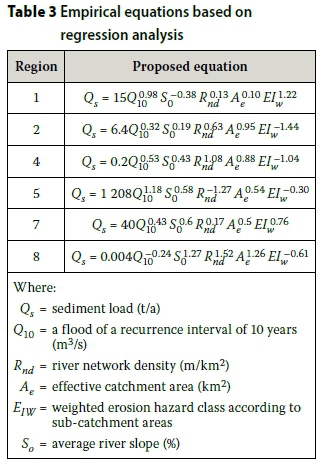
The equations in Table 3 can be used to predict the sediment yield or load in an ungauged catchment as long as accurate data with respect to the specified variables is applied. The weighted erosion hazard class can be determined using data obtained from electronic portable document files (pdf ) or GIS maps using a similar procedure that was explained under Figure 7. The electronic version of these maps were prepared as part of the WRC project (Msadala et al 2012) and were included as part of the report appendices of maps. The weighting of the erosion hazard classes is with respect to the catchment area covered by each erosion hazard class. The 10-year ARI flood and effective catchment area can be calculated using standard hydrological methods. Similarly, the river network density can be obtained from the electronic pdf maps in km/km2 per quaternary based on the data, such as that given in Figure 7. It should be noted that electronic pdf maps give river network densities in km/km2 units, and these values need to be converted to m/km2 prior to applying in any of the equations in Table 3. Using the area for each quaternary, the river length per quaternary can be computed by multiplying the total area and the corresponding river network density, and then summing up all river lengths for all quaternaries to give the total river length in the whole catchment. Finally, the river network density for the whole catchment can be computed by dividing the total river length against the total catchment area under consideration.
Significance of the variables in the empirical equations
Weighted erosion hazard class
The weighted erosion hazard class basically provides a quantitative measure of the following parameters: climate, soil profile, relief, vegetation, land use and land management practices based on the Revised Universal Soil Loss Equation (RUSLE) model of Renard et al (1991).
River network density
Drainage density is a measure of the length of stream channel per unit area of basin. River network drainage density can be classified as one of the factors that determine the catchment's sediment yield according to Strand and Pemberton (1982). It can be assumed that, with all factors equal for the same catchment area, longer lengths of river channel per unit area must be able to transport more sediment than shorter river channels within the catchment.
Recurrence interval flood
In the original application of the unit stream power, the instantaneous discharge was used in the relationship to describe the sediment transport. However, when considering sediment load over a long period of time, an effective discharge passing through a point along a river or a reservoir would best be represented by a recurrence interval flood, since more sediment is transported during floods than the mean runoff from the catchment.
Homogeneous regions and catchment areas
The sediment load must be related to the catchment area in order to account for homogeneity. It was therefore decided that the regression analysis should include the parameter of the catchment size as one of the variables.
Confidence intervals
The prediction of the sediment load using the empirical method also requires confidence limits. The equations in Table 3 calculate the value of the predicted sediment load around an assumed regional mean, which is at 50% confidence limit. The multiplication factors for the other required confidence limits for Regions 1, 2, 4, 5, 7 and 8 can also be obtained from the appendices in the Water Research Commission Report (Msadala et al 2012).
Verification and analysis of results
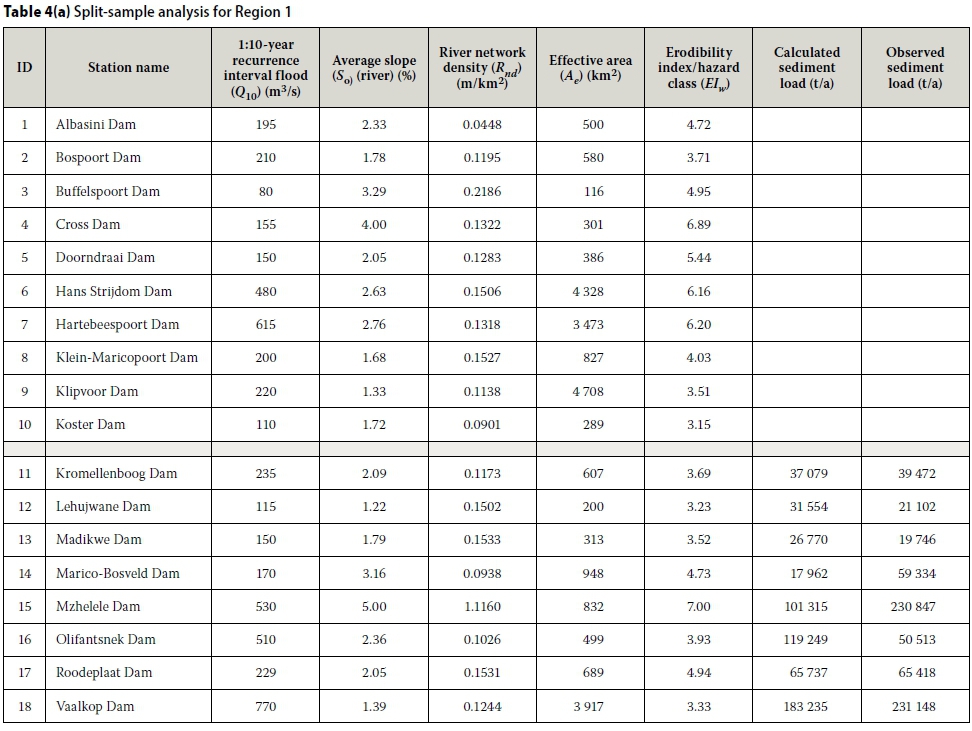
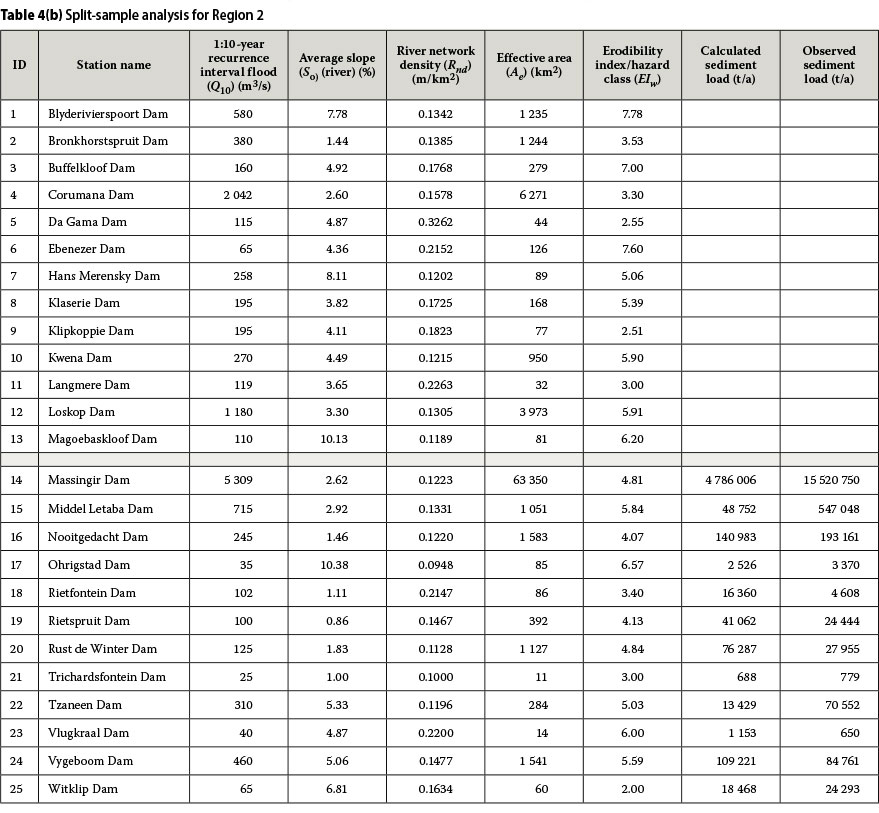
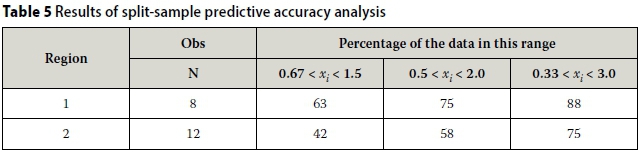
The sample was split, and one portion of the sediment load was used for independent verification of the results of the empirical model. The verification exercise using the split-sample method in the two regions (Regions 1 and 2) that had relatively larger sample sizes showed that the predictive accuracy of the empirical method was relatively good. Tables 4a and 4b show the data that was used for split-sample analysis in Regions 1 and 2. Ten observations were applied to derive a regression equation for Region 1. The results were used to predict the sediment loads for the remaining eight independent observations within the same region. A similar procedure was done for Region 2 and the summary of split-sample analysis results for both Regions 1 and 2 is shown in Table 5.
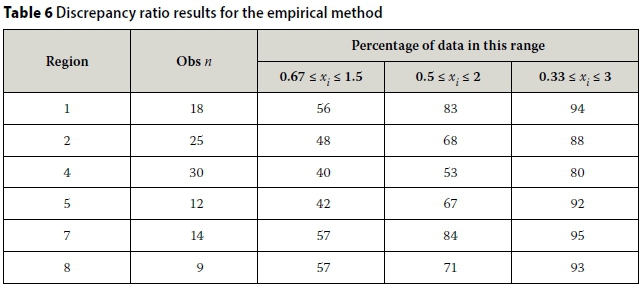
The empirical equations in Table 3 were derived from all the observations in the given region. The predictive accuracy checks per region were done by way of inspection of the discrepancy ratio. Table 6 shows the results of the discrepancy ratio test for each region.
The discrepancy ratio results in Table 6 were analysed and found to be within acceptable predictive accuracy limits and are satisfactorily good when one considers the general erratic behaviour of fine sediment transport and the ranges of predictive accuracy that were achieved in the previous methodology (Rooseboom et al 1992). In some regions, there were outliers, but overall they were checked to have no significant effect on the overall predictive accuracy of the regression equations.
CONCLUSIONS AND RECOMMENDATIONS
Methods for the prediction of sediment yields in ungauged catchments were developed. The accuracy of predictions using the revised sediment yield methods is higher than those of Rooseboom et al (1992).
The proposed methods are based on long-term average sediment yields, and therefore regional confidence limits need to be applied to scale up (or down) the predicted sediment yields to typically expected values based on expert knowledge and knowledge of the ungauged catchment under investigation. Realistic predictions are possible using both the probabilistic and empirical methods in their respective regions. However, where observed data is available, it is always recommended to use observed data, since the regional probabilistic and empirical methods have limited predictive capability due to the range of calibration data and conditions from which they were derived.
There is need for continued monitoring and measurement of sediment load at existing and additional sampling stations in order to accumulate sufficient long-term data for calibration and validation during mathematical modelling in the future.
Based on the prediction accuracy of the sediment yield prediction methods discussed in this paper it is proposed that the 95% confidence limit is considered in sediment yield prediction of ungauged catchments for the current development scenario.
The proposed sediment yield prediction methods of this paper are based on historical data and therefore do not account for future land use change with possible land degradation, or climate change impacts.
ACKNOWLEDGEMENTS
The authors would like to acknowledge the the Water Research Commission of South Africa for funding the research, and the Department of Water and Sanitation of South Africa for providing data. The Institute for Water and Environmental Engineering, in the Department of Civil Engineering at Stellenbosch University, carried out this research project in conjunction with the Institute for Soil, Climate and Water of the SA Agricultural Research Council who were appointed as part of the project for specialist inputs on soil erosion hazard maps and Geographical Information Systems (GIS).
REFERENCES
Basson, G R & Di Silvio, G 2008. Erosion and sediment dynamics from catchment to coast. UNESCO, International Hydrological Programme, Technical Documents in Hydrology, No. 82. [ Links ]
DWS (Department of Water and Sanitation) 2015. Damlist. Pretoria: Ministry of Water and Environmental Affairs. [ Links ]
Hazen, A 1914. Discussion on "floodflows" by W E Fuller. Transactions of the American Society of Civil Engineering, 77: 626-632. [ Links ]
ICOLD (International Commission on Large Dams) 2009. Sedimentation and sustainable development of dams in river systems. ICOLD Bulletin, Paris, France: ICOLD. [ Links ]
Knofczynski, G T & Mundfrom, D 2008. Sample sizes when using multiple linear regression for prediction. Educational and Psychological Measurement, 68, 431-442. [ Links ]
Le Roux, J J, Morgenthal, T I, Malherbe, J, Smith, H J, Weepener, H L & Newby, T S 2008. Water erosion prediction at a national scale for South Africa. Water SA, 34(3): 1-10. [ Links ]
Midgley, D C, Pitman, W V & Middleton, B J 1994. Surface water resources of South Africa (WR90). Volumes I-VI (Appendices) and Volume I-VI (Maps), WRC Report Nos 298/1.1/94, 298/1.2/94, 298/2.1/94, 298/2.2/94, 298/3.1/94, 298/3.2/94, 298/4.1/94, 298/4.22/94, 298/5.1/94, 298/5.2/94, 298/6.1/94, 298/6.2/94, Pretoria: Water Research Commission. [ Links ]
Morgenthal, T L, Malherbe, J, Van Zyl, D & Newby, T S 2006. Evaluation of MODIS satellite data as an assessment tool to audit the state of agricultural resources. ISCW Report No. GW/A/2006/72, Pretoria: ARC Institute for Soil, Climate and Water. [ Links ]
Msadala, V P, Basson, G R, Rooseboom, A, Le Roux, J & Gibson, L 2012. Sediment yield prediction for South Africa, 2010 edition. WRC Report No. K5/1765. Pretoria: Water Research Commission. [ Links ]
Renard, K G, Foster, G R, Weesies, G A & Porter, J P 1991. RUSLE: Revised Universal Soil Loss Equation. Journal of Soil and Water Conservation, 46(1): 30-33. [ Links ]
Rooseboom, A, Verster, E, Zietsman, H L & Lotriet, H H 1992. The development of the new sediment yield map of South Africa. WRC Report No. 297/2/92, Pretoria: Water Research Commission. [ Links ]
Strand, R I & Pemberton E L 1982. Reservoir sedimentation technical guidelines for Bureau of Reclamation. Denver, CO: U.S. Bureau of Reclamation, 48. [ Links ]
Yang, C T 1996. Sediment Transport: Theory and Practice. New York: McGraw-Hill. [ Links ]
 Correspondence:
V C Msadala
Department of Civil Engineering
Stellenbosch University
Private Bag X1
Matieland
7602
South Africa
T: +265 888 817 470 / +265 882 750 550
E: vmsadala@gmail.com
G R Basson
Department of Civil Engineering
Water Division
Stellenbosch University
Private Bag X1
Matieland
7602
South Africa T: +27 21 808 4355
E: grbasson@sun.ac.za

DR VINCENT MSADALA holds PhD and MSc degrees in Hydraulic Engineering from Stellenbosch University. He has worked as a lecturer at the University of Malawi in the Department of Civil Engineering. His research interests are in hydraulics, hydrology and water resources development. Vincent is a member of the South African Institution of Civil Engineering (SAICE).

PROF GERRIT BASSON is Head of the Water Division, Department of Civil Engineering, Stellenbosch University. He specialised in river hydraulics, sedimentation and design of hydraulic structures. He worked for ten years at consulting engineers in South Africa, then joined the University of Pretoria in 1997, ' ' and since 2000 he is based at Stellenbosch University. He has worked on projects in 21 countries and has 30 years' experience as hydraulic engineer. He recently served the dam engineering industry as Vice-President of the International Commission on Large Dams (ICOLD), from 2012 to 2015. Prof Basson is also a Member of the South African Institution of Civil Engineering (SAICE).

