


Services on Demand
Article
 English (pdf)
 Article in xml format
 Article references
Indicators

Related links
-
 Cited by Google
 -
 Similars in Google
Share

 Permalink
Journal of the South African Institution of Civil Engineering
On-line version ISSN 2309-8775
Print version ISSN 1021-2019
J. S. Afr. Inst. Civ. Eng. vol.59 n.1 Midrand Mar. 2017
http://dx.doi.org/10.17159/2309-8775/2017/v59n1a2
TECHNICAL PAPER
Planning for desalination in the context of the Western Cape water supply system
C L Blersch; J A du Plessis
ABSTRACT
As water demands continue to grow, South Africa is starting to consider seawater desalination as a potential future supply source, and it is currently being investigated at a feasibility level in a number of coastal cities, including Cape Town. Desalination is different to conventional surface and groundwater supply sources in that it is climate-resilient, having an assurance of supply of essentially 100 percent. However, the increased reliability comes at a great cost. This paper presents a methodology developed for modelling a proposed desalination plant as an integrated component of the Western Cape Water Supply System, in order to optimise system operating rules and cost. The modelling entailed short-term and long-term system analyses in the Water Resources Yield Model and Water Resources Planning Model, and estimation of first-order capital and operating costs in order to calculate and compare Unit Reference Values. The maximum increase in yield was found to occur when the seawater desalination plant is used as a base supply, operational all the time. There was little benefit, in terms of system yield, in using the desalination plant as an emergency supply source only. Unit reference values for the desalination plant decrease as the percentage supply from the plant increases, meaning that the lowest possible cost per cubic metre of water supplied is when the desalination plant is used as a base supply. It was also apparent that the unit reference values decrease with an increase in desalination plant capacity, suggesting that, from an economic perspective, the optimal solution would be to have one large desalination plant operational immediately.
Keywords: seawater desalination, water resource planning, system analysis
INTRODUCTION
Desalination can take the form of seawater desalination, desalination of brackish or polluted groundwater and the use of membrane processes in advanced water treatment processes for water reuse. All of these forms of desalination are relevant in South Africa and are currently being considered as possible supply sources for many major cities, including Cape Town. However, the focus of this paper is seawater desalination only, firstly because it is likely to be a large-scale supply source (as opposed to brackish groundwater desalination which will be on a much smaller scale), and secondly because the practicality and acceptance of reuse of treated effluent has not yet been fully researched in South Africa. Further limitations are discussed in the conclusion of the paper.
Historically, less costly surface and groundwater resources have been available to meet South Africa's water demands, meaning that seawater desalination has not been considered a viable water source. There are currently only six small desalination plants in operation in the country, half of which were constructed as emergency schemes in response to the severe Southern Cape drought of 2009/2010. However, as growing water demands place pressure on water resources, desalination has begun to gain traction as a viable alternative. Seawater desalination is currently being investigated at a feasibility level in Saldanha Bay, Cape Town, Port Elizabeth and Durban, and is mentioned in all of the national water planning documents (Department of Water Affairs and Forestry 2008:26; Department of Water Affairs 2010:7; Department of Water Affairs 2013b:31).
Considering the existing plants, there have been some limitations in terms of integrated planning for seawater desalination in South Africa. In Mossel Bay, for example, a 15 Mℓ/day seawater desalination plant was constructed in 2011 in response to the severe drought in the area. Since the commissioning of the plant, it has remained virtually untapped, with the municipality preferring to make use of its less expensive surface water resources (Mallory et al 2013). Similar problems have been experienced in Australia, where large-scale seawater desalination was implemented, at great cost, in response to a decade-long drought (Onishi 2010).
A feasibility study for large-scale seawater desalination for Cape Town is currently under way. The decision regarding when to proceed with seawater desalination will most likely be driven by the feasibility study and Western Cape Water Supply System (WCWSS) planning mechanisms. However, seawater desalination differs from the surface and groundwater resources of the WCWSS, firstly in its higher capital and operating costs, and secondly in its resilience to climate variability, having an assurance of supply of essentially 100 percent. Factors such as integration into the WCWSS, supply risks and cost implications may therefore be more relevant in evaluating desalination than a 98 percent assurance of supply from traditional water supply options, as is currently the case. The higher costs and assurance of supply of desalination will also impact on the overall operational philosophy.
The aim of this research was to determine what operating rules and modified planning criteria are required to optimise the implementation of large-scale desalination as part of the WCWSS, in order to ensure cost-effective provision of water at an appropriate assurance of supply.
BACKGROUND AND LITERATURE REVIEW
Existing Western Cape Water Supply System
The Western Cape area is characterised by a Mediterranean climate, with rainfall occurring in the winter months (May to October) when demands are low, and minimal rainfall occurring in the summer months when demands are high. Approximately 50 percent of the total system storage is available for storing winter flows to meet summer demand, with the remaining 50 percent required for long-term drought storage (Shand & Sparks 2004:3). The main dams of the WCWSS are operated as an integral system in order to reduce the probability of spillage, hence increasing the overall system yield (Department of Water Affairs 2007:31).
The WCWSS supplies water to various towns and irrigators in the Western Cape, including the City of Cape Town. The latest WCWSS planning documents give the total water usage from the system as 503 million m3/a in 2013 (Department of Water Affairs 2013a:21) and the total integrated system yield at a 98 percent assurance of supply as 596 million m3/a (Department of Water Affairs 2011:7). To manage demands, yield and planning models of the WCWSS have been set up in the Water Resources Yield Model (WRYM) and Water Resources Planning Model (WRPM) respectively in order to simulate the inflows and demands on the system and plot storage trajectories of the coming year. These models (WRYM and WRPM) are run annually in November in order to determine whether the dams are full enough to meet the projected summer demands at the required assurance of supply, or whether water restrictions should be implemented (Shand & Sparks 2004:6).
Seawater desalination as possible future supply source for the WCWSS was first assessed at a pre-feasibility level in 2003 as part of the Bulk Water Supply Study. A feasibility study was commissioned in 2011, and was set for completion at the end of 2013, although the findings have not yet been released. The anticipated capacity based on the feasibility study would be 150 Mℓ/day, upgradeable to 450 Mℓ/day (Department of Water Affairs 2013a:12).
Local research into desalination and integrated system modelling
Despite the various feasibility studies which are currently under way, and the ambitious outlook for seawater desalination development in South Africa, there has been little research into the conjunctive use of seawater desalination with surface water supply sources, and how to integrate seawater desalination plants into existing water supply systems. The only South African authors who have presented any material on the topic are Mallory et al (2013) who undertook a study into the optimal operation of the sea-water desalination plant in Mossel Bay using the Water Resources Modelling Platform. The work of Mallory et al (2013) began to tackle some of the key questions associated with the value of water to different users, and setting of operating rules for a desalination plant.
Although not specifically related to sea-water desalination, the work of Van Niekerk and Du Plessis (2013a:543) into the conjunctive evaluation of the costs and benefits of inter-basin water transfer schemes illustrates a number of useful principles which could be easily applied to integrate system modelling for seawater desalination. Van Niekerk and Du Plessis (2013a:543) found that the so-called incremental approach has historically been followed in evaluating the viability of inter-basin transfer schemes, which assumes that volume transferred per annum is equal to the difference between the projected future water demands and the current system yield. The authors found that the original projections vastly exceeded the actual transfers, mainly because the incremental approach ignores the stochastic nature of the conditions of the receiving system. To address these concerns, Van Niekerk and Du Plessis (2013a:543) propose a comprehensive approach in which the receiving water basin and the transfer scheme are modelled stochastically as an integrated system in the WRPM. Taking this concept further, Van Niekerk and Du Plessis (2013b:551) postulate that the results of such an analysis should be used when calculating the Unit Reference Value (URV) of any newly proposed scheme (Van Niekerk & Du Plessis 2013b:552).
Estimating desalination costs
South African approach to desalination costing
Du Plessis et al (2006) present a step-by-step guide to determining first-order capital and operating costs for desalination plants of different sizes in South Africa. The process centres on selecting a plant capacity, determining the required membrane area and feed water pressures, and calculating capital and operating costs with these parameters as a base. In terms of capital costs, the desalination cost component can be estimated as a function of the membrane area, the pre-treatment costs can be calculated as a function of the feed flow rate, and the combined cost of the intake, outlet and post-treatment systems can be estimated as a percentage of the capital cost of the desalination plant and pre-treatment system (15 to 30 percent).
Du Plessis et al (2006) suggest that the operating costs comprise energy costs, which can be estimated based on the total energy requirement of the plant (which is primarily a function of feed-water pressure), chemical costs of approximately R0.50/m3, membrane replacement costs based on a unit cost of R165/m2 of membrane area and a membrane lifespan of six years, and annual labour and maintenance costs of about 5 percent of the total capital cost. All costs and rates provided by Du Plessis et al (2006) are for a base date of 2006 and were escalated to 2014 at 6 percent per annum.
This methodology was applied to the proposed Cape Town desalination plant, situated on the west coast, based on a capacity of 100 Mℓ/day and a two-pass system, giving a first-order (2014) estimate of the capital cost of R1 054 million and the total specific cost of R16.44/m3.
International seawater desalination literature
In terms of international literature on seawa-ter desalination cost estimation, Karagiannis and Soldatos (2008) studied almost 100 different seawater desalination plants and presented a summary of first-order desalination costs derived from literature. Based on their costs, a 100 Mℓ/day seawater desalination plant would cost approximately R9.84/m3.
Similarly, Wittholz et al (2008) collated a database of over 300 seawater desalination plants and derived an equation for estimating capital costs for seawater reverse osmosis desalination plants based on the plant capacity. Using their equation, a 100 Mℓ/day seawater desalination plant would have an equivalent 2014 cost of R1 862 million and unit production cost of R9.95/m3. In a more recent study, Ghaffour et al (2013) provided a review of the economics of desalination worldwide, noting that unit water costs for seawater reverse osmosis desalination have decreased rapidly over the past decade, meaning that a 100 Mℓ/day plant could cost as little as R960 million.1
Analysis of known costs of seawater desalination plants
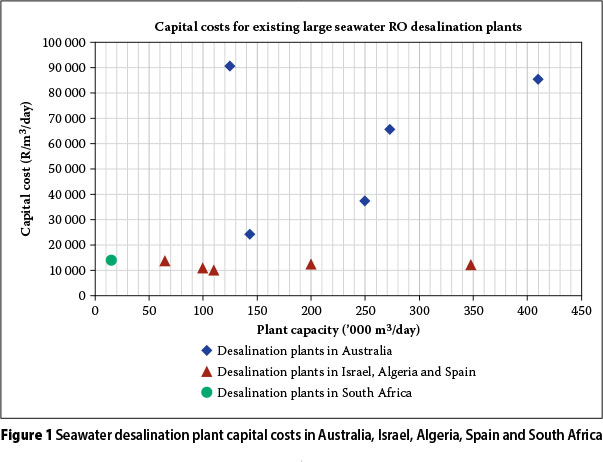
Figure 1 shows costs in Rand per m3/day of desalination plant capacity plotted against plant capacity for the recently constructed desalination plants in Australia, and plants in Israel, Algeria and Spain, extracted from Ghaffour et al (2013), and the Mossel Bay desalination plant, being the only large desalination plant in South Africa.
Attempts to derive any kind of relationship from the values presented in Figure 1 were unsuccessful, given the large scatter. One of the problems with desalination costs quoted in literature is that it is often unclear whether the costs are all-inclusive or for the desalination portion of the plant only (i.e. excluding intake and outlet structures or general civil works). This is particularly relevant for larger plants. It is clear that the Australian desalination plants were significantly more expensive than recent plants in other parts of the world, most likely a result of the emergency nature of the schemes, which invariably pushes up costs. However, for Israel, Algeria and Spain the costs are fairly similar across the range of capacities, varying from R10 700 to R14 600/m3/day of desalination plant capacity. At these rates, a 100 Mℓ/day seawater desalination plant would cost in the order of R1 290 million, which is comparable to the values derived from the methodologies found in the literature.
METHODOLOGY
Integration of seawater desalination into the WCWSS models
In order to model the integration of sea-water desalination into the WCWSS for the purpose of this research, an approach was required in which the desalination plant could be modelled as an integral component of the existing system. The WRYM and WRPM were selected as the most appropriate tools to achieve this. Given the long history involved in the development of the existing WCWSS models in WRYM and WRPM, it seemed logical to use them as the base for the modelling in this research. The latest versions of the WRYM and WRPM models of the WCWSS were obtained from Aurecon with the permission of the Department of Water and Sanitation (DWS)2.
Operating scenarios
After studying the existing operational philosophy of the WCWSS, four possible scenarios were developed for the implementation and integration of a seawater desalination plant:
■ Scenario A: Base scenario with current system and no desalination plant, representing the status quo or base case for comparison purposes.
■ Scenario B: Desalination plant used as a base load supply, always operational regardless of the conditions in the rest of the supply system.
■ Scenario C: Desalination plant used as a base load supply, but only if the major dams are not spilling.
■ Scenario D: Seawater desalination plant used as an emergency supply, only operational when the dams reach a certain threshold. Considering the penalty structure zones of the main reservoirs, four threshold or "trigger" levels were selected to give a representative spread. Based on the level-capacity curves of the major reservoirs, the four trigger levels were estimated to be equivalent to 90 percent, 70 percent, 45 percent and 15 percent of the capacity of the main system reservoirs.
For each of the desalination operating scenarios B to D, three different desalination plant capacities were tested, based on information extracted from the latest WCWSS SSC Progress Report (Department of Water Affairs 2013a:13), i.e. 150 Mℓ/day (54.8 million m3/a), 300 Mℓ/day (109.6 million m3/a) and 450 Mℓ/day (164.4 million m3/a).
Water Resources Yield Model (WRYM) setup
A number of options were considered and tested for modelling a seawater desalination plant in the WRYM and WRPM, including the use of "artificial natural runoff" files or a specified "inflow channel", as defined by the different models. These options would entail the creation of an inflow sequence to represent the seawater desalination plant, with uniform flows in each month equal to the seawater desalination plant capacity. Creating the requisite summary of statistical parameters for the inflow file for the purposes of stochastic analyses, however, proved challenging and, as a result, a simpler approach was adopted in which a "multipurpose min-max channel" was used as an inflow channel from a zero node. The capacity of the channel was constrained to the desalination plant capacity and an appropriate penalty was assigned to the channel in order to model all the selected operating scenarios.
Historic analyses were run for a total of 77 years (1928 to 2004) for a range of target drafts in order to determine the historic firm yield, and long-term stochastic analyses were run for a total of 51 sequences to calculate the long-term assurance of supply. The number of sequences were selected based on the suggestion of Basson et al (1994:34) that reasonable results in a long-term analysis can be obtained with at least 40 stochastic sequences, as well as consideration of other WCWSS planning studies.
Short-term stochastic analyses were also performed in the WRYM in order to create short-term yield curves for use in the WRPM. For short-term analyses, Basson et al (1994:34) suggest that at least five times the number of sequences used in a long-term analysis are required, hence at least 255 in this case. The most recent WRPM studies carried out by Aurecon use 401 sequences. Given that the computational time is much shorter for a short-term analysis, 401 sequences seemed reasonable, and were therefore used.
Water Resources Planning Model (WRPM) setup
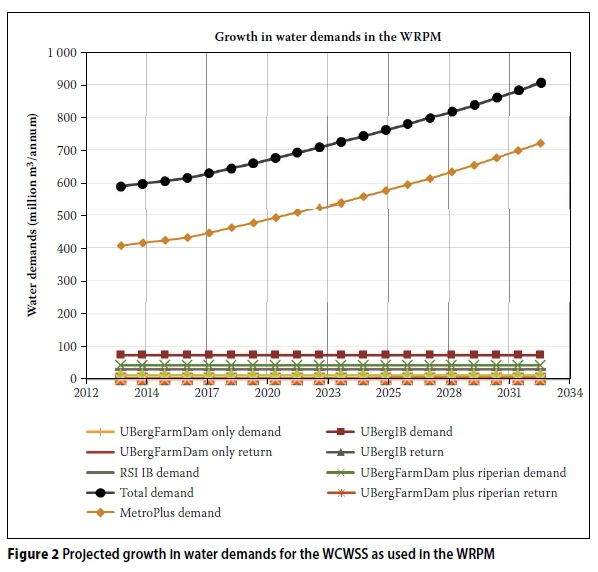
The WRPM setup was modified in the same way as for the WRYM. The base model setup had only ten years of growth information, starting in 2013, for the 12 master control channels. The growth factors were extended to cover a period of 20 years, based on the growth calculation spreadsheets prepared by Aurecon as part of a recent DWS study into operating rules for the WCWSS. The growth scenario assumes an increase in urban demands of 3 percent per annum, and that only 80 percent of the anticipated water conservation and demand management savings would be achieved. The projected demands for each master control channel are shown in Figure 2.
The WRPM was run for a period of 20 years starting in 2013. A total of 401 stochastic sequences were analysed in order to match the number of sequences used in deriving the short-term yield curves.
Cost estimation and calculation of URVs
In addition to comparing the yields and supply from the WCWSS with the introduction of seawater desalination, it was considered worthwhile to compare costs of the selected operating scenarios. Based on a review of the available costing methodologies, the South African approach followed by Du Plessis et al (2006) was selected as most fitting, given that it is a local methodology, uses membrane area rather than plant capacity alone to estimate capital costs, is simple to understand and apply, and for the test plant of 100 Mℓ/day compares well in terms of calculated costs to the methods considered.
The methodology of Du Plessis et al (2006) can be used for estimating capital and operating costs, but the methodology as is only gives unit costs of water based on average plant capacity. In order to provide costs which can be used to compare the operating scenarios, it was considered more appropriate to calculate URVs. The URV approach, as presented by Hoffman and Du Plessis (2008), was adapted by Van Niekerk and Du Plessis (2013a) by using the actual volume of water supplied based on a stochastic analysis in the WRPM to calculate the URVs of inter-basin transfers. This approach was applied to the WCWSS by using the modelled annual volumes of water supplied from the desalination plant, as extracted from the WRPM analyses to calculate costs. The following adaptations were made to the costing approach of Du Plessis et al (2006) in order to provide URVs for the modelled scenarios:
■ Capital costs were determined based on the desalination plant capacity and escalated to the start date of the analysis. For the same desalination plant capacity, the capital costs for all scenarios were the same.
■ The total energy consumption of the plant was calculated based on its design capacity, and then these costs were factored to calculate the annual energy costs based on the annual volume of water supplied, as derived from the WRPM analyses.
■ It was assumed that the membranes would be replaced every six years for a plant operating at full capacity. The membrane life was increased to up to 12 years, depending on the actual annual output from the plant as a percentage of its capacity.
■ Maintenance and labour costs were calculated as a function of the capital costs, and were adjusted depending on the annual output of the plant.
■ Chemical costs were calculated by multiplying a specific cost of chemicals by the actual desalination plant supply per annum.
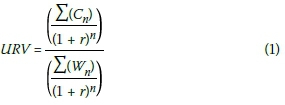
The capital, operating and maintenance costs were summed per annum (Cn), and the NPV determined over the analysis period (n) of 20 years for a discount rate (r) of 8 percent. Similarly, the NPV of the water supplied from the desalination plant (Wn) was determined, and hence, the URV (in R/m3) calculated for each scenario based on Equation 1.
As in the approach of Van Niekerk and Du Plessis (2013a), cognisance was taken of the stochastic variation in the supply and the resulting stochastic variation of the URVs. The cost components which are a function of the actual desalination plant output, and hence vary stochastically, include the energy consumption, chemical costs, maintenance costs and membrane lifespan.
Note that all URVs calculated as part of this research were for the desalination plant and its associated infrastructure only, and not for the WCWSS as a whole.
PRESENTATION AND DISCUSSION OF RESULTS
System yield
Base scenario
For Scenario A (the base scenario with no desalination plant) the historic firm yield of the system was calculated as 530 million m3/a. Based on the stochastic analyses, this corresponds to an assurance of supply of approximately 70 percent, or 1 in 215 years. The 1 in 50, 1 in 100 and 1 in 200 year yields of the system were calculated as 580 million m3/a, 553 million m3/a and 532 million m3/a respectively. The results for Scenarios B to D were compared to the base scenario results in order to determine the increase in yield resulting from the addition of a desalination plant to the system.
Historic firm yield
Figure 3 shows the increase in the historic firm yield compared to the base scenario for all the seawater desalination plant operating scenarios that were analysed.
For Scenario B, with the desalination plant operational 100 percent of the time, the increase in historic firm yield is very close to the desalination plant capacity (as expected) for all three capacities. For Scenario C, with the desalination plant operational only when the dams are not spilling, the results are almost identical, which suggests that reducing the desalination plant output when the dams are spilling has little impact on the system yield. Considering Scenario D, as the reservoir trigger level at which the seawater desalination plant kicks in is lowered, the increase in historic firm yield decreases substantially. This trend is more clearly viewed in a plot of the increase in historic firm yield of the system against the desalination plant trigger level, as presented in Figure 4.
The results show a clear logarithmic pattern. Logarithmic trend lines plotted for each desalination plant capacity showed a good correlation with the modelled data. The coefficients of the logarithmic equations for each curve appeared to be related to the desalination plant capacity, and were therefore normalised based on the plant capacity and averaged to provide the generic equation as shown in Equation 2. This equation could be used to estimate the increase in historic firm yield in million m3/a (∆HFY) of the WCWSS for any desalination plant capacity and reservoir trigger level. The average annual desalination plant capacity (Qa) is expressed in million m3/a, and the desalination plant trigger level (Tr as a percentage of the system storage in the main reservoirs.

The logarithmic shape suggests that increasing the dam trigger level from say 20 percent to 30 percent, will have a significantly greater impact on the historic firm yield than increasing the trigger level from say 80 percent to 90 percent. It also shows that there is no "turning point" or optimal trigger level. In other words, the maximum increase in historic firm yield is achieved when the desalination plant is always operational.
Stochastic results
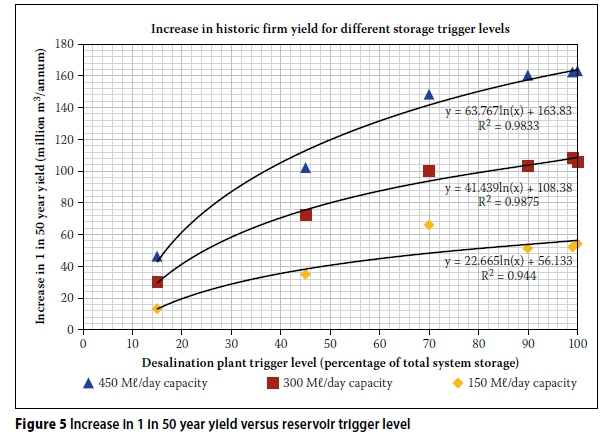
Figure 5 shows the increase in 1 in 50 year yield from the base scenario, based on the results from the stochastic analyses.
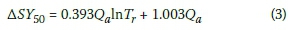
The trends across the trigger levels and capacities are very similar to the historic firm yield results, showing a clear logarithmic pattern, and logarithmic trend lines fitted to the data show a good correlation. As for the historic firm yield results, the logarithmic equation coefficients were normalised based on the desalination plant capacity, and averaged, giving the generic Equation 3 for calculating the 1 in 50 year yield in million m3/a (∆SY) for any desalination plant capacity and trigger level.
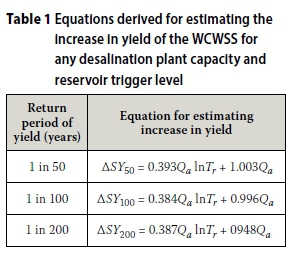
Comparable plots prepared for the 1 in 100 year and 1 in 200 year yields showed similar trends, suggesting that the introduction of the desalination plant merely shifts the yield-reliability curve up without changing its shape. A summary of the equations derived for estimating the increase in yield for the three return periods is presented in Table 1.
Seawater desalination plant supply
Median supply based on WRPM analyses
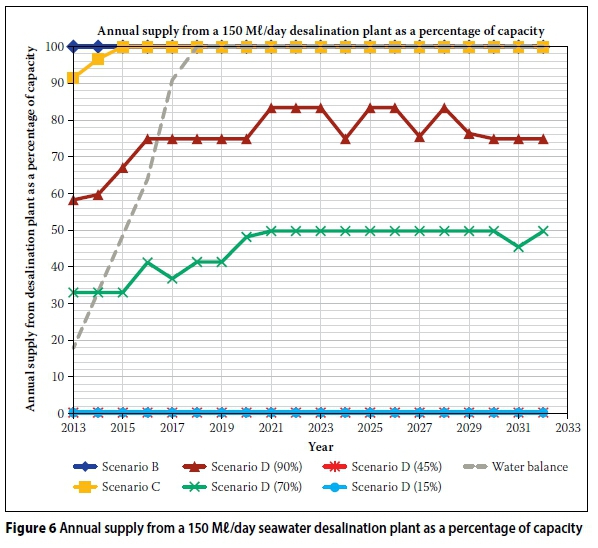
Figure 6 illustrates the supply from the sea-water desalination plant as a percentage of its capacity in each year (2013 to 2032), for all scenarios, based on a 150 Mℓ/day plant. The values shown were derived from the WRPM analyses and are based on the median annual supply of the 401 stochastic sequences that were analysed.
For Scenario B (as expected) the sea-water desalination plant would always be 100 percent operational. For Scenario C the seawater desalination plant would start out at 90 percent of its capacity, increasing to 100 percent by 2015. Lowering the trigger level (Scenario D), lowers the output from the seawater desalination plant as a percentage of its capacity. For the lowest trigger levels of 45 percent and 15 percent, the seawater desalination plant would not be operational for the entire analysis period. Similar plots prepared for 300 Mℓ/day and 450 Mℓ/day plants show that, as the seawater desalination plant capacity increases, the supply from the plant as a percentage of its capacity decreases.
Stochastic variability in supply
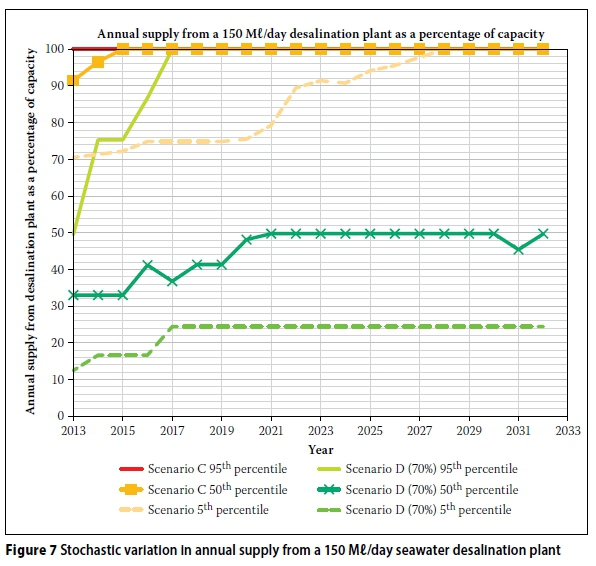
The results presented in Figure 6 are based on median values of the 401 stochastic sequences analysed, and were selected as representative values for calculating URVs. In order to illustrate the possible stochastic variability in supply from the desalination plant, the 5th and 95th percentile annual values were plotted for Scenario C and for Scenario D with a 70 percent trigger level, as shown in Figure 7.
For Scenario C the maximum stochastic range varies between -28% and +9% from the median, decreasing to zero by the end of the analysis period (2028), when even the wetter sequences required the desalination plant to be fully operational. For Scenario D, with a 70 percent trigger level, the stochastic range is much greater, varying between -25% and +50% from the median, and hence making the choice of what values to use as input into the URV calculations more critical.
Comparison with traditional approach
The research of Van Niekerk and Du Plessis (2013b:543) showed that the annual supply from a new water supply source (in their case an inter-basin transfer scheme) is generally estimated by calculating the deficit between the projected annual demands of the system and the existing system capacity, taking any limitations in the capacity of the new water supply source into consideration. Applying this principle, using the demand projections as presented in Figure 2 and the 1 in 50 year yield of 580 million m3/a, the annual system deficit was calculated. Assuming that a new desalination plant would have to meet this deficit, for the selected capacities of 150 M£/ day, 300 M£/day or 450 M£/day, the annual supply as a percentage of the desalination plant capacity was calculated, as shown in Figure 8.
Based on the traditional approach, a 150 M£/day seawater desalination plant would operate at 18 percent of its capacity in 2013, increasing to 100 percent by 2018. Comparing these values to the WRPM results in Figure 6, the traditional approach and the WRPM approach provide vastly different values in terms of supply from the desalination plant, particularly for the lower reservoir trigger levels. This will impact on the calculated URVs.
Planning for future interventions
Traditional approach
The typical approach that would be followed in determining when a future intervention is required in a water supply system would be a water balance of system demands and supply. The water demands that were projected as part of this study, based on the recent work by Aurecon (presented in Figure 2), were plotted along with the calculated 1 in 50 year base yield of 580 million m3/a (Scenario A) and the 1 in 50 year yields with a seawater desalination plant as derived from the WRYM analysis (Scenario B), as shown in Figure 9. Based on this approach, a 150 Mℓ/ day seawater desalination plant would meet the system demands until 2017, a 300 Mℓ/ day plant would meet the demands until 2021 and a 450 Mℓ/day plant would meet the requirements until 2024.
Base scenario using the WRPM
In the WCWSS analysis in the WRPM and part of the recent study on the development of integrated annual and real time operating rules for the WCWSS, revised water restriction levels were developed. The scenario which Aurecon found to be the most realistic is provided in Table 2, and was used in the WRPM analyses. As shown in Table 2, Level 1 curtailments cannot be applied more than once in every 20 years, Level 2 curtailments no more than once in every 100 years and Level 3 curtailments no more than once in every 200 years. Stricter curtailments are applied to agricultural demands than domestic demands.
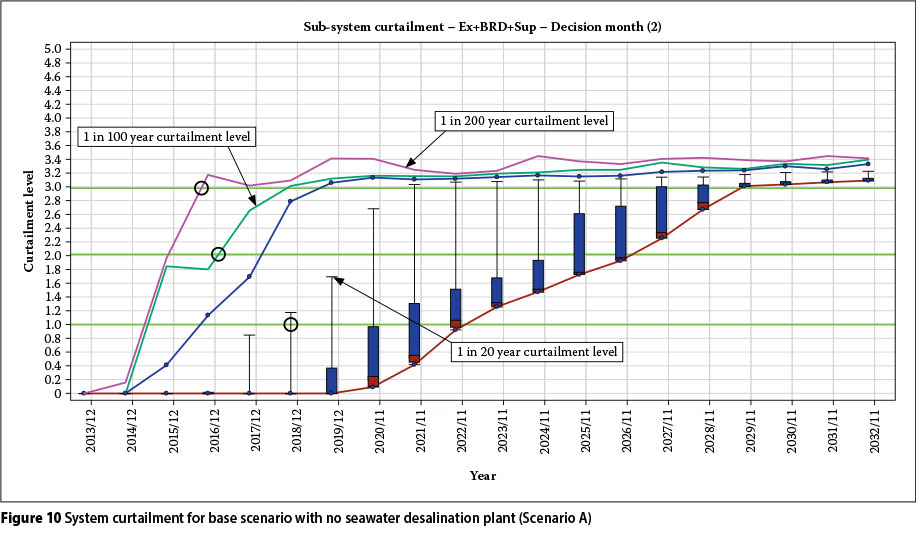
Figure 10 shows a box-and-whisker plot of the subsystem curtailment for the base scenario (Scenario A) from 2013 to 2032 as derived from the WRPM analysis. The critical lines or whiskers which correspond to 1 in 20 year, 1 in 100 year and 1 in 200 year curtailment levels are labelled.
Curtailment Level 1 would be reached (approximately) at a frequency of 1 in 20 years by 2018. Curtailment Level 2 would be reached at a frequency of 1 in 100 years by 2016, and curtailment Level 3 would be reached at an assurance of 1 in 200 years by 2016. These critical points are marked with circles. Considering these three trigger years, the earliest that a new water supply intervention would be required for the WCWSS in order to ensure that the frequency of curtailments stays within acceptable limits would be 2016.
Seawater desalination plant scenarios in the WRPM
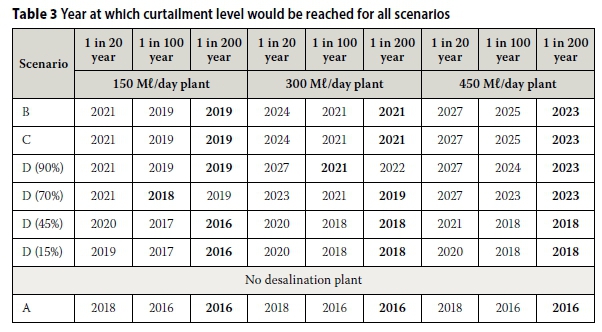
Plots similar to Figure 10, showing curtailment levels, were extracted from the WRPM for the various seawater desalination operating scenarios and capacities. A summary of the critical points at which the acceptable frequency of curtailments are exceeded are provided in Table 3. The earliest dates at which an intervention is required in each case are highlighted in bold.
Considering Scenario B, the addition of a 150 Mℓ/day plant to the system would delay the date at which a new intervention is required to 2019. A plant capacity of 300 Mℓ/ day would provide a further two years to 2021, and a capacity of 450 Mℓ/day, an additional two years to 2023. For Scenario C and Scenario D with a 90 percent trigger level, the results are identical to those of Scenario B, suggesting that the decision regarding whether to operate the seawater desalination plant 100 percent of the time or only when the dams are not spilling would not be influenced by curtailment requirements.
As the trigger levels decrease, the benefit of the seawater desalination plant in terms of delaying the requirement for a new scheme is reduced. For the lowest trigger levels the seawater desalination plant provides almost no benefit in terms of reducing curtailments, suggesting that there is very little benefit in using the desalination plant as an emergency supply source.
Unlimited desalination plant capacity
The results are derived from assumed sea-water desalination plant capacities of 150, 300 and 450 Mℓ/day. The reverse of this approach would be to ask: "What desalination plant capacity is required in order to meet future demands for the next 10 or 20 years?" Based on the traditional approach, a 400 Mℓ/day seawater desalination plant would meet the system requirements up to 2023, and a 1 000 Mℓ/day plant would meet the requirements up to 2033. The WRPM results confirm that, with a 450 Mℓ/day desalination plant, curtailments would be kept within acceptable limits until 2023. However, from the WRPM results it is not possible to confirm what capacity is required to meet the demands beyond this point.
The WRPM analyses were repeated for Scenarios C and D (with a 70 percent trigger level only) with a seawater desalination plant of unlimited capacity. The monthly supply from the seawater desalination plant over the analysis period was determined, based on the median values of the 401 stochastic sequences. The maximum monthly supply for Scenario C would be 2 100 Mℓ/day in 2023, increasing to 2 900 Mℓ/day in 2033.
For Scenario D the plant would have to supply up to 1 500 Mℓ/day in 2023, increasing to 2 100 Mℓ/day by 2033.
The problem with adopting this approach is that it does not allow for any failures over the analysis period, i.e. for Scenario D with a 70 percent trigger level, a 1 500 Mℓ/day plant would meet the demands until 2023 with a 100 percent assurance of supply. This differs from the normal risk allowance that would be applied in planning for a water supply system in South Africa.
Comparison of costs
Traditional approach to calculating URVs
The research of Van Niekerk and Du Plessis (2013a:551) showed that the traditional approach to calculating URVs uses the water supply from a scheme calculated based on a water balance between annual demands and a 1 in 50 year system yield. As a starting point, this traditional approach was applied for calculating the URV of the seawater desalination plant. For a discount rate of 8 percent, the traditional approach yielded URVs of R11.35/m3 for a 150 Mℓ/ day seawater desalination plant, R11.46/m3for a 300 Mℓ/day seawater desalination plant and R11.48/m3 for a 450 Mℓ/day seawater desalination plant.
WRPM-based approach to calculating URVs
In the WRPM-based approach, as applied for this research, capital and operating costs were calculated for each scenario using the annual supply from the seawater desalination plant as derived from the WRPM analyses. Using these costs and the associated sea-water desalination plant supply, URVs were calculated for each scenario and seawater desalination plant capacity as presented in Table 4. The values highlighted in bold are the median values (50th percentile) which were considered to be the most reasonable for the purposes of comparison between the scenarios and with other possible interventions. The 5th and 95th percentile URVs are also shown in order to provide an indication of the possible stochastic range of the costs.
Considering the median (50th percentile) values in Table 4, it would appear that, for all capacities, the URV increases as the trigger level decreases. It therefore seems that operating the seawater desalination plant as an emergency type scheme, as exemplified by the 45 percent and 15 percent trigger levels, would be expensive. Although the annual operating costs would be much lower for an emergency scheme, the initial capital cost would be the same regardless of the actual seawater desalination plant output. The results suggest that this initial capital cost outweighs any reduction in operating costs when the seawater desalination plant output is reduced.
For a trigger level of 70 percent, the URV for a 150 Mℓ/day plant is much more reasonable at R15.49/m3, decreasing to R12.21/m3for a 90 percent trigger level. For Scenario B and Scenario C the desalination plant would be fully operational once constructed, giving a URV of R10.96/m3. Based on these values it would appear that the lowest possible URV occurs when the desalination plant is 100 percent operational.
Comparing the three capacities that were analysed, the URVs decrease slightly with an increase in seawater desalination plant capacity. This suggests that it would be more beneficial from an economic perspective to construct a larger seawater desalination plant now, rather than phasing it in smaller lanes.
Comparing the results from the traditional approach to the WRPM-based approach, the results for a 150 Mℓ/day plant are actually similar to Scenario B/C. This suggests that, although the annual supply from the seawater desalination plant differs vastly between the traditional and WRPM approaches in the initial years, both approaches suggest that the seawater desalination plant would be 100 percent operational in the later years, meaning that the calculated URVs are similar. The traditional approach, however, suggests an increase in the URV with an increase in capacity, which differs from the WRPM approach. For the lower trigger level scenarios, the WRPM-based approach has much higher URVs than the traditional approach.
Considering the 5th and 95th percentile values, it appears that the possible stochastic range increases with a decrease in the trigger level and with an increase in capacity. Hence, for a fairly predictable scenario in terms of seawater desalination plant supply (when it will be operational most of the time), the stochastic variability in stream flows in the existing system would have little effect on the URVs and would not be too far off from URVs calculated using the traditional approach. However, for a less predictable operating scenario, using the seawater desalination plant as an emergency type scheme, the stochastic variability in the URV would be more noticeable, and hence the selection of an appropriate percentile for reporting on the costs would become more important.
CONCLUSIONS
Through the current WCWSS planning processes, seawater desalination has been earmarked as a potential future supply source for the area. In order to maximise the benefits and minimise the costs of a seawater desalination plant, it needs to be considered as an integral part of the current system. In order to undertake integrated system analysis, the WRYM and WRPM were selected as the most appropriate tools. Short-term and long-term analyses were completed for a variety of possible seawater desalination plant operating scenarios and capacities in order to determine the increase in system yield and the annual supply from the sea-water desalination plant. First-order capital and operating costs were estimated using the South African methodology of Du Plessis et al (2006). Combined with the annual supply values from the WRPM, these costs were used to calculate and compare the URVs of the desalinated water.
The following conclusions can be drawn from the results of the modelling and cost analyses:
■ It is possible to model a desalination plant as an integral part of a surface water supply system. With the appropriate costing tools, a similar analysis approach could be applied to other non-conventional resources, such as water reuse.
■ The increase in system yield as a result of the desalination plant appears to be logarithmically related to the reservoir trigger level. Generic equations were developed which could be used to estimate the increase in historic firm yield and 1 in 50 year yield of the WCWSS for any seawater desalination plant capacity and reservoir trigger level.
■ The maximum increase in yield occurs when the seawater desalination plant is used as a base supply, operational all the time. The increase in yield decreases with a decrease in the reservoir trigger level, meaning that there is little benefit in using the seawater desalination plant as an emergency supply source.
■ With a 150 Mℓ/day desalination plant, curtailment requirements would be kept within acceptable levels until 2019, with a 300 Mℓ/day plant until 2021 and a with a 450 Mℓ/day plant until 2023, for a desalination plant which is 100 percent operational. Using the plant as an emergency supply source would add little benefit in terms of limiting curtailment requirements.
■ URVs for the seawater desalination plant decrease as the percentage of time for which the seawater desalination plant is operational increases. This means that the lowest possible cost per cubic metre of water supplied is when the seawater desalination plant is operational 100 percent of the time (R10.96/m3 for a 150 Mℓ/ day plant).
■ It would also appear that the URVs decrease with an increase in seawater desalination plant capacity, meaning that constructing a larger seawater desalination plant upfront may be more cost-effective. However, it would have to be constructed in small enough lanes to enable restriction of the output when the total supply is not required, and cognisance would have to be taken of other relevant factors, such as availability of other schemes already in place and growth in water demands.
■ The lower the reservoir trigger level, the larger the stochastic variation in the supply from the seawater desalination plant, and hence the larger the variation in the URVs. Hence, for a seawater desalination plant operational as a base supply source, undertaking stochastic modelling to calculate URVs is less important than for an emergency supply source.
LIMITATIONS AND FURTHER RESEARCH
In concluding, the following limitations and areas for further research should be noted:
■ Of the available non-conventional supply sources, only seawater desalination was considered, and the model was applied to the specific case of the WCWSS, hence the results are mostly case-specific. As part of further research, it would be worthwhile to repeat the methodology and analysis procedure for other large water supply schemes in South Africa, and for other sources such as water reuse.
■ The main limitation of this research is that only the cost of the desalination scheme was considered in the analysis. As part of future research, it may be worthwhile to consider developing a costing model for the WCWSS as a whole and attempting to optimise the overall system cost with the implementation of a desalination plant. Under such an approach, reducing the desalination plant output may prove to be more cost-effective. Desalination technology has advanced rapidly in the last few years, and as a result capital and operating costs today are likely to be lower than those estimated using the methodology of Du Plessis et al (2006) used in this research. Updating of the costing methodology could form part of further research; however, it is expected that adjustments to the costing would not affect the applicability of the analysis methodology and relevance of the conclusions.
REFERENCES
Basson, M S, Allen, R B, Pegram, G G S & Van Rooyen, G A 1994. Probabilistic Management of Water Resource and Hydropower Systems. Littleton, CO: Water Resources Publications. [ Links ]
Department of Water Affairs 2007. Western Cape Water Supply System Reconciliation Strategy. Cape Town: Department of Water Affairs, South Africa. [ Links ]
Department of Water Affairs 2010. Integrated Water Resource Planning for South Africa: A Situation Analysis 2010. Pretoria: Department of Water Affairs, South Africa. [ Links ]
Department of Water Affairs 2011. Western Cape Water Supply System Reconciliation Strategy, Progress Report of the Strategy Steering Committee. Cape Town: Department of Water Affairs, South Africa. [ Links ]
Department of Water Affairs 2013a. Support to the Continuation of the Water Reconciliation Strategy for the Western Cape Water Supply System: Status Report October 2013. Cape Town: Department of Water Affairs, South Africa. [ Links ]
Department of Water Affairs 2013b. National Water Resource Strategy: Water for an Equitable and Sustainable Future. Pretoria: Department of Water Affairs, South Africa. [ Links ]
Department of Water Affairs and Forestry 2008. Water for Growth and Development in South Africa. Pretoria: Department of Water Affairs and Forestry, South Africa. [ Links ]
Du Plessis, J A, Burger, A J, Swartz, C D & Musee, N 2006. A Desalination Guide for South African Municipal Engineers. Pretoria: Department of Water Affairs, South Africa. [ Links ]
Ghaffour, N, Missimer, T M & Amy, G I 2013. Technical review of the economics of water desalination: Current and future challenges for better water supply sustainability. Desalination, 309: 197-207. [ Links ]
Hoffman, J J & Du Plessis, J A 2008. Water demand management: An economic viable option. WISA, 147-163. [ Links ]
Karagiannis, I C & Soldatos, P G 2008. Water desalination cost literature: Review and assessment. Desalination, 223: 448-456. [ Links ]
Mallory, S J L, Ballim, F, Pashkin, J & Ntuli, C 2013. Introducing desalination plants into system operating rules for bulk water supply systems. Unpublished paper delivered at the 16th South African National Hydrology Symposium, 1 October, Pretoria. [ Links ]
Onishi, N 2010. Arid Australia sips seawater, but at a cost. Available at: http://www.nytimes.com/2010/07/11/world/asia/11water.html?_r=0 [accessed on 23 March 2012]. [ Links ]
Shand, M & Sparks, A 2004. Optimisation of system operating rules for the Western Cape Water Supply System. s.l.:s.n. [ Links ]
South African Reserve Bank 2014. Selected historical rates. Available at: https://www.resbank.co.za/REsearch/Rates/Pages/SelectedHistoricalExchangeAndInterestRates.aspx [accessed on 11 September 2014]. [ Links ]
Van Niekerk, P H & Du Plessis, J A 2013a. Hydrologic-economic appraisal of lifecycle costs of inter-basin water transfer projects. Water SA, 39(4): 539-548. [ Links ]
Van Niekerk, P H & Du Plessis, J A 2013b. Unit Reference Value: Application in appraising inter-basin water transfer projects. Water SA, 39(4): 549-554. [ Links ]
Wittholz, M K, O'Neill, B K, Colby, C B & Lewis, D 2008. Estimating the cost of desalination plants using a cost database. Desalination, 229(2008): 10-20. [ Links ]
 Correspondence:
Department of Civil Engineering
Stellenbosch University
Private Bag X1
Matieland 7602
South Africa
T: +27 21 526 9400
E: catherine.blersch@aurecongroup.com
Department of Civil Engineering
Stellenbosch University
Private Bag X1
Matieland 7602
South Africa
T: +27 21 808 4358
E: jadup@sun.ac.za

ATHERINE BLERSCH (Pr Eng, MSAICE) is an Associate in Aurecon's Cape Town office, where she has been involved in water engineering for the past six and a half years, with a focus on wastewater treatment works, and water resource management and planning. She obtained a BEng (Civil) from the University of Pretoria, and an MEng from Stellenbosch University. Currently she is busy with an MBA at the University of Cape Town's Graduate School of Business.

PROF KOBUS DU PLESSIS (Pr Eng, MSAICE, FIMESA) is Head of the Department of Civil Engineering at Stellenbosch University, and has been responsible for Hydrology and Environmental Engineering at the university for the past 13 years. He has a special interest in the integrated management of water resources in South Africa as applied by local authorities, as well as in flood hydrology. He obtained his PhD (Water Governance), MEng (Water Resource Management) and BEng (Civil) from the University of Stellenbosch. During his more than 29 years of experience in the water sector, he also worked for the Department of Water Affairs, the City of Cape Town and the West Coast District Municipality. He presently serves on the Executive Committee of IMESA (Institute of Municipal Engineering of Southern Africa) and on the Education and Training Panel of SAICE (South African Institution of Civil Engineering).
1 The following exchange rates were issued in the costing analyses and comparison of known costs (South African Reserve Bank 2014):
■ 1 Australian Dollar (AUS$) is equivalent to R9.80
■ 1 United States Dollar (US$) is equivalent to R10.70
■ 1 Euro (€) is equivalent to R14.70
2 DWS (Department of Water and Sanitation) was previously the Department of Water Affairs and Forestry (prior to 2009) and subsequently the Department of Water Affairs (from 2009 to 2014). In this paper, the department is referred to by its current designation (DWS), apart from in the references, where the name at the time of publication of the referenced document is used.

