


Services on Demand
Article
 English (pdf)
 Article in xml format
 Article references
Indicators

Related links
-
 Cited by Google
 -
 Similars in Google
Share

 Permalink
Journal of the South African Institution of Civil Engineering
On-line version ISSN 2309-8775
Print version ISSN 1021-2019
J. S. Afr. Inst. Civ. Eng. vol.58 n.4 Midrand Dec. 2016
http://dx.doi.org/10.17159/2309-8775/2016/v58n4a7
TECHNICAL PAPER
Seismic evaluation of the northbound N1/R300 bridge interchange
M N Solms; T N Haas
ABSTRACT
The design of the Stellenberg Interchange was finalised in 1982, with construction completed in 1986. The bridge was designed using a code of practice which did not include any requirements for seismic excitation. This code was superseded by the Code of Practice for the Design of Highway Bridges and Culverts, which provides detailed analysis guidelines for bridges located in seismic-prone areas. According to this code, the bridge is located in a seismic-prone area with an anticipated peak ground acceleration of 0.1 g. Current research suggests that this region could be exposed to a peak ground acceleration of approximately 0.2 g. Upon inspection of the bridge, it was noted that the bridge does not conform to modern-day best practice guidelines for bridges located in seismic-prone regions. These factors necessitated an exploratory investigation to determine whether the bridge can sustain earthquake magnitudes between 0.05 g and 0.2 g. The study was conducted by experimentally determining the natural frequencies with its corresponding mode shapes, which were used to calibrate a finite element model. The finite element model was subjected to different magnitude earthquakes to determine its structural integrity. The results show that, for an earthquake of 0.1 g, the bending moment at one of the column bases is exceeded, while two other column base moments are within 15% of its design capacity. For a 0.2 g magnitude earthquake, the design bending moments at five columns are significantly exceeded, while three other columns' design moments are close to being exceeded. The exceedance of the design moments could lead to significant damage, with the possibility of collapse of the bridge.
Keywords: seismic, earthquake, bridge, FE, PGA selection
INTRODUCTION
Background
The R300 regional road provides a link between two national highways, namely the N1 and the N2. The N1-R300, commonly referred to as the Stellenberg Interchange, incorporates two interchange bridges which cross the N1. The Stellenberg Interchange is located in the southwestern region of the Western Cape Province, approximately 27 km from Cape Town's CBD. The N1 in this area is heavily congested during morning peak-hour traffic flowing into Cape Town's CBD, while the same applies for the return leg in the afternoon. According to TomTom, Cape Town is the most traffic-congested city in South Africa. Therefore, any damage to or collapse of one of the Stellenberg Interchange bridges would cause serious disruption to traffic flow to and from Cape Town's CBD, with associated economic impacts of traffic having to use other available routes.
The structural design of the Stellenberg Interchange was completed in 1982, while construction was completed early in 1986. The bridge was designed based on the Planning Manual Part 3: Bridge Design Manual of 1977 of the Cape Provincial Administration Department (CPAD) of Roads. Seismic excitation was, however, not considered in the design, as this design code did not stipulate provisions for the effects of seismicity on bridges. Although the bridges were not designed for seismicity, it adhered to the provisions of the code at the time.
The CPAD code was superseded in 1981 by the Technical Methods for Highways No 7, also known as TMH7 for the design of bridges and culverts in South Africa. TMH7 is based on Complements au Code-Modèle CEB-FIP of 1978. TMH7 differs significantly from CPAD in that it has clear guidelines for seismicity and the regions to which it should be applied. TMH7 clearly indicates that the interchange is located in a seismic-hazard region which is susceptible to a peak ground acceleration (PGA) of 0.1 g with a 10% probability of exceedance in a 100-year period, equating in a return period of 950 years. Although the seismic intensity is classified as moderate, infrastructure not designed for this level of seismicity could experience serious damage or collapse when subjected to this load effect.
The southwestern region of the Western Cape Province where the interchange is located is susceptible to natural seismicity (TMH7 1981; SANS 2011). The magnitude of the seismicity in this region is however uncertain, with the current bridge loading code indicating a PGA of 0.1 g and a return period of 950 years (TMH7 1981). Current research estimates the region could be exposed to a PGA of up to 0.2 g with a return period of 475 years (Kijko et al 2003).
After close inspection it was noted that the interchange does not conform to modern-day recommended best practice for bridges located in seismic-prone areas. These factors include:
■ Monolithically cast columns-to-deck connections
■ In-plan curvature of the deck
■ Single columns to wide deck connections
■ Off-perpendicular abutment connections in terms of the longitudinal axis of the bridge.
In terms of general loading for which the bridge was designed, these design features and structural layouts are suitable and efficient solutions in non-seismic-prone regions. The bridge could, however, be susceptible to excessive displacements and secondary stress effects during an earthquake, which was not considered at design stage. Therefore, the uncertainty with regard to the seismic magnitude and the infringement of modern-day recommended best practice for bridges in seismic-prone areas necessitated an exploratory investigation to determine whether the bridge can sustain a moderate intensity earthquake.
Bridge information
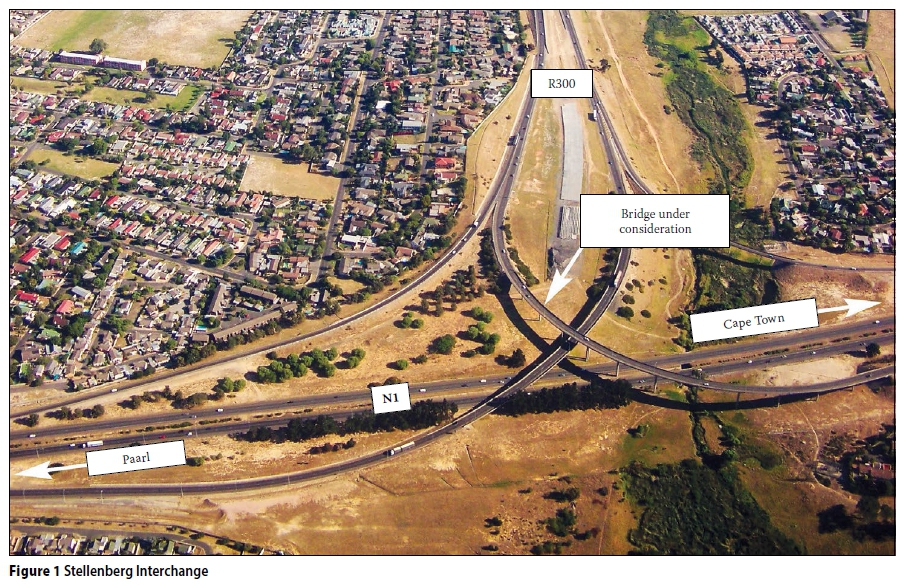
An aerial photograph of the bridge leading from the northbound N1 highway onto the R300 is shown in Figure 1
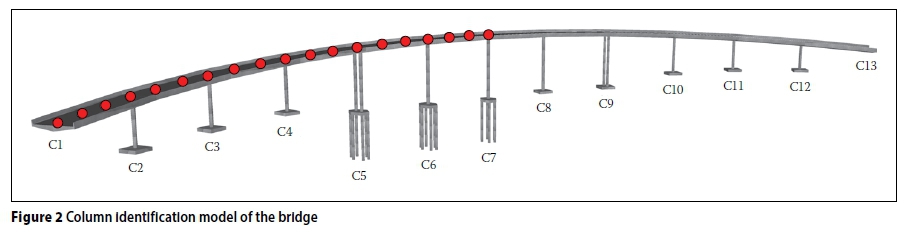
The bridge is composed of a post-tensioned continuous concrete box girder deck with a total length of 418 m, which is curved in-plan with an approximate radius of 245 m. The box girder has a width of 11.2 m with a total depth of 1.85 m from soffit to road surface. The deck is supported by nine single columns and two pairs of double columns at positions C5 and C9, as shown in Figure 2 The spacing between the columns ranges between 27.5 m and 38 m. Columns C5, C6 and C7 are supported on pile group foundations while the remaining columns are supported on pad footings. Columns C4 to C10 are monolithically cast into the bridge deck, while columns C2 and C12 support the deck via unidirectional plate bearings, allowing movement in the longitudinal direction of the bridge. Columns C3 and C11 support the deck via fixed plate bearings that allow only rotational freedom. Two side-by-side unidirectional plate bearings support the bridge deck at abutments C1 and C13, allowing additional movement in the longitudinal direction. The column lengths ranges from 11.5 m to 26.5 m.
Seismic risk of the region
The southwestern region of the Western Cape, hereafter referred to as the Cape Town region, is susceptible to the highest levels of natural seismicity in South Africa (Visser & Kijko 2010). Several moderate intensity earthquakes occurred in this region. Visser and Kijko (2010) estimate an earthquake with a maximum magnitude between 6.0 and 6.87 with a return period of 475 years could be expected in the Cape Town region. Figure 3 graphically illustrates how the earthquake magnitude increases with a corresponding return period which was developed for a region within a 200 km radius from Cape Town. A worst-case scenario of a 6.87 magnitude earthquake would cause a level IX shaking intensity on the Mercalli Magnitude Intensity (MMI) scale. As the PGA value of an earthquake is site-specific, converting the magnitude of an earthquake to a PGA value is not very suitable without the known location of the epicentre, the recording location and the soil conditions. After evaluating the work of Kijko et al (2003), and Visser and Kijko (2010), a PGA of 0.2 g was established as appropriate for the worst-case earthquake with a 475 year return period in the Cape Town area.

Table 1 presents the estimated level of damage that could be experienced by building infrastructure in the Cape Town region as a result of a 6.87 magnitude earthquake (Visser & Kijko 2010). The three building categories represent approximately 70% of all urban structures in South Africa. The research shows that in the case of a seismic event of this magnitude, widespread damage could be experienced by infrastructure in this region.

METHODOLOGY
This section describes the importance of developing an initial finite element (FE) model, how the experimental tests were conducted to obtain the natural frequencies with its corresponding mode shapes, the detailed FE model, as well as the selection of earthquake acceleration time histories.
Development of initial finite element model
An initial FE model was developed using information from the 'as built' drawings to obtain the dynamic modal characteristics of the bridge. The modal behaviour of the initial FE model was reviewed to determine effective placement of accelerometers to capture the structure's dynamic response. Without this information, measurement devices could be placed at points along the bridge deck which would deliver no functional data.
Ambient vibrational testing
The total closure of the bridge was not permitted by the regulatory authority, the South African National Roads Agency SOC Limited (SANRAL), since it would cause severe disruptions to traffic on the N1, even during non-peak hour traffic. It was therefore important to find an experimental approach to determine the dynamic response of the bridge when one of the dual carriage lanes remain open. The physical ambient vibra-tional testing of the Stellenberg Interchange took into account the current state of the bridge, including all possible cracks and defects that had accumulated over time.
The bridge vibrations were recorded using accelerometers placed at a third spacing on each span. The accelerometer placement is presented by red indicators in Figure 2
Seven tests were conducted over six of the twelve spans of the bridge. All tests conducted were performed at 20 minute time series recordings at a sampling rate of 1 024 Hz. The time series data was resampled with a 66.67% overlap and passed through a low-pass filter to narrow the data to a band between 0 Hz and 13 Hz. Enhanced frequency domain decomposition (EFFD) was used in the frequency domain, while stochastic subspace identification (SSI) was used in the time domain to produce the required modal parameters. Details regarding these methods can be obtained from publications by Bricker & Anderson (2006), National Instruments (2009) and Solms (2015). Figure 4 shows the spectral decomposition of the results obtained from the three recorded directions. The matching peaks of the data show the natural frequencies and are highlighted with vertical indication lines.
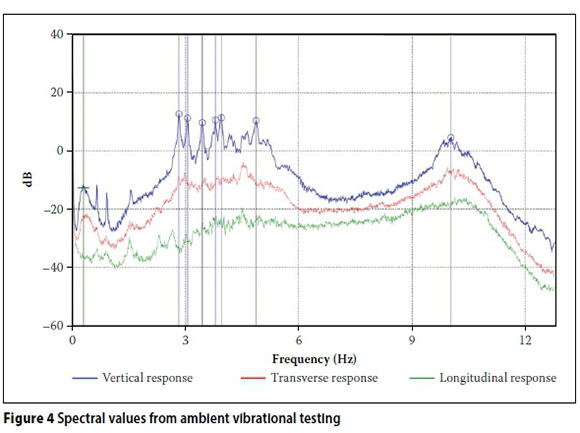
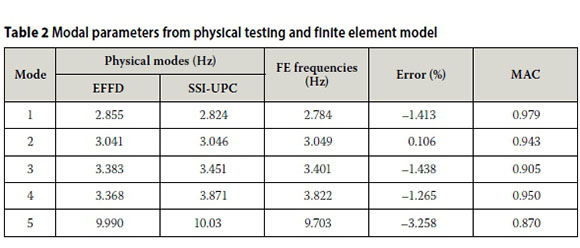
Table 2 shows the difference between the EFFD and SSI-UPC frequencies for the corresponding mode shapes. Although different methods are used to obtain the natural frequencies, the difference between the results of these methods is insignificant, indicating the accuracy of the experimental tests and the post-processing of the data. Figure 5 shows the experimental mode shapes with the natural frequencies using the SSI-UPC approach.

Detailed finite element model development
The initial FE model's complexity was increased to provide an accurate representation of the actual structure, while maintaining computational efficiency. The initial FE model was modified using the experimental data to develop the final calibrated FE model. This was obtained by implementing appropriate refinements and adjusting appropriate parameters of the model. For a detailed description of the appropriate refinements on the parameters, the reader is referred to Solms (2015).
The experimental data enabled the calibration of the FE model, ensuring it produced accurate results. The final FE model was developed using SIMULA's Abaqus version 6.13 FE analysis software. Since this was an exploratory investigation, the emphasis was to obtain a computationally efficient FE model which could accurately predict the structural response of the bridge. Therefore quadratic interpolated shear-flexible B32 beam elements (Timoshenko) incorporating full integration was used to model the structural elements of the bridge. These elements, with six degrees of freedom (DOF) per node, provided accurate force and displacement information while remaining computationally efficient. Although accurate stresses in the reinforcing steel and concrete could not be obtained from the beam elements, the use of three-dimensional solid elements to model the members in the global structure would be computationally expensive. The cross-sectional properties (area, moment of inertia and torsional moment of inertia) were calculated from the 'as-built' drawings and applied to the specific beam elements.
To obtain more accurate material behaviour, composite material properties were calculated for the beam elements. Since the mass and stiffness are key parameters when considering the modal behaviour of the structure, it is essential that the equivalent properties are accurately determined. The composite material properties were calculated by incorporating the area of steel and concrete in each section. The area of steel per metre for each cross-section was determined, whereafter the equivalent areas, densities and elasticity moduli were determined. The base material properties were obtained from the recommended values in SANS 10100-1 (SANS 2000).
Assumptions were made to effectively model the boundary conditions and element interactions of the bridge. All columns supported by pile groups and pad footings were modelled as fully fixed connections, thus fully restraining movement in all six degrees of freedom. The abutments (C1 and C13) on both ends connect to the deck via two side-by-side unidirectional bearings. The optimal solution to model these connections was to fully restrain the connection and release the rotational degree of freedom about the longitudinal axis of the bridge. The column to deck connections for the C2, C3, C11 and C12 columns were modelled using pin connections, thereby transferring all the trans-lational degrees of freedom from one node to the other while releasing all rotational degrees of freedom.
Various model refinements and adjustments were applied to the model to calibrate the FE model to the experimental data. The parameters on which a sensitivity analysis were performed together with its influence is presented in Table 3

The model calibration was performed by comparing the experimental and FE mode shapes with the corresponding frequencies. The five most prominent modes from the experimental data were used for comparison. For comparable model calibration, Magalhäes et al (2008) suggest that the difference between the experimental and FE model frequencies be limited to 5%. Table 2 shows a comparison between the experimental and FE mode shapes with the corresponding natural frequencies. The largest error observed occurred at mode shape 5, which resulted in an error of 3.3%, indicating the accuracy of the FE model to predict a globally efficient and accurate model. Figure 5 shows the comparison between the experimental and FE model's natural frequency and mode shapes for the first five modes.
It was also possible to extract the damping ratio from the experimental data, which was incorporated into the FE model. The complex interaction between all the elements that contribute to the damping of a large structure makes it impossible to calculate a theoretical damping ratio.
Earthquake simulations
The standard procedure when performing a time-history-based seismic analysis is to utilise the recorded ground motions of seven PGAs to determine the response of the structure. The selection of appropriate ground motions are based on the expected PGA, magnitude, distance and location of the epicentre, source mechanism and site soil conditions in the region. The time-histories are converted to spectral accelerations which are checked against the design response spectra. If unavailable, these spectra should be developed for a range of soil conditions to evaluate the effect of potential amplification of motion due to the soil. Due to the unknown soil parameters and the large discrepancies in the recommended appropriate PGA for this region, the number of simulations required to incorporate all of the unknown variables would be very large. To reduce the number of simulations, some deviations from the typical approach were made. This was achieved by applying two PGAs with similar intensities, but resulting in very different ground displacement profiles. The PGAs were selected to obtain a maximum and minimum ground displacement for each of the acceleration versus time-histories considered, i.e. 0.05 g, 0.1 g, 0.15 g and 0.2 g. This approach thus allows for a lower and upper force band for each magnitude PGA considered. Figures 6(a) and 6(b) show the acceleration versus time-history and the displacement versus time-history for the 0.05 g case resulting in a minimum displacement profile, while Figures 6(c) and 6(d) cover the same for the maximum displacement profile. This study employed the recorded data from the Chi-Chi earthquake, which occurred in central Taiwan in 1999. The available comprehensive PGA and intensity ranges of the Chi-Chi earthquake governed the basis of this selection.


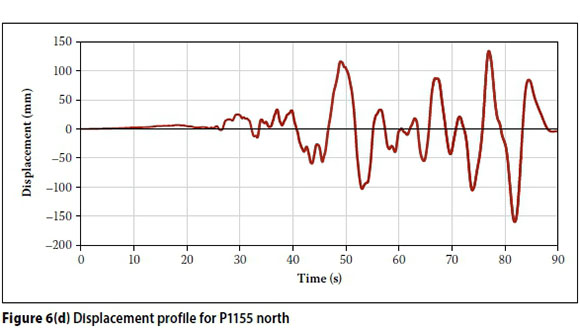
From Figures 6(b) and 6(d) we observe that the displacement profiles obtained from similar magnitude acceleration profiles yield significantly different maximum peak ground displacements. This would in turn lead to significant differences in the structural response of the structure. It was for this reason that the lower and upper-bound approach was used in this study. For ease of reference, the earthquakes which cause the smaller displacement profile will be referred to as the 'minimum intensity earthquake', while the earthquakes causing the larger displacement profile will be referred to as the 'maximum intensity profile' for each PGA.
Three PGA datasets from the Chi-Chi earthquake represented the three cases considered for this study. The north-south and east-west acceleration time-histories were simultaneously applied to the column bases in both directions orthogonally to the vertical plane. These three acceleration cases are the following:
■ A low-magnitude earthquake with a PGA of approximately 0.05 g which would have a higher probability of occurrence - the PGAs resulting in maximum and minimum ground displacement profiles applied to the structure were obtained from stations P1155 and P1524.
■ An earthquake representing the recommendation prescribed by the TMH7 equating to a PGA of 0.1 g with a 10% probability of exceedance in a 100-year period - the PGAs resulting in maximum and minimum ground displacement profiles applied to the structure were obtained from stations P1468 and P1159.
■ An earthquake with a PGA of approximately 0.2 g which could occur in the region with a 10% probability of exceed-ance in a 50-year period - this selection is based on the findings by Kijko et al (2003) and the SABS 0160 (SABS 1989). The PGAs resulting in maximum and minimum ground displacement profiles applied to the structure were obtained from stations P1453 and P1288.
The PGAs applied to the structure could be oriented in endless arrangements and configurations. To limit the number of simulations, a selection of certain orientations and configurations were investigated. Various sensitivity analyses were performed to establish appropriate orientations. The aim was to obtain a worst-case orientation and execute all simulations for this condition. The worst-case orientation was obtained with the north and east PGAs directed normally and tangentially to the curvature at mid-span of the bridge.
RESULTS AND DISCUSSIONS
On completion of the simulations, the structural elements of the bridge that had indicated high forces were identified for closer inspection. An estimation of the capacity of each of these elements was determined and compared to the response from the FE model. Using these comparisons, an evaluation on the possibility of damage to each element could thus be concluded.
Once all the potential hazardous sections had been evaluated, a conclusion on the structural robustness when exposed to seismic excitation was made. The potential of damage or possible failure was evaluated for each magnitude earthquake applied to the FE model.
Various failure modes of the bridge were inspected to evaluate the possibility of damage to the structural elements of the bridge. All column bases were evaluated in terms of their shear and moment capacities when subjected to the applied earthquakes. The bearing connections were also evaluated in terms of their horizontal force capacity to determine the possibility of unseating of the deck. These aspects were assessed for varying magnitude earthquakes with PGAs between 0.05 g and 0.2 g. Since beam elements cannot effectively simulate failure of the reinforced concrete sections, estimations on the section capacities were made.
As the design calculations were not available, the estimated design section capacities were calculated from the reinforcement drawings. The estimated column capacities were calculated using SANS 10100-1 (SANS 2000), while the bearing capacities of the plate-bearing connections were obtained from the supplier.
To produce sensible histogram plots and comparable data for all the columns, the time-histories of the base shears and moments were reduced to a single value. Due to the occurrence of isolated individual peaks, the maximum value could be considered as an overestimation of the forces experienced by the structural elements, while the average would be an underestimation of the forces due to the oscillating nature of the seismic loading. The solution therefore was to determine an effective peak average force for each earthquake simulation, which was achieved using a peak-picking algorithm. Figure 7 presents the base shear time-history response of column C7 during the 0.1 g simulation, with the peak profile response, the average of the peak profile response, and the maximum and average of the base shear force response. The peak average values were used for comparative purposes with the codified capacities.
Results and observations for the 0.05 g earthquakes
The 0.05 g earthquake responses produced results which are no cause for concern, as the responses are significantly below the estimated design capacities of the various sections. For this reason these results and discussions are therefore omitted.
Results and observations for the 0.1 g earthquakes
A magnitude of 0.1 g was selected as it conforms to the requirements provided in TMH7 for the region in which the interchange is located. The results and observations made are with respect to the shear forces and bending moments in the columns.
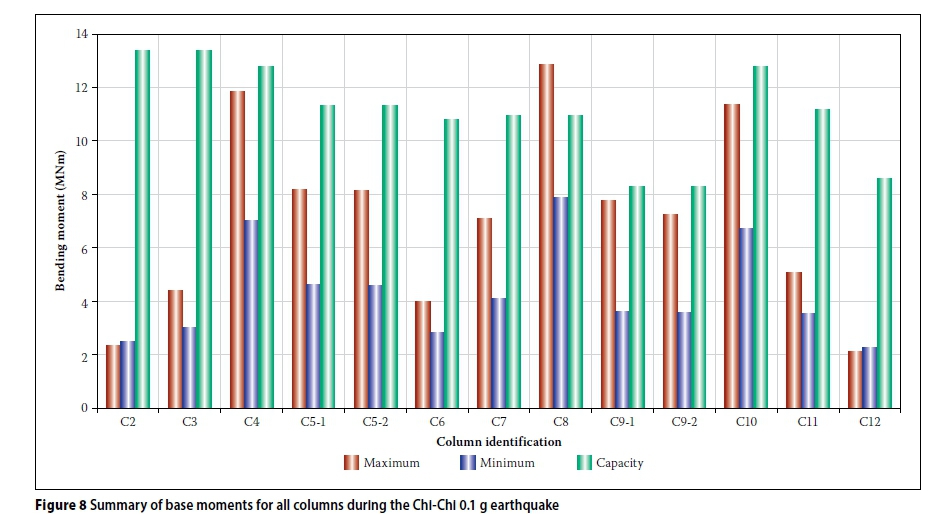
Figure 8 presents the column base moments for the maximum, minimum and design capacities when subjected to an earthquake with an intensity of 0.1 g.
From Figure 8 it is observed that the base moment capacity of only one column base moment capacity, i.e. C8, is exceeded by 18%, and thus could experience significant damage. The base moments of columns C4, C9 and C10 are, however, within approximately 90% of its design capacity. Therefore, if column C8 attains its maximum design capacity, it would transfer the remaining force to the other columns and could result in columns C4, C9 and C10 also attaining its design capacity. If this situation arises it could result in significant damage to these columns.
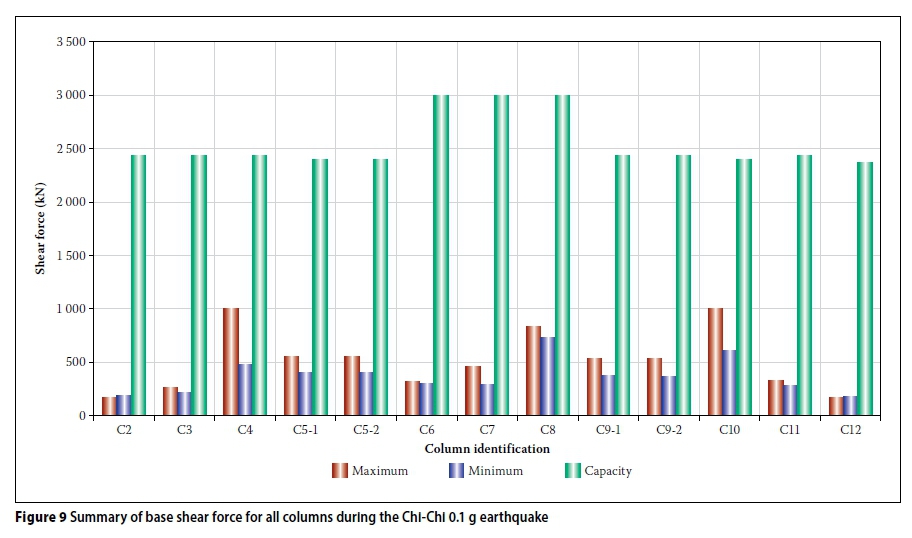
Figure 9 presents the column base shear forces for the maximum, minimum and design capacities when subjected to an earthquake with an intensity of 0.1 g.
From Figure 9 it is observed that the estimated shear capacities of the columns were not exceeded during the 0.1 g earthquake simulations. The maximum peak base shear force only attains 42% of the worst-case column's (C10) estimated shear capacity. The shear resistance capacity of the columns could, however, be reduced if the bending moment capacity is exceeded, thereby increasing the risk of damage to the column base. This would, however, have a very low probability of occurring for the 0.1 g case due to the high estimated shear capacities.
Results and observations for the 0.2 g earthquakes
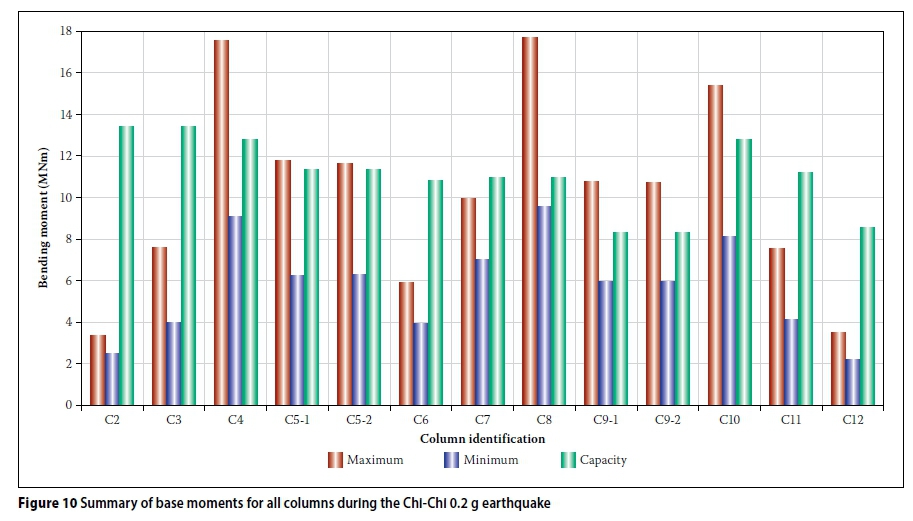
Current research suggests that an earthquake with a PGA of up to 0.2 g, with a return period of 475 years, could be expected in the region where the Stellenberg Interchange is located. This PGA of 0.2 g also correlates with the design PGA of the previous building infrastructure design code, SABS 0160 (SABS 1989). The results and observations made are with respect to the shear forces and bending moments in the columns. Figure 10 presents the column base moments for the maximum, minimum and design capacities when subjected to an earthquake with an intensity of 0.2 g.
The results shown indicate that the moment capacity of five columns (C4, C8, C9.1, C9.2 and C10) is significantly exceeded, while the moment capacity of two columns (C5.1 and C5.2) is marginally exceeded. The bending moment capacity of the worst-case column (C8) was exceeded by 62% of the estimated column capacity during a third of the 90 seconds maximum intensity simulation, indicating a significant likelihood of severe damage, which could result in failure of the column.
The two pairs of double columns at C5 and C9 provide a large portion of the transverse stiffness of the structure. Therefore, damage to either of the double column pairings could potentially lead to the collapse of the bridge if severe damage occurs in the early stages of such a seismic event. This risk could be increased if the damage to the column bases significantly reduces the shear capacity.
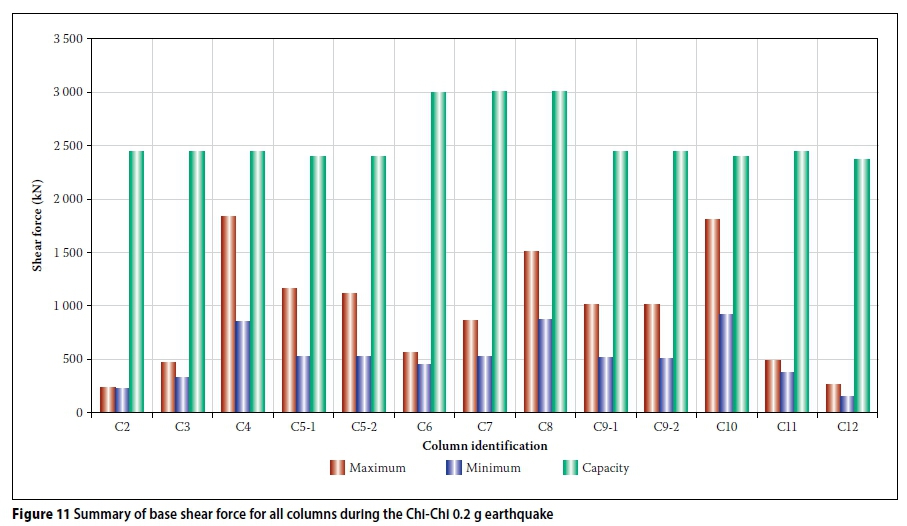
The shear response of the column bases, however, did not indicate a high risk of damage, even when subjected to the maximum intensity of the 0.2 g earthquake, as shown in Figure 11
The study also investigated the horizontal force capacity of the bearing assemblies used throughout the structure. None of the bearings indicated cause for concern, as the maximum intensity of the 0.2 g earthquake only attained 75% of the bearings' horizontal force capacity.
CONCLUSIONS
The following observations can be made for the various peak ground accelerations applied to the calibrated FE model:
0.05 g
For an earthquake with a lower return period than the current suggested design loading with a PGA of 0.05 g, the bridge should not experience any significant damage or failure since the worst-case column (C10) only experiences a bending moment equating to 5.2% of the calculated capacity of the column.
0.1 g
For the PGA of 0.1 g suggested by current seismic SANS 10160-4 (SANS 2011) and bridge design codes (TMH7 1981), the bridge would be exposed to a low to moderate probability of damage. This damage should be localised to singular worst-case sections of the bridge, barring complete failure of the column does not transfer excessive additional load to remaining columns.
0.2 g
In terms of current research on seismicity in the area, suggesting an applicable PGA of 0.2 g, the bridge would be exposed to a high probability of damage and even a risk collapse.
It should be noted that this study was an exploratory investigation into the seismic response of the Stellenberg Interchange. Further investigation is required to assess the specific level of damage the bridge would undergo during certain seismic events. To define this level of damage, a three-dimensional solid element FE model utilising nonlinear materials properties would be required. Such a model would be able to predict the progressive failure of the bridge in terms of the structure's performance when some of the sections are damaged, as well as highlight the load combinations and progressive loss in section capacity during a seismic event. It is also important to highlight the relative recent implementation of seismic design criteria in South Africa, and the average age of infrastructure in the Cape Town region. This suggests that wide-spread damage to buildings and other infrastructure in the Cape Town region would be probable if an equivalent 0.2 g seismic event occurs in the region.
ACKNOWLEDGEMENTS
The financial assistance of the National Research Foundation (NRF) towards this research is hereby acknowledged. Opinions expressed and conclusions arrived at, are those of the authors and are not necessarily to be attributed to the NRF.
This paper is furthermore presented with the approval of the South African National Roads Agency SOC Limited. The content of the paper reflects the views of the authors, who are responsible for the facts and accuracy of the data presented herein. The content does not necessarily reflect the official view or policies of the South African National Roads Agency SOC Limited.
REFERENCES
Brincker, R & Andersen, P 2006. Understanding stochastic subspace identification. Proceedings, 24th International Modal Analysis Conference (IMAC), St. Louis, MO, p 126. [ Links ]
Kijko, A, Graham, G, Bejaichund, M, Roblin, D L & Brandt, M B C 2003. Probabilistic peak ground acceleration and spectral seismic hazard maps for South Africa. Technical Report 2003-0053. Pretoria: Council for Geoscience. [ Links ]
National Instruments 2009. The fundamentals of FFT-based signal analysis and measurement in LabVIEW and LabWindows/CVI. Austin, TX: National Instruments. [ Links ]
SABS (South African Bureau of Standards) 1989. SABS 0160-1989. The General Procedures and Loadings to be Adopted in the Design of Buildings (as Amended 1989, 1991). Pretoria: SABS Standards Division. [ Links ]
SANS (South African National Standard) 2000. SANS 10100-1-2000. The Structural Use of Concrete. Part 1: Design. Pretoria: SABS Standards Division. [ Links ]
SANS (South African National Standard) 2011. SANS 10160-4-2011. Basis of Structural Design and Actions for Buildings and Industrial Structures. Part 4: Seismic Actions and General Requirements for Buildings. Pretoria: South African Bureau of Standards. [ Links ]
Solms M N 2015. Seismic evaluation of the north-bound N1 - R300 bridge interchange. MSc dissertation. Stellenbosch: Stellenbosch University. [ Links ]
TMH 7 1981. Parts 1 & 2. Code of Practice for the Design of Highway Bridges and Culverts in South Africa. Pretoria: CSIR: National Institute for Transport and Road Research. [ Links ]
Visser, P & Kijko, A 2010. South Africa Spotlight on Earthquake. Johannesburg: AON Benfield. [ Links ]
 Correspondence:
M N Solms,
PO Box 53, PO Box 665
Abu Dhabi, Stellenbosch 7599
United Arab Emirates, South Africa
T: +971 52 590 6866, +27 82 448 0486
E: Michael.Solms@aecom.com, E: mnsolms@gmail.com
T N Haas
Department of Civil Engineering
Stellenbosch University
Private Bag X1
Matieland 7602
South Africa T: 021 808 4438
E: trevor@sun.ac.za

MICHAEL SOLMS obtained a BEng (Civil Engineering) in 2013 and a Master's in Civil Engineering with emphasis in Structural Engineering in 2015, both from Stellenbosch University. He is currently working as a bridge engineer for AECOM Middle East in Abu Dhabi, where he is involved with the structural analysis and design of bridges and various accompanying structures.

DR TREVOR HAAS (Pr Eng, Pr Tech Eng) is a Senior Lecturer in Structural Engineering at Stellenbosch University. He obtained a National and National Higher Diploma in Civil Engineering from Peninsula Technikon in 1991 and 1992, an MS in Civil Engineering from Southern Illinois University at Carbondale, USA, in 1999, and a PhD in Civil Engineering from Stellenbosch University in 2007. His research interests include earthquake engineering, numerical modelling, structural dynamics and engineering education. He is developing an earthquake engineering centre at Stellenbosch University. He also serves on the Engineering Council of South Africa's team for the accreditation of universities of technology.

