


Servicios Personalizados
Articulo
 Inglés (pdf)
 Articulo en XML
 Referencias del artículo
Indicadores

Links relacionados
-
 Citado por Google
 -
 Similares en Google
Compartir

 Permalink
Journal of the South African Institution of Civil Engineering
versión On-line ISSN 2309-8775
versión impresa ISSN 1021-2019
J. S. Afr. Inst. Civ. Eng. vol.58 no.4 Midrand dic. 2016
http://dx.doi.org/10.17159/2309-8775/2016/v58n4a4
TECHNICAL PAPER
Wind loading on catenary vault structures
R A Bradley; M Gohnert; A M Goliger; Y Mistry
ABSTRACT
Catenary vault structures are increasingly being utilised as an efficient alternative to the traditional circular vault. However, little is known regarding wind loading effects, in particular the pressure distribution, over these forms. Consequently, applicability of the data given for circular vaults used for the design of catenary vaults is also uncertain. In this paper the results of a wind-tunnel investigation and their implications on the design of catenary vaults are discussed. A series of tests were undertaken to assess the effects of variation in vault geometry and wind orientation on surface pressures measured over these structures. These parameters are evaluated to clarify their influence on the loading on catenary vaults. Only the results relating to mean and root-mean-square pressure coefficients are reported, in line with wind loading standardisation practice (if localised pressures are relevant, the designer is referred to expert advice or an adoption of the data from similar geometrical forms). The primary focus of the investigation is to examine the applicability of the design data given in SANS 10160-3:2011 (SANS 2011b) (referring to circular and duo-pitched roofs) to catenary structures. Subsequently, the merit of developing a set of exclusive design coefficients relating to catenary vaults is considered.
Keywords: catenary vau lts, wind pressure coefficients, wind loading, wind-tunnel testing
INTRODUCTION
The fundamental advantage of catenary shells is that they contain compressive stress only (i.e. no bending, shear or tensile forces) under the action of self-weight alone. This benefit has endorsed their use for small to medium-sized unreinforced masonry shell structures (i.e. housing and recreational buildings). Furthermore, these structures can be constructed reasonably cheaper than typical masonry and reinforced concrete structures of a similar nature (Bulovic 2014). However, whilst masonry is strong in compression, it is very weak in tension and flexure. The flexural strength is also influenced significantly by the level of adhesion that is achieved between mortar and bricks on site. Consequently these shells have an affinity to crack when exposed to relatively small tensile forces.
These aforementioned characteristics draw attention to the importance of nonuniform loading that may induce tensile stress in these structures. Thus, to ensure safety and economy, the designer must carefully consider all possible loading that may produce tensile stress, namely wind loading, thermally induced stresses, live loading, settlement and dynamic loading (in areas prone to seismic activity). Furthermore, lateral loads are severe, compared to vertical loads, particularly as the vaults become 'steeper'. In South Africa, in the absence of severe seismic activity, wind loading is typically the most significant lateral load for low-rise buildings.
It is commonly acknowledged that shell structures offer significant benefits with regard to aerodynamic efficiency, as discovered by researchers investigating wind loads over cylinders and curved roof structures. Typically, the commonly utilised shapes (e.g. circular) are included in codes of practice for the design of silos, single-vault structures and domes. At low height-to-base radius ratios, the catenary and circular profiles become practically identical. However, the scale (and form) of the structures examined in this study necessitates the use of 'steeper' profiles (to allow for reasonable amounts of usable space).
The aims of the investigations described in this paper are as follows:
1. To establish the critical importance of wind loading for unreinforced masonry catenary vaults.
2. To establish the applicability of the design pressure coefficients for circular and duo-pitch roofs stipulated in SANS 10160-3:2011 (SANS 2011b) to catenary roofs. (Therefore, in principle, the pressure coefficients that are considered in the current paper correspond to Cpe,10, i.e. the largest overall loaded areas of 10 m2, as specified in SANS 10160-3:2011 (SANS 2011b)).
3. If necessary, to develop specific external pressure coefficient data for catenary vault structures.
In order to achieve these objectives, a series of wind-tunnel tests were undertaken at the boundary-layer wind-tunnel (BLWT) of the Council for Scientific and Industrial Research (CSIR), Pretoria, South Africa. Five vault roof forms were tested in a turbulent boundary layer at multiple wind orientations. Only the mean and root-mean-square (rms) pressure coefficients are considered in this paper.
LITERATURE
Generally, the work published pertaining to wind loading on curved surfaces refers to circular vaults and domes, and no research was found in relation to catenary structures. There is, however, a wealth of information on aspects relating to similar bluff body structures and wind-tunnel testing procedures, which is applicable to the current investigation. Several papers, including Paluch et al (2003), Blessmann (1996), Taylor (1992), and Cheung and Melbourne (1983), discuss experimental investigations on single vaults, domes and curved roof structures. Of particular interest are the contributions of Blackmore and Tsokri (2006), and Toy and Tahouri (1988) (with regard to circular vaults) from which selected data is evaluated against the current results.
Blackmore and Tsokri (2006) conducted a series of wind-tunnel tests on circular vaulted roofs with different length-to-diameter ratios (L/d), height-to-diameter ratios (f/d) and with different sidewall heights (h). From these tests the authors noted that the EN 1991-1-4 (EN 2004) values for Zone B (i.e. over the central zone) appear to be most appropriate for long, vaulted buildings (i.e. L/d > 10) with two-dimensional flow rather than shorter buildings that generate three-dimensional flow.
Toy and Tahouri (1988) conducted tests on two- and three-dimensional semi-cylindrical models with different cross-sectional geometries and length/height (L/H) ratios in a turbulent boundary layer. Of particular interest are the mean surface pressure distributions over a pointed circular vault, which is somewhat similar in shape to a steep catenary vault, tested in three-dimensional flow.
From a structural point of view, the catenary is a highly efficient one-way spanning shell structure, but apart from a study on catenary cross-vaults (Bradley et al 2011), no other loading information is available.
WIND-TUNNEL MEASUREMENTS
Wind-tunnel facility
The boundary-layer wind-tunnel used in this study is an open-circuit type, with a centrifugal fan, powered by a 75 kW thryristor-controlled motor. The cross-section is 1 m high x 2 m wide, with an 18 m long boundary layer development length. An overview of this facility and its capabilities are presented in Milford et al (1988).
Boundary-layer modelling
A standard 'open terrain' boundary-layer profile, as specified in the literature (Davenport et al 2000) was achieved using a honeycomb mesh screen at the entrance of the tunnel (to introduce the initial small-scale turbulence), four 250 mm high and 100 mm wide triangular spires, followed by a 50 mm high tripping wall (to achieve an initial speed deficit in the lower section of the profile). The boundary-layer was developed by a 16 m length of corrugated cardboard with a uniform roughness height of approximately 2.5 mm. Figures 1(a) and 1(b) show the mean wind speed and turbulence intensity profiles together with the Davenport's reference data. The longitudinal turbulence spectrum, corresponding to a 50 mm elevation above the wind-tunnel floor, is shown in Figure 1(c).
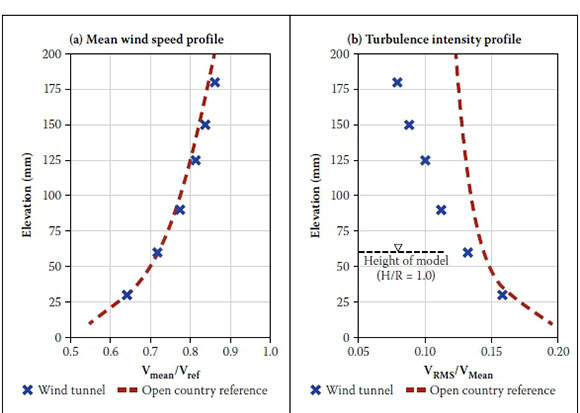

It can be seen that the mean wind speed profile achieved in the wind-tunnel compares well with the reference data, but the turbulence characteristics do not match exactly with those stipulated for open terrain. This mismatch constitutes a typical limitation of boundary-layer modelling, and larger differences are also reported in full-scale experimentation (Goliger & Milford 1985).
Pressure and velocity measurements
Point pressures were measured for wind directions between 0° and 360°, with an interval of 15°. These measurements were obtained using a Synchronous Multi-Pressure Scanning System (SM-PSS) (based on RAD3200 manufactured by the Scanivalve Corporation). The scanner type is the ZOC23B/8px, which contains eight individual pieso-electric pressure gauges. Two ZOC23B/8px units, capable of instantaneous measurements at 16 pressure taps, were used in this investigation. The pressure scanners, stainless steel tubing connectors (mounted to the circular model) and flexible plastic tubing are shown in Figure 2
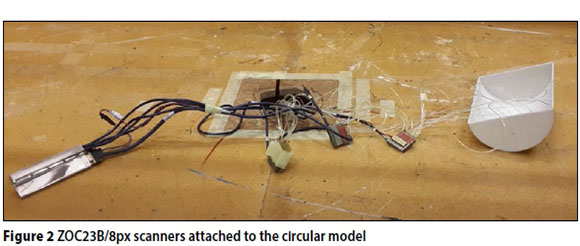
Pressure taps were connected to the system using tubing of 1.0 mm internal diameter. The reference static pressure was obtained from the wind-tunnel roof, above the model, and all pressure coefficients were normalised by the free-stream dynamic pressure at apex height of the relevant vault model. A sampling frequency of 625 Hz was used in this study. The mean and root-mean-square (rms) pressure coefficients were calculated directly from the recorded time series.
Testing was conducted at a wind speed of approximately 11.5 m/s, measured by a Pitot tube located at 750 mm above the wind-tunnel floor. Additional wind speed measurements were taken using a hot-wire anemometer system. The blockage introduced by the model was less than 1.0% of the tunnel cross-section, which is well below the generally accepted limit of 5% (beyond which blockage effects need be considered) noted in the literature (e.g. Stathopoulos & Baniotopoulos 2007). Therefore, blockage effects were considered insignificant in these investigations.
Models
Four catenary vault models (and a single semi-circular model), at a scale of 1 in 500, with different ratios of height-to-base width, were manufactured using a three-dimensional printer. The models were initially drawn using Autodesk's AutoCAD software and then printed at the CSIR. The printer utilises colour inkjet technology in which successive layers of material are printed to create a three-dimensional shape. This method offered high precision (e.g. surface finish) and significantly improved the speed of construction - all models were printed simultaneously (the CAD arrangement is shown in Figure 3(a)). A comparison of the catenary and semi-circular models (with attached sandpaper), corresponding to H/R = 1.0, are shown in Figure 3(b). The catenary model profiles are illustrated in Figure 3(c), and all relevant geometric parameters are given in Table 1

In all models, only a quarter of the roof was instrumented with twelve pressure taps, as shown in plan and elevation in Figure 4 A single pressure tap was also located at the centre of a sidewall for each model. Due to the geometric symmetry of the models and the application of a range of wind directions from 0° to 360°, effectively 35 roof pressure locations, distributed over the entire roof, were investigated. In this paper, the wind direction is denoted by α, whereas the geometric inclination angle is represented by θ, as illustrated in Figure 4

Reynolds number modelling
For all structures, flow separation points determine the distribution of external pressures. In the case of elements with sharp edges, this separation takes place (and is controlled) by these edges. However, this is not the case for round surfaces, where the pressure distribution is dependent on the viscous forces in the boundary layer. These are characterised by Reynolds's number, which defines the relationship between the characteristic wind speed (V), size of the structure (D) and air viscosity (v), as follows: Re= VD/v. The Reynolds number corresponding to a typical vault, with a size comparable to a house, is about 107, and in the model scale about 105. These correspond to the supercritical and subcritical Reynolds number regimes respectively, and the loading implications are reflected in SANS 10160-3:2011 (SANS 2011b). In order to achieve similitude between model and full-scale flow regime, roughening of the model surface was adopted. The required size of the grain (k) was determined on the basis of the Engineering Science Data Unit-80025 (ESDU 1980) procedure. Sandpaper (P100) was attached to the model surface, giving grain size to model height (k/H) ratios between 2.5 x 10⁻³ to 5 x 10⁻³.
RESULTS AND DISCUSSION
Effect of wind orientation (a)
Initially, the variation of surface pressure coefficient (at selected positions) with wind direction is discussed. In general, similar trends were observed for all models investigated. However, significant variation is evident at certain tap locations and wind orientations. The mean pressure coefficient plots for four selected tap locations, namely base edge (tap 1), base middle (tap 9), apex edge (tap 4) and apex middle (tap 12) are shown in Figures 5(a-d).
In Figures 5(a) and 5(b) it is evident that the pressure coefficients corresponding to the base taps (1 and 9) show a relationship in which they initially experience positive pressures until the presence of the sharp edge begins to control the location of flow separation. At wind directions (α) between 0° and 60° pressures are positive, and the switch from positive to suction pressures roughly occur between 60° and 70° for all models. It can also be seen in Figures 5(a) and 5(c) that th highest negative pressure coefficients for t 'edge' taps (1 and 4) occur between 75° to 9 The reason for these larger suctions is the close proximity of these taps to the positio of flow separation at these wind orientations.
Considering tap 12 (Figure 5(d)), a substantial shift in the magnitude of pressure coefficients is apparent at a wind orientation between 15° and 45° for all models. In fact, for the orientation of about 30°, the highest magnitude suctions in the entire study were measured. Furthermore, these figures indicate a trend in which shallower catenary vaults generate higher negative pressures. The importance of three-dimensional flow for structures with a low footprint aspect ratio (i.e. L/d) is also highlighted in Figure 5
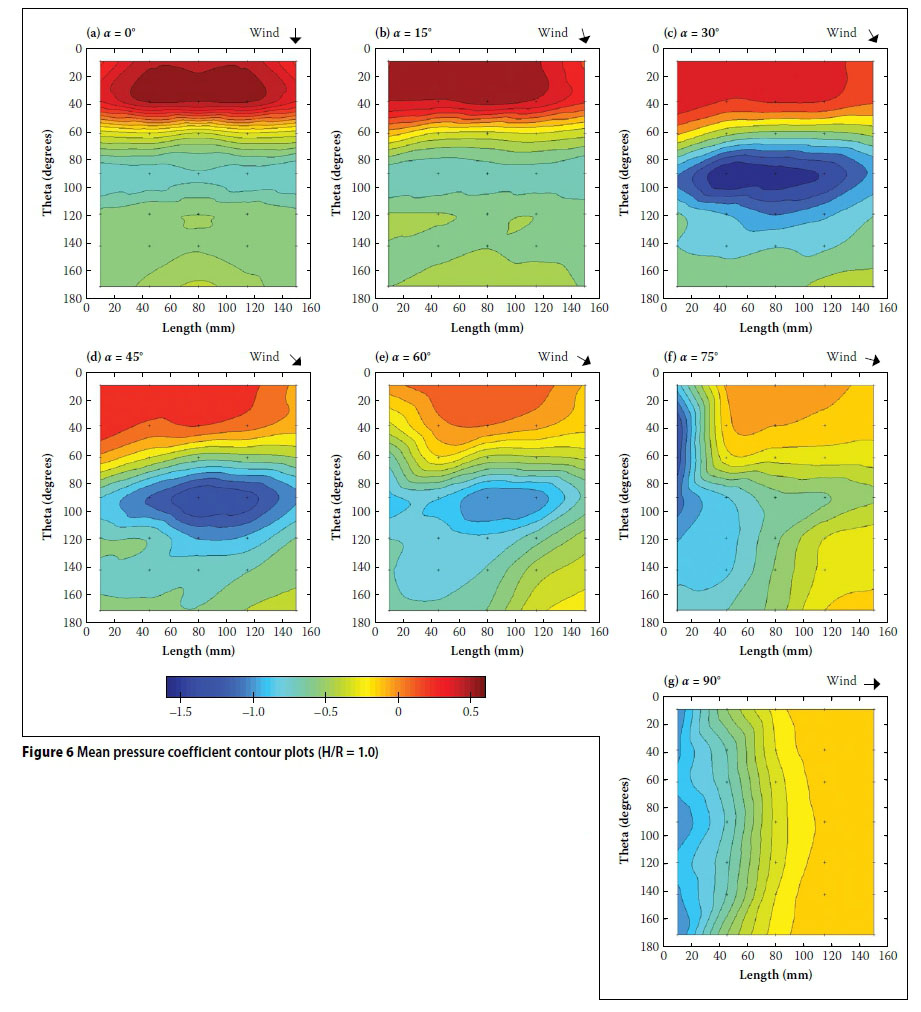
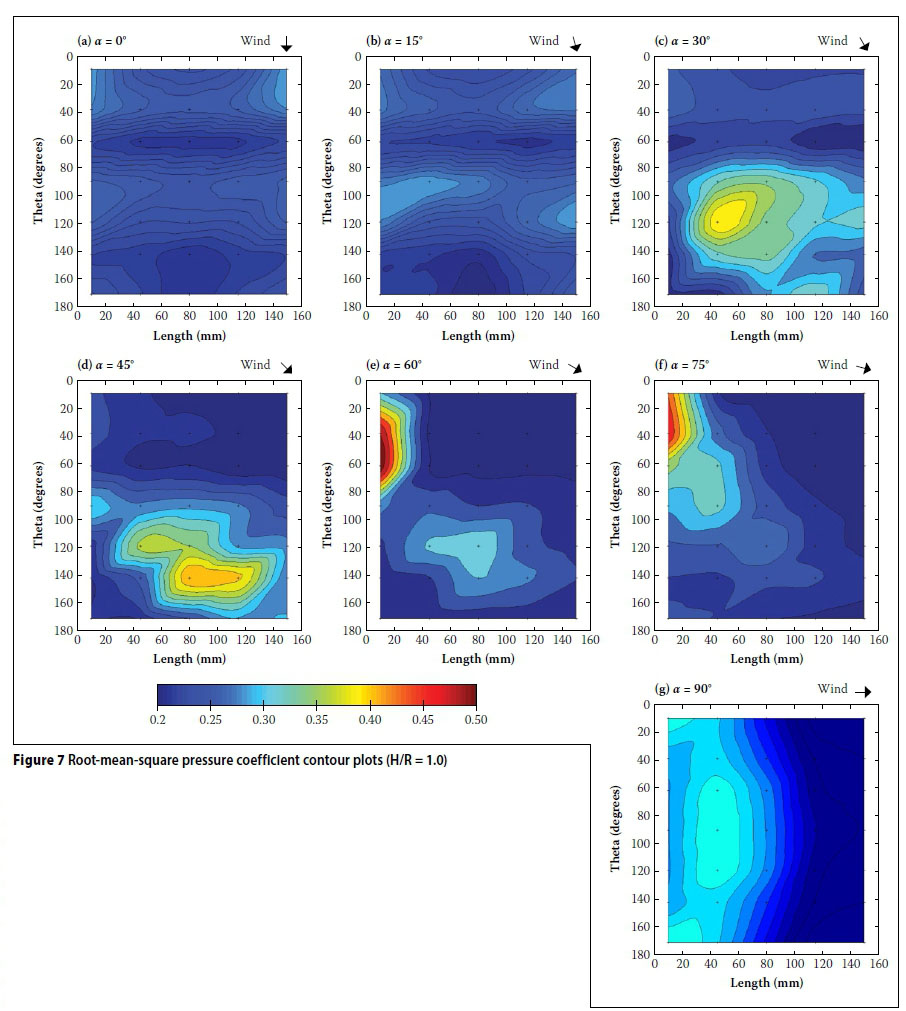
Figures 6(a-g) and Figures 7(a-g) present contour lines of mean and rms pressures respectively. (These plots were produced using MATLAB® subroutines, with the adoption of cubic interpolation to approximate contour lines.) The plots are presented in terms of length (x-axis) and inclination angle θ° (y-axis). Note that these figures do not depict the actual footprint of the roof, but are distorted geometrically for the sake of brevity. These graphs, for H/R = 1.0 only, confirm the observation made above in which the most negative pressures (i.e. dark blue) correspond to α = 30°. Furthermore, the largest positive pressures (i.e. intense red) correspond to the 0° orientation for all models. Both negative and positive pressures are relevant, as they can lead to critical loading situations and are thus the focus of further analysis later in this paper.
The distribution of mean pressure coefficients measured at mid-height of the gable wall is shown in Figure 8 As expected, the maximum positive pressure, Cpe > +0.8, occurs for wind blowing onto the wall (90° orientation), and its magnitude is similar to that which could be derived for vertical walls of rectangular plan buildings (SANS 10160-3:2011 (SANS 2011b)). For a wind orientation of 0°/180° (flow parallel to the gable walls), the negative mean pressure coefficient is Cpe ≈ -0.5. For a wind orientation of 270° (pressure tap located at the leeside of the structure), the negative mean pressure coefficient is Cpe ≈ -0.2. Both of these are visibly smaller than the respective values that could be established from the loading code. Intuitively such relationships seem to be correct, due to the lack of a vertical edge (i.e. walls) along which separation of the flow takes place. In the case of the curved edge, part of the air volume is directed upwards, thus reducing the volume of the flow subjected to flow separation.
Effect of vault geometry (H/R)
Wind parallel to curvature (α = 0°)
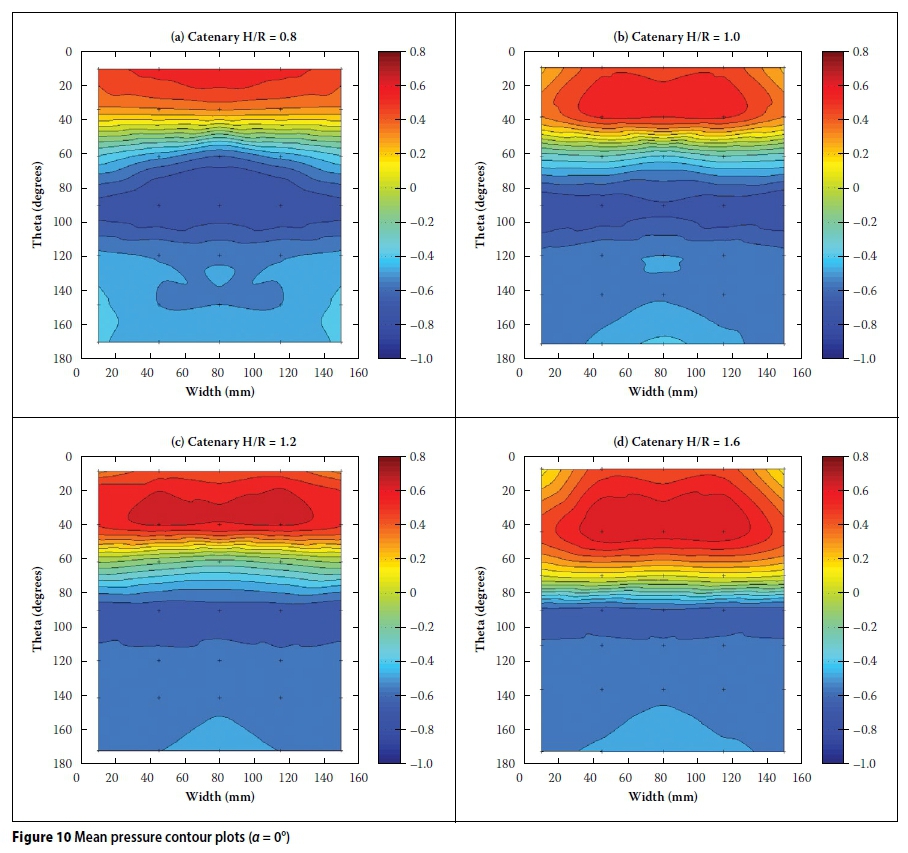
Mean and root-mean-square pressures measured along the centreline, for the four catenary vault models, are compared in Figures 9(a) and 9(b) respectively. The results of these tests reveal that there is a substantial mean pressure coefficient difference between all vaults on the windward side. The contour plots in Figure 10- in which warm colours indicate positive pressure and cooler colours indicate suction - further illustrate this point. It is apparent in Figures 10(a) through 10(d) that, by increasing the H/R ratio, and effectively the average slope of the roof, the point at which positive pressure transitions to negative pressure (i.e. suction) moves upward along the windward face. This shift (when H/R is increased) generates a larger area subjected to positive pressures on the windward surface, which has important design implications that are discussed later in this paper.
The minimum (i.e. most negative) mean pressures occur near the apex of all four models. Furthermore, by comparing the contour plots (see Figure 10(a-d)) it is evident that the extent of these minimum pressures (shown in dark blue) decreases with an increase in height to radius ratio of the vaults. It is also observed that the pressures on the leeward side of the H/R = 1.6 catenary vault are near constant, from the roof apex, i.e. θ = 90°. However, the distribution for the H/R = 0.8 model reveals that suctions become fairly constant at an elevation angle of roughly 120°, which is similar to that noted for the semi-circular vault. For the most part, only negligible variation between all four models is evident over the leeward half for this wind orientation.
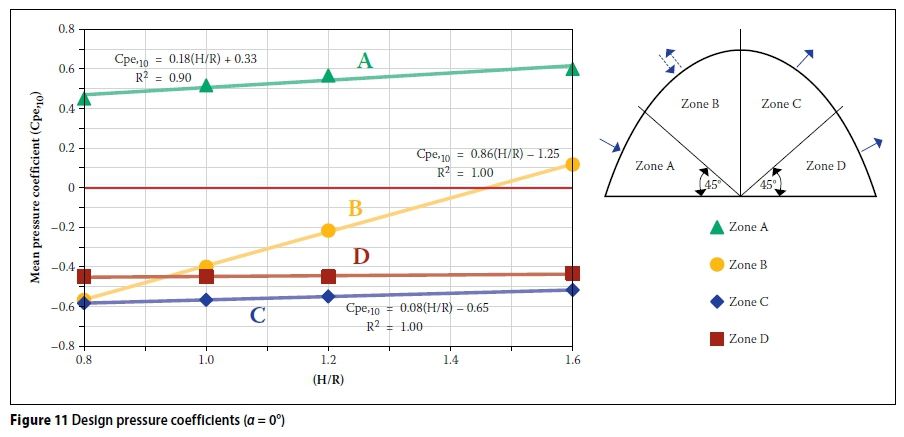
The variation of pressure coefficients with H/R ratio, for α = 0°, are given in Figure 11 An attempt was made to interpret these pressures in a similar manner as those given in SANS 10160-3:2011 (SANS 2011b) for circular vaults. However, due to the nature of the wind pressure distributions over the 'steeper' catenary vaults, it was considered necessary to subdivide the central portion of the roof (Zone B - in SANS 10160). Consequently, four loading zones (A-D) are stipulated. The distribution/extent of these zones is illustrated in Figure 11 The magnitude of the pressure corresponding to each zone was determined through numerical averaging of the pressure distributions over the respective area. Each zone was divided into six equal segments and the 'actual' distribution (derived through cubic interpolation) was approximated and replaced by uniform values. The total coefficient for each zone was thus approximated as follows:

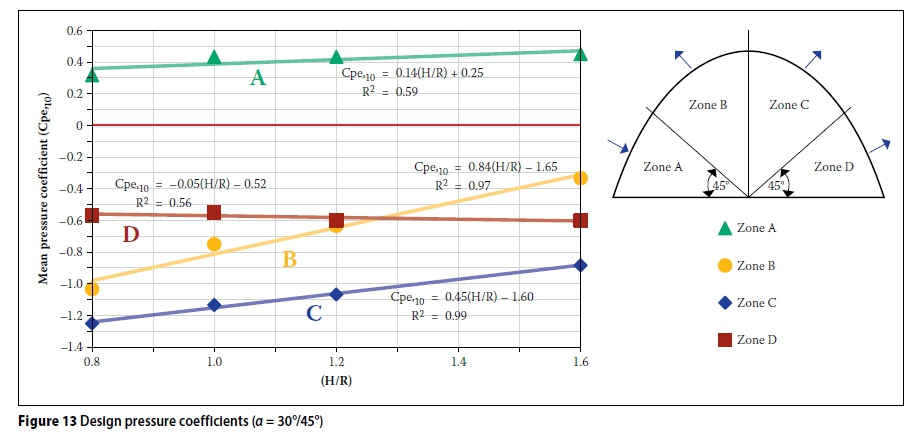
Oblique wind orientations (α = 30°; = 45°)
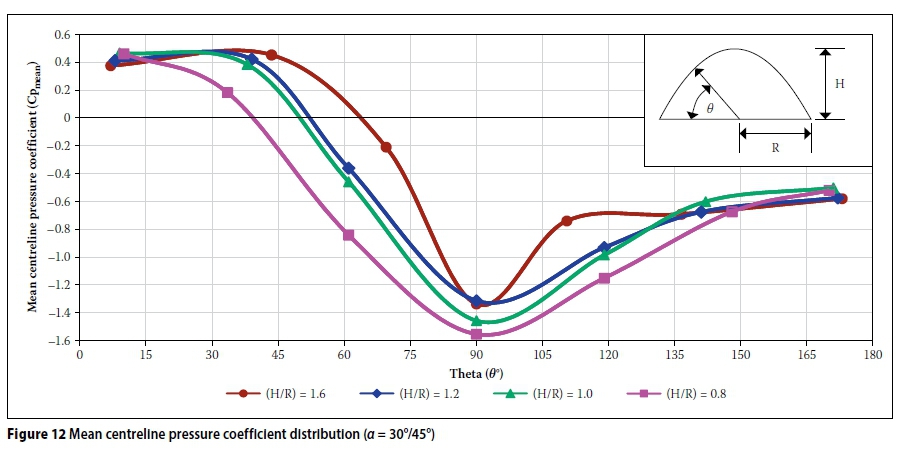
As discussed in the previous section, the largest negative pressures develop for wind orientations (α) between 30° and/or 45° for all catenary vaults, and the respective pressure coefficient design data is considered in this section. The data corresponding to most negative suctions at both orientations, and for each catenary profile, is plotted in Figure 12(i.e. for aspect ratios H/R = 0.8, 1.0 and 1.2 graphs correspond to α = 30°, whereas for H/R = 1.6 and α = 45°). It also reconfirms the previous observations that the most negative mean pressures correspond to the shallowest catenary vault. It can also be observed that at lower elevations, over the leeside of all vault types (for θ > 140°), the magnitude of pressure coefficients is similar (-0.5 > CLpe > -0.6). Figure 13 presents the design plot, derived from numerical averaging, in a similar manner to that discussed in reference to Figure 11
Wind blowing onto a gable wall (a = 90°)
For wind normal to the eaves of a circular roof there is no information given in EN 1991-1-4 (EN 2004) (or in SANS 101603:2011 (SANS 2011b)). However, Blackmore and Tsokri (2006) conducted tests on curved roofs and compared their results with EN 1991-1-4 (EN 2004) regarding duo-pitch roof data. Their findings generally revealed satisfactory agreement for design purposes. In the current study, a similar approach was investigated and proposed (with regard to the extent of loading zones and magnitude of the design pressures).
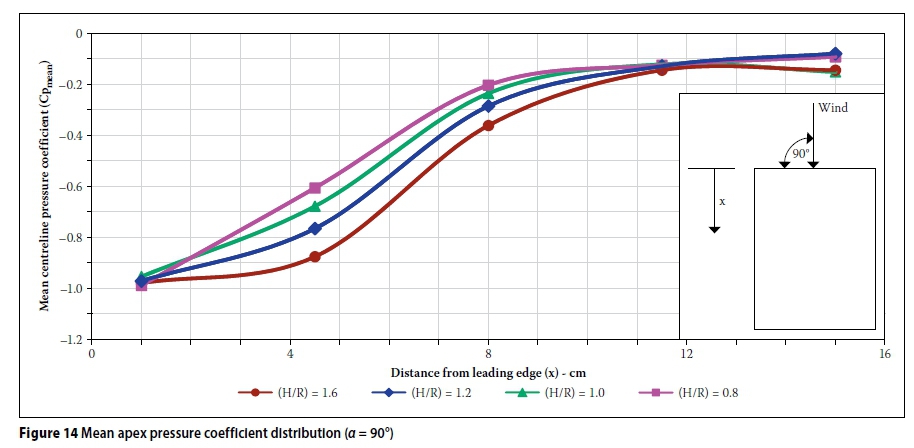
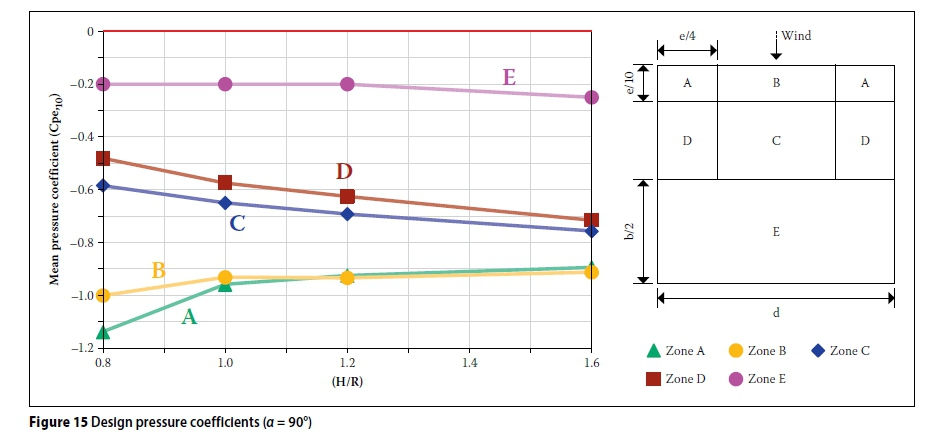
The distribution of mean pressure coefficients measured along the apex of the catenary vaults is shown in Figure 14 Flow separation for this wind orientation is controlled by the wall roof interface; thus variation observed between the roofs is likely due to differences in edge geometry. The corresponding distribution of design coefficients for this orientation is given in Figure 15 Along the edge, the largest suctions correspond to the lowest vault. However, suctions over zones D, C and E (as shown in Figure 15 are largest over the 'steepest' vault, and gradually reduce with height. (A similar trend is observed in data due to Blackmore and Tsokri (2006) for circular vaults.)
Comparisons
Catenary vs circular (current data)
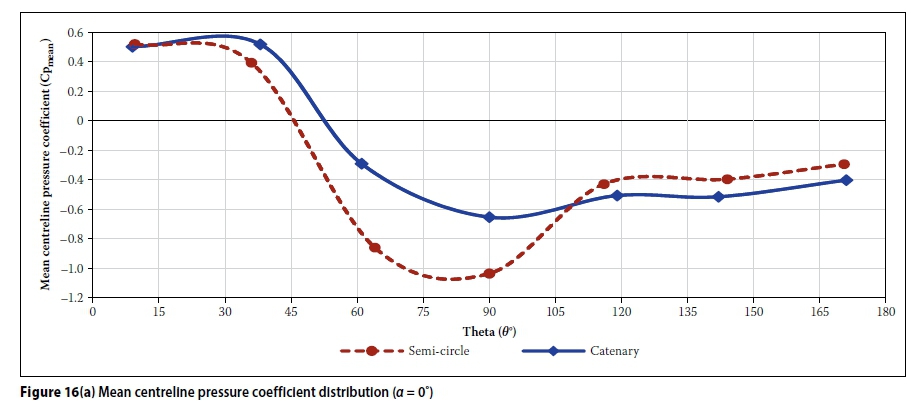
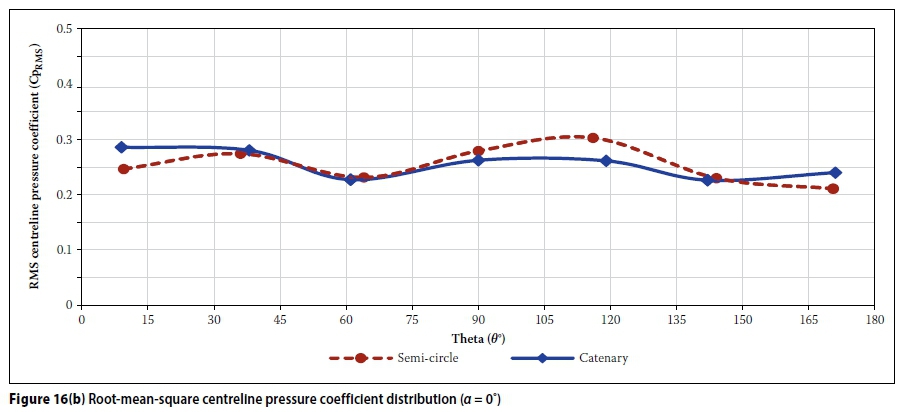
The distributions of mean and rms centreline pressure coefficients corresponding to the catenary and semi-circular vault models (with the same height and base width, i.e. H/R = 1.0) are compared in Figures 16(a) and 16(b). The mean pressure coefficients indicate a similar trend, with considerable difference in the magnitude (of about 40% over the apex). The overall form compares well with the standard textbook distribution for a circular element. Furthermore, the rms pressure coefficients are largely similar.
The contour lines of the mean pressure coefficients (for α = 0°) corresponding to both geometries are also shown in Figures 17(a) and 17(b). It can be noted that the semi-circular vault generates a larger magnitude of negative pressures, and the extent of the negative pressure zone is also larger. This disparity is likely to be caused by a 'steeper' (over most of the roof) slope corresponding to the catenary shape. In Figure 18 a comparison of both geometries (in terms of an 'inclination' angle β) is made. The line corresponding to the semi-circle is straight (i.e. constant angle), whereas the line of the catenary is curved and either above or below the 45° line. It can be seen that the semi-circle is 'steeper' up to about θ = 30°, after which the catenary becomes 'steeper' until the apex (i.e. θ = 90°).

Blackmore and Tsokri (2006)
Figure 19 evaluates the current results (obtained from numerical averaging for H/R = 1.0) with the corresponding data from SANS 10160-3:2011 (SANS 2011b) (which follows EN 1991-1-4 (EN 2004)), as well as the experimental data due to Blackmore and Tsokri (2006).

It is evident that the current experimental data, as well as that due to Blackmore and Tsokri (2006), for the semi-circular vault differs from that prescribed by SANS 10160-3:2011 (SANS 2011b), particularly over the central portion of the roof (i.e. zone B in Figure 19. The current data does, however, generally match that due to Blackmore and Tsokri (2006) for a vault with a length-to-diameter ratio of 1.0 (i.e. small footprint aspect ratio). The vaults considered in the current investigation are relatively short, with L/D = 1.3. Furthermore, the pressure distributions shown in Figure 17 emphasise the three-dimensional nature of the flow. The difference observed in Figure 19 (over zone B) can be attributed to the disparity between two- and three-dimensional flow regimes over circular vaults.
Toy and Tahouri (1988)
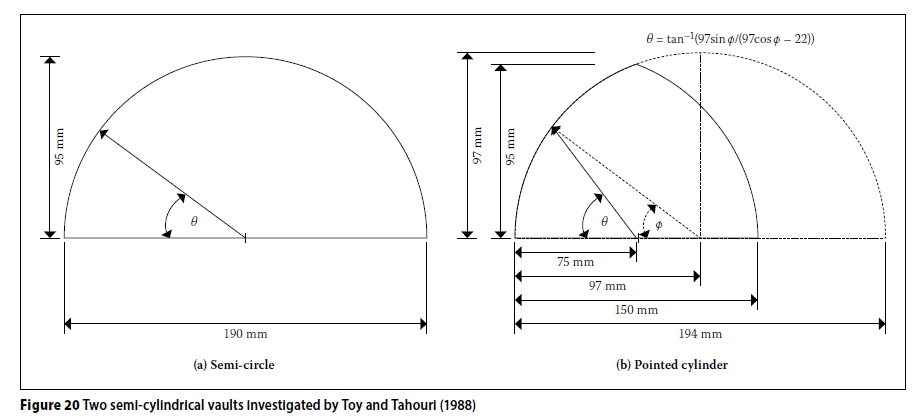
Toy and Tahouri (1988) investigated the influence of the model aspect ratio (in the horizontal plane) reflecting the effects of two- versus three-dimensionality of the flow. (Three situations were considered, namely L/H = 2, L/H = 4 and a two-dimensional situation, i.e. a model across the entire width of the test section.) Furthermore, differences in cross-sectional geometry of the vaults were also tested. Figure 20 presents only two of these semi-circular cross-sectional geometries.
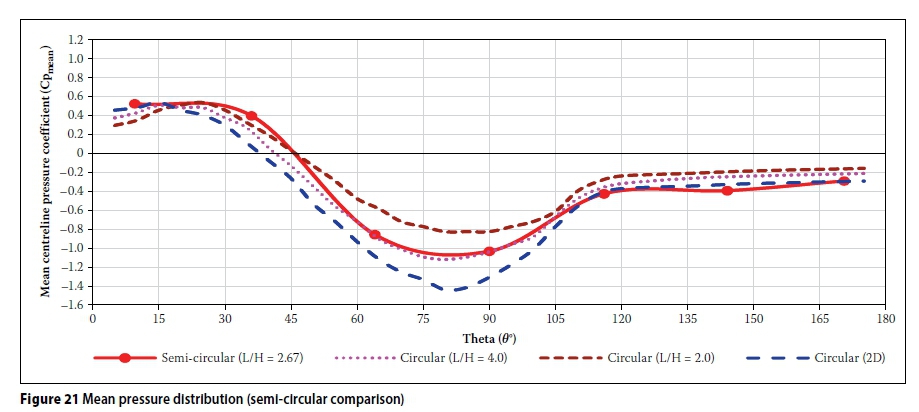
Figure 21 compares three semi-circular distributions (at different aspect ratios) and the current data. Data corresponding to Toy and Tahouri (1988) (for ratio L/H = 4) compares well with the present data. A similar observation can be made to that noted by Blackmore and Tsokri (2006) regarding the significant effect of two- versus three-dimensionality of the flow.
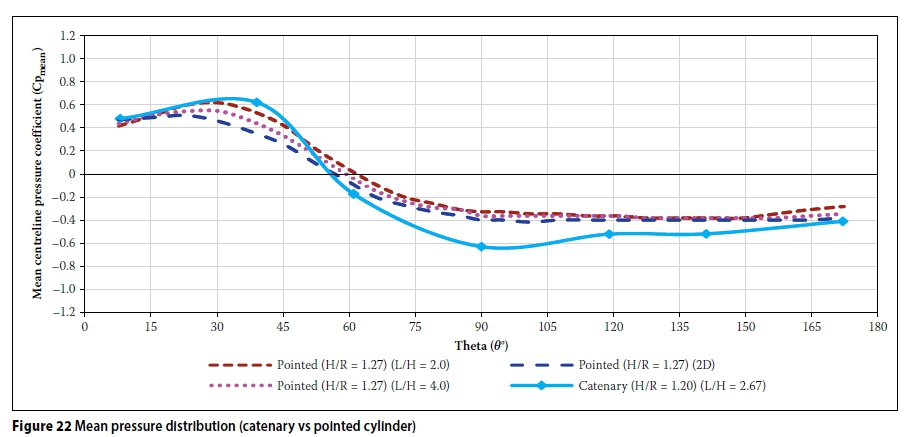
In Figure 22 a comparison is also made between the 'pointed' cylinder (as illustrated in Figure 20(b)) and the most similar geometry of catenary vault (i.e. H/R = 1.2). (To be noted, data published by Toy and Tahouri (1988) has been extracted and re-plotted in a different manner to suit the current comparison, i.e. a mathematical conversion was developed in order to express the vault geometry in terms of angle θ and not φ.)
Interestingly, the distributions show some similarity. However, the sharp apex controls flow separation for the pointed cylinder, which is not the case for the catenary vault. Also of interest to note is that Toy and Tahouri (1988) observed the largest negative pressures over the pointed cylinder at a wind orientation of α = 45°.
APPLICATION / DESIGN CONSIDERATIONS
This section describes a series of finite element (FE) models which were implemented using the data developed in the current study, as well as the corresponding information derived from SANS 10160-3:2011 (SANS 2011b), as loading inputs. This was done to establish the applicability of the standardised loading data to the design of catenary vaults. Furthermore, the importance of wind loading on catenary vaults is investigated and discussed.
Finite element models
For ease of calculation, the catenary vaults were modelled as a one-metre wide arch/ strip. This simple analysis is considered adequate, due to the nature of the loading, support conditions and the need for a critical expansion joint between the vault and gable walls (Bradley & Gohnert 2016). Furthermore, translational restraint only is assumed for the FE models considered in the present paper.
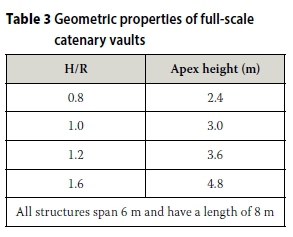
The material and geometric properties of the masonry vaults adopted in the present study are given in Tables 2 and 3 respectively. To be noted, although simple two-dimensional FE models are assumed, all stress and bending analyses reflect vaults having plan areas of 48 m2 (i.e. 6 m wide and 8 m long). However, the height and vault thickness are adjusted to accommodate the various comparisons considered in this paper. Although masonry is anisotropic, with variable stiffness and strength, material isotropy was assumed due to the one-way span and load distribution. Consequently, a two-dimensional analysis using bar elements, to create the curved catenary shape, was employed in the current investigation. The surface pressures were applied to the models as a series of horizontal and vertical point loads.

Three load cases associated with the two critical wind orientations (0° and 30°/45°) are summarised in Table 4 For these load cases, the internal pressure coefficients (Cpi) of -0.3, 0 and +0.2 were adopted. In principle, it has to be considered that the full-scale gable walls will accommodate openings (i.e. doors and windows). This, in turn, implies a risk of generating the situation of dominant openings, i.e. higher magnitude of positive internal pressures (≈ +0.7), corresponding to the wind blowing onto these walls (α = 90°). However, this situation results in a symmetrical load distribution, which is not critical for these catenary vaults. The wind pressures acting over the structures were determined using the coefficients derived in Figures 11 and 13 in combination with the stipulations of SANS 10160-3:2011 (SANS 2011b). The structures were assumed to be located in Johannesburg. The design and site parameters are summarised in Table 5


Finite element results
The bending moment diagrams for the 0° and 30° wind orientations (corresponding to load variation 2 in Table 4 are shown in Figures 23 and 24 respectively. As expected, the bending moments are largest for the 'steepest' vault (i.e. H/R = 1.6) and lowest for the shallowest vault (i.e. H/R = 0.8).
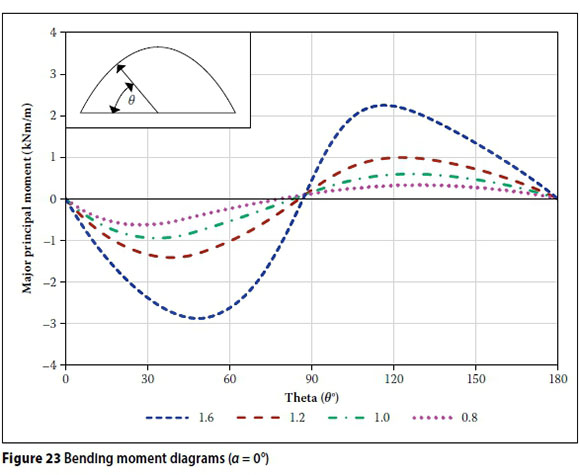
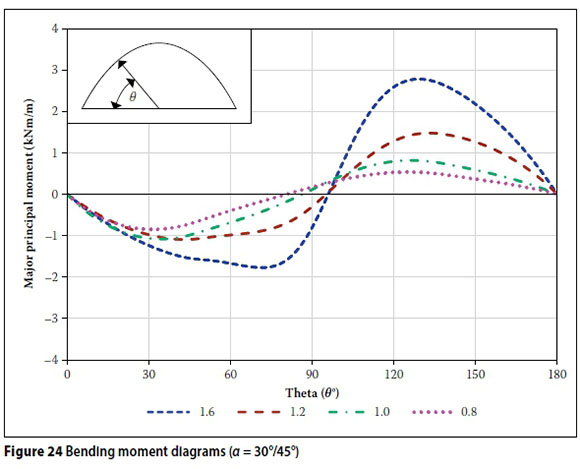
This observation is attributed to the critical nature of the pressure distribution over vaults with high aspect ratios (H/R). In particular, this is due to the development of larger positive pressure (applied over a larger area) on the windward face, in combination with negative pressure over the leeward half. However, it is also partially attributed to the large difference in total surface area between the various vaults (the total surface area for the 'steepest' vault is roughly 1.5 times larger than the 'shallowest').
Interestingly, for H/R between 0.8 and 1.2 the maximum bending moments correspond to the load case with wind blowing at 30°. However, for the 'steepest' vault (i.e. H/R = 1.6), maximum bending is observed for α = 0°.
Several load scenarios were considered to emphasise the importance of the correct consideration of wind loading for the design of unreinforced masonry catenary shells. The design of these shells typically incorporates the development of a pure compression form under self-weight alone, after which asymmetric load combinations are applied and the shell thickness is adjusted until no tension exists within the structure.
The load cases considered in this paper incorporate dead, live and wind loading in combinations illustrated in Figure 25 Imposed loads are derived from SANS 10160-2:2011 (SANS 2011a) for inaccessible roofs (i.e. Category H1 and H2). The surface loading (qk), for a plan area greater than 15 m2, of 0.25 kN/m2 is adopted. A value of qk= 0.5 kN/m2 is also considered to shed light on the sensitivity of catenary vaults to this type of loading. The most severe case for this distributed vertical load corresponds to its action over one half of the structure only (specifically the windward half when wind and live loads are considered in combination).
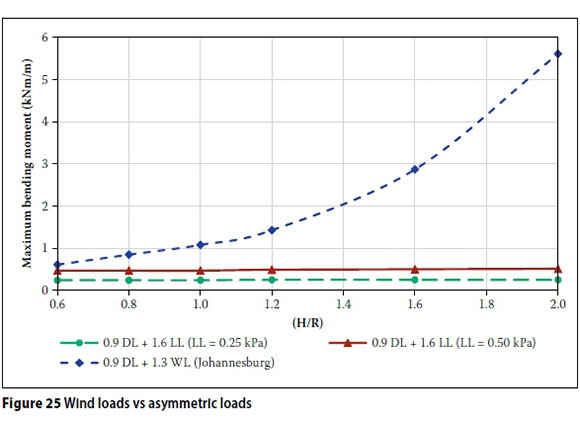
Figure 25 shows the relationship between aspect ratio H/R and the maximum bending moments, for all load combinations, corresponding to the vault size adopted in the current study. (The pressure distribution corresponding to H/R = 2.0 used in this comparison was obtained through an extrapolation of the data given in Figure 11. It is evident that the bending moments obtained for the vertically imposed loads do not vary visibly with changes in aspect ratio. However, an exponential relationship is observed for the wind load combinations. In fact, considering the H/R = 1.6 vault, the bending moment derived for the wind load case is an order of magnitude greater than that for the imposed vertical live loads. This result clearly identifies the significance of lateral/ wind loads over these catenary shells - particularly for the profiles with high aspect ratios (i.e. H/R).
Comparisons of experimental data and SANS 10160-3:2011
The above observations, in combination with the form of the pressure coefficient distributions shown in Figures 9(a) and 12, prompted a comparison of the experimental data with the design coefficients stipulated for traditional structural forms (i.e. circular and duo-pitch roofs) in SANS 10160-3:2011 (SANS 2011b).
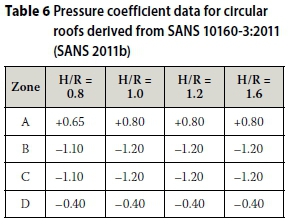
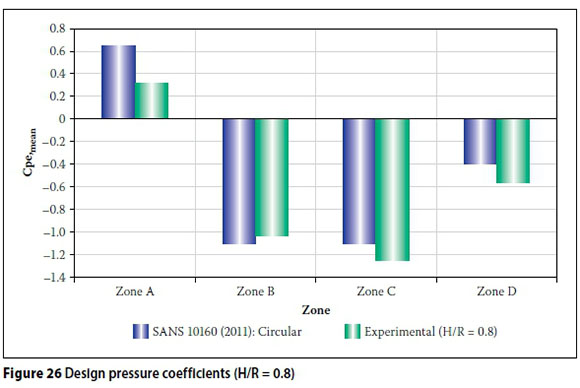
Circular roofs
Pressure coefficients, from SANS 101603:2011 (SANS 2011b), corresponding to circular vaults are given in Table 6 Figure 26 shows a comparison between the experimental pressure coefficients for the catenary vault, with H/R = 0.8 and the above-mentioned data corresponding to a circular vault with f/d = 0.4. Both distributions are represented by four zones (i.e. A, B, C and D), as discussed previously. A good degree of similarity is observed between these pressure coefficients. Figure 27 illustrates the bending moment diagrams obtained by applying both distributions to the catenary vault with H/R = 0.8. This figure demonstrates the general applicability of the codified data for circular roofs to shallow catenary vaults.

Duo-pitch roofs
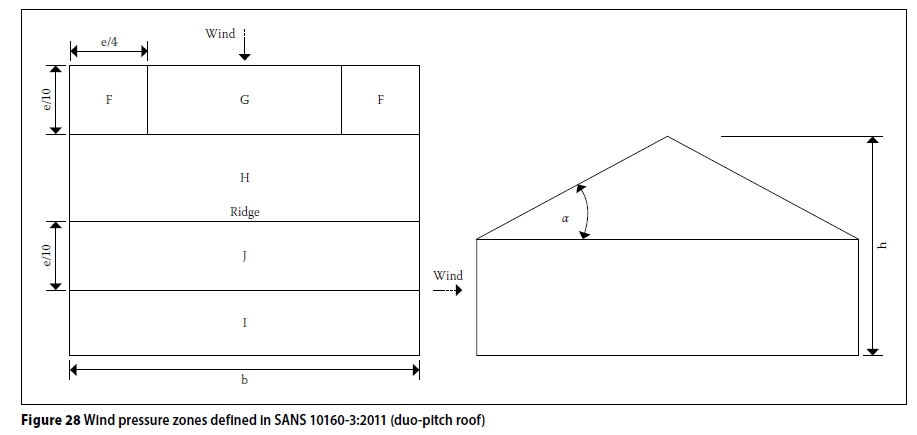
Divergence of the bending moment diagrams occurs when the semi-circular vault design coefficients (from the loading code) are evaluated against the experimental data for the 'steepest' vault. Consequently, the applicability of data for duo-pitch roofs is investigated as an alternative. The relevant pressure coefficients, derived from SANS 10160-3:2011 (SANS 2011b), and the distribution of related zones F, G, H, J and I, are given in Table 7 and Figure 28 respectively. It should be noted that the suctions in zones F, G and J over duo-pitch roofs reflect the risk of vortices generated over the corners (i.e. wing-tip vortices), and flow separation at the eaves and ridge (this, however, is not the case for the curved roofs investigated in this study, which do not contain raised corners, a sharp ridge or eaves). Consequently, the negative pressures stipulated for zones F and G in SANS 10160-3:2011 (SANS 2011b) are disregarded, and only positive pressures are considered over the windward areas. However, the suction over zone J is adopted.
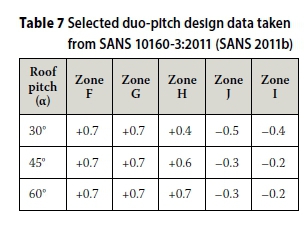
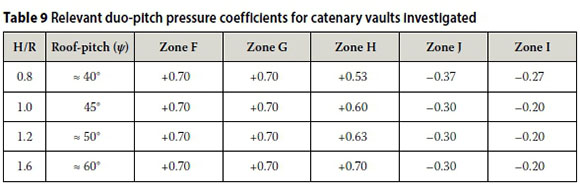
The average 'pitch' angle of the curved roofs is determined by inscribing straight lines from its base to apex, i.e. ψ = tan-1 (H/R) - see illustration in Table 8 The parameter 'e', which defines the extent of zones F, G and J, is also incorporated in Table 8 Each catenary geometry gives rise to a different average roof slope (not necessarily the same as per loading code). Therefore, in order to accommodate a fair comparison of both data sets, linear interpolation between the 30°, 45° and 60° roof slopes was implemented. The adopted coefficients are included in Table 9

In this section only the pressure distributions corresponding to the 'steepest' catenary vault are compared. The pressure coefficients for both data sets are grouped into six zones to clearly illustrate the differences (see Figure 29. Some of the zones corresponding to the duo-pitch data have been sub-divided in half (i.e. zones H and I) to accommodate this comparison. It can be seen in Figure 29 that there is good agreement between both distributions for the windward zones 1 and 2. However, significant discrepancy between the coefficients over zone 3 is apparent. Also, the coefficients corresponding to the experimental data are more negative over the leeward surface. Although these coefficients show somewhat large variations on some parts of the roof, they ultimately result in a similar bending moment diagram as shown in Figure 30 If Figures 29 and 30 are considered in combination, the effect of the lower pressure on the windward face (in the experimental data) is countered by larger suctions on the leeward face, leading to a similar net loading effect for both distributions.


Design recommendations
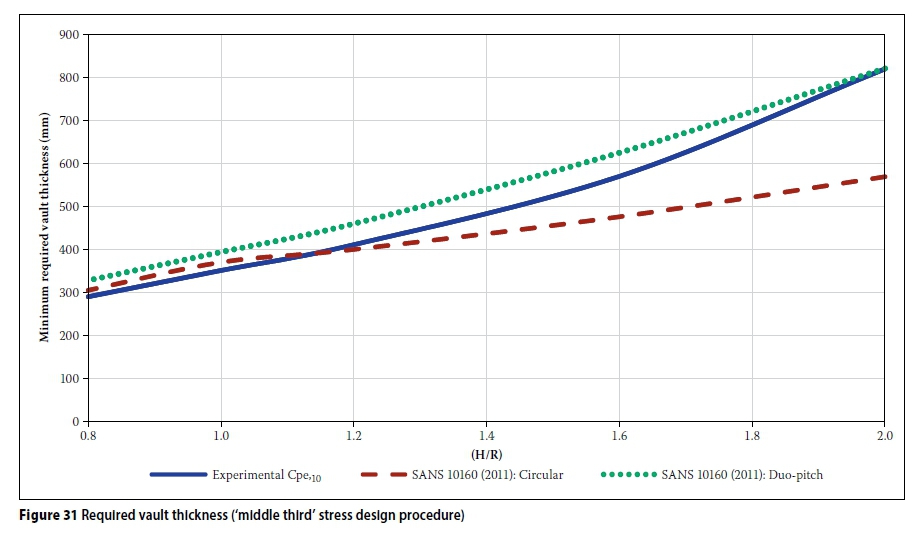
In order to determine the point at which the circular design coefficients become inadequate, and the duo-pitch data should be adopted, a comparison of the minimum required design vault thicknesses was carried out. An elastic design, adopting 'the middle third' technique and pinned end connections, was selected as a simple methodology to facilitate the relevant comparisons. To be noted, graphic statics (and limit analyses) are preferred design methodologies, since elastic analyses require several assumptions about the material, which is anisotropic and imperfectly elastic. Furthermore, elastic methods may lead to overly conservative designs. However, a simplified elastic analysis is reasonable for the comparisons made in the present paper. The concept of 'the middle third' is derived directly from bending theory as follows:

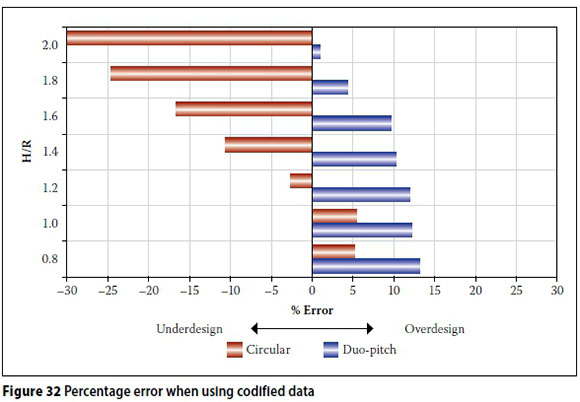
The results of the stress design processes are shown in Figure 31 It can be seen that the use of the duo-pitch data typically leads to a conservative design. However, the minimum shell thicknesses, derived from 'duo-pitch' and experimental coefficients, converge at an H/R value of approximately 2, and the circular data is less conservative than the duo-pitch data up to an H/R value of roughly 1.2. The significance of these differences is clearly emphasised in the percentage error plot shown in Figure 32 Based on these comparisons it is proposed, for design purposes, that catenary vaults with an H/R < 1.2 could be designed using the coefficients given in SANS 10160-3:2011 (SANS 2011b) for circular vaults, whereas duo-pitch data may be adopted for profiles greater than H/R = 1.2. This finding demonstrates that no specific design data on wind loading of catenary vaults needs to be derived.
CONCLUSIONS
A series of wind-tunnel tests were carried out at the CSIR to measure wind pressure coefficients on catenary vault structures. Four catenary vault roof geometries and a semi-circular shape were modelled and tested in a nominal boundary layer corresponding to an open-terrain category. The primary purpose of these measurements was to assess applicability of the design data included in SANS 10160-3:2011 (SANS 2011b), and to establish the need for development of particular data related to catenary vaults.
The following conclusions can be made:
■ A set of design wind pressure coefficients, measured in three-dimensional flow conditions, was derived for catenary vaults with aspect ratio (H/R) between 0.8 and 1.6.
■ The critical orientation for the shallow (i.e. H/R < 1.2) catenary vaults corresponds to α = 30°, whereas for the highest vault (i.e. H/R = 1.6) this corresponds to α = 0°.
■ The distribution of pressure coefficients over the catenary vault with lowest H/R ratio shows the greatest degree of similarity with the circular form, as per SANS 10160-3:2011 (SANS 2011b). For the 'steepest' vault, the experimental data exhibits the closest resemblance to the duo-pitch data from the above-mentioned standard.
■ It was established that an H/R ratio of 1.2 constitutes 'the border case' for the application of both approximations (i.e. for H/R < 1.2) where the 'circular data' may be adopted, whereas for H/R > 1.2 the 'duo-pitch data' is more adequate.
■ When adopting the 'duo-pitch data' (for H/R > 1.2), the average roof pitch (ψ) for the catenary profiles can be approximated as ψ = tan-1 (H/R).
■ Masonry vaults are commonly considered as being of substantial self-weight, of markedly larger magnitude than the wind loading. However, the wind effects on unreinforced catenary shells (particularly those with steep profiles) may govern design, as demonstrated in the current paper.
ACKNOWLEDGEMENTS
The authors gratefully acknowledge the support of the South African National Research Foundation (NRF). Mr Ters van Wyk of the CSIR is thanked for his assistance with the execution of experimental work, and Mr Edward Pretorius of the University of the Witwatersrand for his assistance with model instrumentation and preparation.
REFERENCES
Blackmore, P A & Tsokri, E 2006. Wind loads on curved roofs. Journal of Wind Engineering and Industrial Aerodynamics, 94: 833-844. [ Links ]
Blessmann, J 1996. Researches on wind effects on domes in Brazil. Journal of Wind Engineering and Industrial Aerodynamics, 65: 167-177. [ Links ]
Bradley, R A, Goliger A M & Gohnert M 2011. Wind tunnel study of cross-vault structures. Proceedings, 13th International Conference on Wind Engineering, Amsterdam, Netherlands, 10-15 July. [ Links ]
Bradley, R A & Gohnert M 2016. Three lessons from the Mapungubwe shells. Journal of the South African Institution of Civil Engineering, 58(3): 2-12. [ Links ]
Bulovic, I 2014. Catenary vaults: A solution to low-cost housing in South Africa. Master's dissertation. Johannesburg: University of the Witwatersrand. [ Links ]
Cheung, J C K & Melbourne, W H 1983. Turbulence effects on some aerodynamic effects of a circular cylinder at supercritical Reynolds number. Journal of Wind Engineering and Industrial Aerodynamics, 14: 399-410. [ Links ]
Davenport A G, Grimmond, S, Oke, T & Wieringa, J 2000. The revised Davenport roughness classification for cities and sheltered country. Proceedings, 3rd Symposium on the Urban Environment, Davis, CA, US, pp 7-8. [ Links ]
ESDU (Engineering Sciences Data Unit) 1980. Mean forces, pressure and flow field velocities for circular cylindrical structures: single cylinders with two-dimensional flow. Data Item ESDU 80025, London: ESDU International. [ Links ]
EN (European Standard) 2004. EN1991-1-4 2004. Eurocode 1: Actions on Structures - Part 1-4: General Actions - Wind Actions. Brussels: European Committee for Standardization (EN). [ Links ]
Goliger, A M & Milford, R V 1985. Simulation of the atmospheric boundary layer in the NBRI wind tunnel. Internal report, Pretoria: Council for Scientific and Industrial Research, Building Technology. [ Links ]
Milford, R V, Goliger, A M & Beattie, G L J 1988. Wind tunnel testing for civil engineering applications. The Civil Engineer in South Africa, 30(3): 103-111. [ Links ]
Paluch, M J, Loredo-Souza, A M & Blessmann, J 2003. Wind loads on attached canopies and their effect on the pressure distribution over arch-roof industrial buildings. Journal of Wind Engineering and Industrial Aerodynamics, 91: 975-994. [ Links ]
SANS (South African National Standard) 2011a. SANS 10160-2. Basis of Structural Design and Actions for Buildings and Industrial Structures. Part 2: Self-weight and Imposed Loads. Pretoria: SABS Standards Division. [ Links ]
SANS (South African National Standard) 2011b. SANS 10160-3. Basis of Structural Design and Actions for Buildings and Industrial Structures. Part 3: Wind Actions. Pretoria: SABS Standards Division. [ Links ]
Stathopoulos, T & Baniotopoulos, C C 2007. Wind effects on buildings and design of wind-sensitive structures. Series: CISM International Centre for Mechanical Sciences, Vol 493, New York: Springer Science & Business Media. [ Links ]
Taylor, T J 1992. Wind pressures on a hemispherical dome. Journal of Wind Engineering and Industrial Aerodynamics, 40(2): 199-213. [ Links ]
Toy, N & Tahouri, B 1988. Pressure distributions on semi-cylindrical structures of different geometrical cross-sections. Journal of Wind Engineering and Industrial Aerodynamics, 29: 263-272. [ Links ]
 Correspondence:
R A Bradley
School of Civil and Environmental Engineering
University of the Witwatersrand
Private Bag 3, PO Wits, 2050, South Africa
T +27 11 717 7127, E: ryan.brad ley@wits.ac.za
M Gohnert
School of Civil and Environmental Engineering
University of the Witwatersrand
Private Bag 3, PO Wits, 2050, South Africa
T +27 11 717 7125, E: mitchel l.goh nert@wits.ac.za
A M Goliger
CSIR Built Environment
PO Box 395, Pretoria, 0001, South Africa
T +27 12 841 2472, E: agoliger@csir.co.za
Y Mistry
WSP Parsons Brinckerhoff,
199 Bryanston Drive, WSP House, Bryanston Place, 2191, South Africa
T +27 11 300 6044
E: Yateen.Mistry@WSPGroup.co.za

RYAN BRADLEY, who is an Associate Member of the South African Institution of Civil Engineering, received his BSc (Eng) and MSc (Eng) from the University of the Witwatersrand, Johannesburg, South Africa. He is currently a lecturer (and PhD candidate) inthe School of Civil and Environmental Engineering at this university, where he teaches structural analysis to engineering, architecture and construction management students. His main research interests are related to the analysis, design and construction of unreinforced earth-masonry shells.

PROF MITCH GOHNERT, who is a Fellow of the South African Institution of Civil Engineering, graduated from Brigham Young University, USA, with a BSc in Civil Engineering and a Master's in Engineering Management in 1985 and 1987, respectively. In 1995 he was awarded a PhD in Civil Engineering from the University of the Witwatersrand, Johannesburg, South Africa. He is registered as a Professional Engineer in South Africa and as a Chartered Engineer in the United Kingdom. He is a full professor in structural engineering in the School of Civil and Environmental Engineering at the University ofthe Witwatersrand.

DR ADAM GOLIGER obtained his MSc from Warsaw Technical University, Poland, followed by PhD and DEng degrees from Stellenbosch University, South Africa. Since 1985 he has been involved in research and consulting work at the CSIR, which include wind-tunnel simulation and modelling techniques, statistics of wind and related damage, development of design manuals, and environmental studies around buildings. For several years he served as the South African representative on the International Association for Wind Engineering (IAWE), and served on various local and international committees. He is the author or co-author of more than 80 scientific publications and numerous technical reports.

YATEEN MISTRY graduated from the University of the Witwatersrand with a BSc in Civil Engineering in 2014. He is currently employed at WSP Parsons Brinckerhoff as a Junior Structural Engineer, and is concurrently pursuing a Master's in Structural Engineering in the School of Civil and Environmental Engineering at the University of the Witwatersrand. He was employed at Group Five Engineering at the time of writing this paper.

