


Services on Demand
Article
 English (pdf)
 Article in xml format
 Article references
Indicators

Related links
-
 Cited by Google
 -
 Similars in Google
Share

 Permalink
Journal of the South African Institution of Civil Engineering
On-line version ISSN 2309-8775
Print version ISSN 1021-2019
J. S. Afr. Inst. Civ. Eng. vol.58 n.4 Midrand Dec. 2016
http://dx.doi.org/10.17159/2309-8775/2016/v58n4a1
TECHNICAL PAPER
A comparative evaluation of the impact of average speed enforcement (ASE) on passenger and minibus taxi vehicle drivers on the R61 in South Africa
N A Ebot Eno Akpa; M J Booysen; M Sinclair
ABSTRACT
Average speed enforcement (ASE) is an emergent alternative to instantaneous speed limit enforcement to improve road safety, and is used to enforce an average speed limit over a road segment. This paper presents a study on the response of passenger vehicles and minibus taxis to ASE on the R61 in South Africa. A spatio-temporal quantitative study of speed compliance was conducted, where metrics such as speed variability, average speed and 85th percentile speed measured prior to, and during enforcement, were analysed for two prominent modes of transport - passenger vehicles and minibus taxis. These measurements were taken on the enforcement route and on control routes adjacent to and further away from the enforcement route. A qualitative study was also conducted to evaluate the relationship between speed compliance and driver understanding of the system. The impact of the system on crash risk and injury severity was also examined before and during enforcement. For passenger vehicles, results showed that the introduction of ASE was followed by a reduction in mean speed on the enforcement route and adjacent control route. For minibus taxis, it was found that ASE appears to have little influence on improving speed compliance, which is likely associated with a lack of driver understanding of how the system operates.
Keywords: average speed, enforcement, control, minibus taxi, passenger vehicle, informal public transport
INTRODUCTION
With road transport becoming an increasingly integral part of societal activities in South Africa, and Sub-Saharan Africa in general, the need for efficient road safety measures is growing. The World Health Organisation (WHO 2013) indicates that the African region has only about 2% of the world's registered vehicles, but accounts for almost 20% of global traffic deaths, averaging fatality rates of 24 deaths per 100 000 inhabitants. Speeding is often cited as the leading human factor responsible for these fatalities. Studies have also shown that there is a direct relationship between vehicle speed, crash risk and crash severity (Aarts & Van Schagen 2006). According to South Africa's 2011 road traffic report (RTMC 2011), speeding contributed to about 40% of fatal crashes due to human error. As a result, modern Intelligent Transport System (ITS) safety measures, such as average speed enforcement (ASE), are geared towards regulating human factors, such as speeding, with the ultimate goal of improving safety.
Various countermeasures have been used to reduce speed-related fatalities and injuries in South Africa. While some countermeasures, such as rumble strips and speed humps, are aimed at managing vehicle speeds, other countermeasures, such as instantaneous speed cameras, are aimed at enforcing compliance with posted speed limits. However, these countermeasures are usually only effective around the vicinity of the intervention infrastructure, and most of them are impractical and costly for use over long distances. This paper focuses on ASE implemented through an average speed over distance (ASOD) system deployed on the R61 in South Africa.
The ASE system is a technology that ideally promotes both speed management and compliance with posted speed limits by using camera pairs with automatic number plate recognition (ANPR) functionality, strategically placed along a road section. Licence plates are captured at an initial camera location (the entry cabinet) and also at any subsequent camera location (the exit cabinet). The known distance between both cameras, and the travel time between them, are used to calculate the average speed of the vehicle. A fine is issued if the calculated average speed is higher than the legal speed limit for the vehicle type on the given road. Camera visibility is enhanced through roadside notifications at the entry and exit cabinets.
A number of studies in Australia and Europe have proved the effectiveness of ASE. Most of its effects on crash risk, injury severity and speed violations are undeniably positive. However, these effects may vary from region to region (Sussman 2008). Existing ASE studies have only investigated the enforced road sections, and have largely neglected the effects on adjacent and other control sections. Moreover, research to date has not distinguished between different modes of transport.
Apart from South Africa, there is no documented literature on the implementation of ASE in Sub-Saharan Africa. The majority of countries in Sub-Saharan Africa rely on police patrols, rumble strips and speed humps to control speed (Afukaar 2003). South Africa launched one of its first ASE systems in November 2011 on the R61 - a 71.6 km stretch of road between Beaufort West and Aberdeen in the Western Cape Province. Media reports on the system claim that it has been effective in road safety improvement, a claim apparently substantiated by reported traffic injuries. Evaluating the effectiveness of ASE systems is, however, a relatively new research area in the African context with its unique transport modes and challenges, where ASE systems have been running for less than half a decade. Hence there is still a general lack of a credible body of research on the extent of its effects on speed management in different regions, and the availability of concrete evidence to substantiate its benefits for different modes of transport in those regions.
The minibus taxi industry
The minibus taxi industry is a vibrant and mostly unregulated sector of public transport in South Africa, which has been largely associated with speed-related road fatalities. It is well known that the minibus taxi industry in South Africa constitutes the bulk of public transport and is generally characterised by substandard vehicles, overloading and high-risk driving behaviour, such as speeding and reckless driving (Sukhai et al 2004).
South Africa has at least 150 000 minibus taxis (Arrive Alive 2015) which serve about 67.9% of the public transport market share (Trans-Africa Consortium 2008). According to a study by Trans-Africa (Trans-Africa Consortium 2008), most taxi owners in Sub-Saharan Africa manage to cover their operation costs, but can barely afford to maintain or upgrade their fleets satisfactorily, hence compromising on quality and safety.
Minibus taxis mainly function as vehicles for urban and long-distance transport. The role of minibus taxis in urban transport falls somewhere between that of metered taxis (cabs) and urban buses in the developed world, while long-distance taxis perform a function similar to that of coaches in the developed world. Although the logistics of these two functions (long-distance and urban) are different, the vehicles and drivers involved are the same. It is common for a taxi driver who ferries passengers to work and back from Monday morning to Friday afternoon, to also complete a long-distance route over the weekend (Booysen et al 2013). Details on how the minibus taxi industry conducts long-distance trips are presented in Booysen et al (2013), and Booysen and Ebot Eno Akpa (2014).
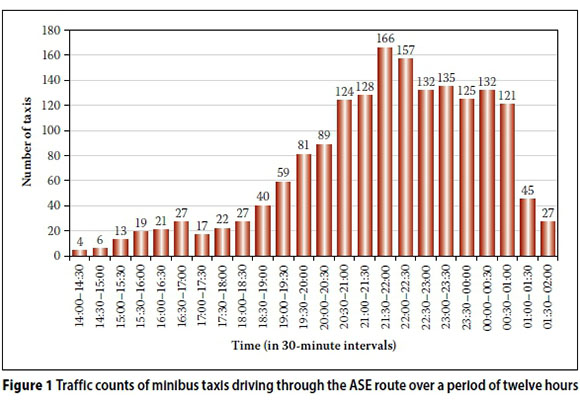
This paper focuses on long-distance transport where most ASE systems are encountered. A typical long-distance route is from Cape Town in the Western Cape Province to Mthatha in the Eastern Cape. The route, along the N1 and R61, is frequently used by minibus taxis over weekends and holiday seasons. Since no official information could be found to confirm the number of minibus taxis that complete the Cape Town to Mthatha route every weekend, a traffic count was performed. Figure 1 shows the number of minibus taxis taking long-distance trips along the N1 over a typical weekend during the festive season. More than 1 700 taxis were identified in twelve hours. From interviews with taxi operators it became clear that the vast majority of long-distance taxis using this stretch of the N1 are bound for the Eastern Cape, with significantly fewer heading to the Free State and Gauteng.
RELATED WORK
ASE systems have been operating in certain regions for over a decade. The first instance was a trial system installed in 1997 in the Netherlands, which ran for five years before permanent installation in 2002. In 2000, England launched its first permanent system after running trial versions for a year. Due to the lack of literature on ASE system studies in Africa, this section summarises research outcomes predominantly carried out in Europe, where the impact of ASE systems has been evaluated in detail.
A number of studies have been conducted to evaluate the impact of ASE on speed and crash rates. Soole et al (2013) compiled a concise literature review of ASE evaluation in Europe. The aim of their research was to monitor compliance with posted speed limits on enforcement routes. They also investigated the effectiveness of ASE systems on driver perception, including comparison with other countermeasures. Previous studies on some enforcement routes revealed that ASE reduced mean and 85th percentile speeds by up to 33%. In addition, speed variations from posted speed limits were reduced, with speeds typically below or at the posted speed limits. Their findings support ASE as a complementary measure to existing speed compliance measures, particularly suitable on roads with historically high crash rates. They nevertheless conclude that ASE systems are a more reliable and cost-effective approach to speed enforcement, and are widely accepted by road users. The main outcomes of evaluation studies reviewed by Soole et al (2013) are presented in the following paragraphs. These studies were conducted in the Netherlands, Italy, and England.
In the Netherlands a study was conducted in 2005 on the A13 in Rotterdam, which had a posted speed limit of 80 km/h.
During enforcement, average speed on the enforcement route reduced to 80 km/h from 100 km/h. Reduction in speed variance and 85th percentile speed was also observed. Moreover, offence rates dropped by 4%, all crashes reduced by 47% and fatalities reduced by 25% (Stefan 2005).
In Italy an evaluation of all enforcement routes was conducted in 2009. Average speeds reduced by 16 km/h (corresponding to a 15% reduction) during the first year of operation. After the first year, average speeds reduced further by 9.1 km/h. Fatalities also reduced by 50.8%, while serious-injury crashes reduced by 34.8%. In 2011, a one-week pre-installation and post-installation comparative study conducted on an 80 km/h road in Naples also showed positive impact. Average speed dropped by 9 km/h and speed variance dropped from 18.1 km/h to 12.1 km/h. For crash outcomes, eight-month pre-installation and post-installation periods were compared. Serious and minor injuries reduced from 116 to 71, while fatal crashes reduced from four to zero (Cascetta & Punzo 2011).
In 2011, a series of evaluations were conducted by relevant stakeholders at 13 locations in England (data was provided by stakeholder consultation). Speed profiles three years before enforcement were compared with speed profiles for three years during enforcement. Posted speed limits of enforcement routes were between 30 mph and 50 mph. The 85th percentile speed dropped by about 14.4% at 11 locations, but increased at one. Average speed reduced by an average of 12.5% at 10 locations, increased at two and remained unchanged at one. The proportion of vehicles travelling above the speed limit reduced by an average of 30%. Across all routes, crashes reduced by an average of 51.6% and casualties reduced by an average of 41.8%.
According to the government of the Western Cape Province in South Africa, ASE systems also have positive effects on speeding (Safely Home 2012). In 2012, a macroscopic evaluation of the system was conducted on the R61 by using only data captured through the ASE system. Prior to enforcement a total of 509 crashes had been reported, 75 of which involved fatalities. The specific time frame before ASE implementation, during which these crashes occurred, was not reported. During enforcement, between November 2011 and November 2012, no fatal crashes were reported. The proportion of vehicles driving above the speed limit of 120 km/h dropped from 39% to 26%, and the percentage of vehicles driving below the speed limit increased from 61% to 74%.
Contribution of this work
Although much research exists for ASE implementations in the developed world, the impact of ITS safety interventions vary from region to region (Sussman 2008). Moreover, to the best of the authors' knowledge, no research exists that considers the impact of ASE on different modes of transport with differentiated speed limits. Furthermore, existing literature on ASE does not evaluate the impact on adjacent road segments, or compare the results with control routes. This paper examines the impact of ASE on speeding patterns (and crash rates) on the R61 in South Africa - a bidirectional single carriageway with no central reservation. The paper evaluates the impact on two prevalent transport modes, namely passenger vehicles and minibus taxis (the dominant forms of private and public transport in Sub-Saharan Africa) with respective speed limits of 120 km/h and 100 km/h on the R61. Time differentiation and spatial differentiation analyses were performed to establish the impact on the ASE route, and also on control routes at various distances from the enforcement route. The paper analyses the behavioural changes observed, or lack thereof, and presents explanations for anomalous effects not seen elsewhere in the literature, including a qualitative study that was motivated by the high violation rates observed from trips completed by minibus taxis (Booysen & Ebot Eno Akpa 2014). Crash outcomes (fatalities, serious and minor injuries) are also analysed on the enforcement route by comparing two years of pre- and postinstallation effects of the ASE system. The investigation transcends macroscopic effects presented by local authorities (Safely Home 2012) to address microscopic effects such as reductions in average speed and speed variability.
EXPERIMENTAL SETUP
Quantitative analysis
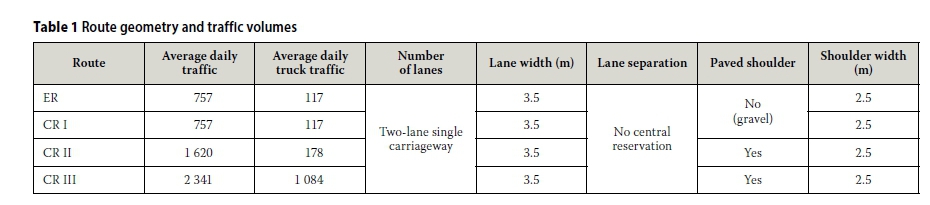
The aim of the quantitative analysis was to investigate the impact of ASE systems on speed limit compliance and crashes for two modes of transport. This section focuses on the compliance, while methods pertaining to the crashes are presented in a subsequent section. To obtain detailed effects on speed compliance, one enforcement route (ER) with an ASE, and three control routes (CR I, CR II, and CR III) without ASE were evaluated. CR I was chosen since it shares similar characteristics with the enforcement route, while CRs II and III were chosen to observe speeding patterns further away from the enforcement route, and were frequently used by passenger vehicles equipped with TomTom devices. Figure 2 shows the enforcement and the control routes, while Table I shows the geometric and traffic characteristics of each route. CR III (between Hanover and Colesberg) is situated 240 km from the ER, north of the N1. Evaluation dates ran from June 2009 to June 2011 before enforcement, and from December 2011 to December 2013 during enforcement. With regard to the state of enforcement on these routes before ASE, it should be noted that there were no permanent ITS interventions, and speed enforcement was carried out exclusively by mobile police units.

Time differentiation was performed on the enforcement and control routes. This involved a 'before' and 'during' enforcement analysis for each route. Results from time differentiation on the enforcement route were expected to show reduction in travel speeds during enforcement. Similar results were also expected of CR I, considering its proximity to the enforcement route, while CR II and CR III was expected to show little or no impact due to enforcement.
Spatial differentiation was also performed with the aim of determining the impact of the system on control routes relative to the enforcement route. This involved 'in' and 'out' of ASE section analysis before and during enforcement. Comparing the enforcement route and CR I, results from spatial differentiation before enforcement were expected to be similar, while results during enforcement were expected to be slightly different. Between the enforcement route and CR II, spatial differentiation results were expected to be similar before implementation, but different after implementation. Similar results were expected between the enforcement route and CR III. It was well understood that, despite these expectations, the riding quality, general traffic patterns of the routes over time, policing, etc, could lead to different results.
Data sets
Two independent data sets were considered for the quantitative study. Firstly, TomTom traffic statistics obtained from tracking devices, TomTom navigation devices and TomTom fleet management devices were used. This data set represented fleet monitoring for passenger vehicles mainly used for private transportation. TomTom devices are uncommon in minibus taxis, since these devices are considered a luxury item.
The second data set was obtained from nine minibus taxis registered under the Stellenbosch/Kayamandi Taxi Association, chosen from a total of fifteen minibus taxis that frequently do long-distance trips from the area. Tracking devices were installed in the taxis, each of which were programmed to provide time stamps, location and speed information at a nominal frequency of 1Hz. A total of 402 trips between Cape Town and the Eastern Cape were obtained between November 2013 and May 2014, these covering a total distance of more than 50 000 km. There was no data for minibus taxis before ASE. Due to this data availability constraint, only spatial differentiation analysis during enforcement was performed for the minibus taxis. In addition, minibus taxis rarely travel along CR III. As a result spatial differentiation analysis was not possible for minibus taxis on CR III.
Data capturing and validation, with further analysis
Although the tracking devices were programmed at a minimum transmission frequency of 1Hz, not all consecutive records were captured at this frequency, due to filtering and data loss. Despite the accuracy of the GPS as a measurement device, it is still subject to systematic and random errors, which could be out by as much as 15 m per sample (Gates et al 2004). The reasons for this include the following:
■ Systematic errors that affect accuracy may occur due to a low number of satellites in view, a high horizontal dilution of precision (HDOP) which relates to satellite orientation on the horizon and its impact on position precision, and other factors such as poor antenna placement.
■ Random errors may occur due to signal blockage, atmospheric effects, multipath signal reflection, satellite orbit, and other factors such as receiver defects.
Systematic error effects were minimised by removing GPS records with less than five satellites in view and HDOPs greater than one. On the other hand, the effects of random error were difficult to address. Statistical smoothing techniques or visual inspection of data can be used to identify random errors (Jun et al 2006). Polygons surrounding each route were used to minimise the effects of random error. Only records within the polygons were used.
To validate the minibus tracking data, average speeds captured by the ASE system were compared with average speeds calculated from the GPS traces. The ASE system's speeds were obtained from twelve fines levied on minibus taxi drivers between December 2013 and March 2014. Time
stamps on each fine, with their corresponding average speeds, were mapped against GPS-calculated average speeds with the same time stamps. A maximum percentage error of 0.85% was measured between ASE and GPS average speeds. Two GPS reference records closest to the entry and exit cabinets respectively were selected from the list of GPS records defining a trip. For each trip, a 2 km radius was defined around each camera to minimise wide variations in the location of reference records. Trips with no GPS records in the specified radius were excluded from the analysis. This ensured a maximum deviation of 4 km in travel distance from the fixed travel distance of 71.6 km. The GPS average speed for each trip was calculated using the known distance and travel time between the reference records.
Average speeds calculated from reference records were also used to conduct further analyses on minibus taxis. These were used to detect if a given trip violated the ASE system. The 402 valid trips through the enforcement route were identified and analysed. Each taxi was examined separately.
Crash risk and injury severity
High crash rates on a particular road are often the reason behind ASE system deployment. Reduction in crash rates due to ASE rest on the assumption that their effect on vehicle speed is equally worthwhile. It is therefore necessary to investigate their impact on crash rates. To this end, crash data within the enforcement route between January 2008 and September 2014 was provided for analysis by the Western Cape Department of Transport. Time-based analysis around the enforcement date of November 2011 was applied with pre-implementation and post-implementation periods of two years. The analysis was conducted for minibus taxis and passenger vehicles for crashes primarily linked to human error due to speeding.
Qualitative analysis
Although the trips in the study were captured from nine vehicles, multiple taxi drivers were involved, as more than one taxi driver is employed to drive each vehicle. In all, a total of 20 minibus taxi drivers were interviewed to determine their level of understanding of ASE. Only those drivers who frequently drive through the R61 enforcement routes between Cape Town and the Eastern Cape Province were interviewed. Based on their understanding of ASE, taxi drivers were grouped into three categories. The first category represented drivers who understood how the ASE system operates and where it had been deployed along the route. The second category represented drivers who understood how the system operates, but were unaware of its location along the route. The third category represented drivers who neither understood how the system operates nor where it had been deployed along the route.
RESULTS
Speed compliance results
More than 6 000 vehicles were identified from TomTom traffic queries making complete trips through the respective evaluation routes in the time frames considered. For minibus taxis, 402 trips identified from GPS records were analysed.
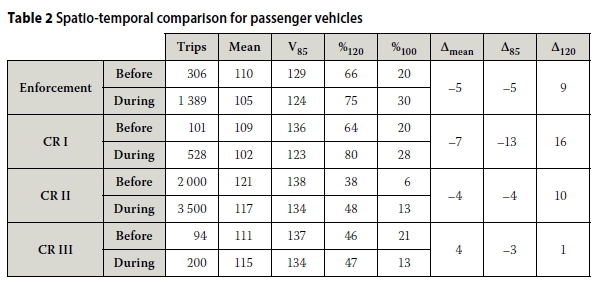
The results are presented in Figures 3 and 4, and Tables 2, 3 and 4, in which represents the 85th percentile speed, and %120 represents the percentile crossing at 120 km/h. In Table 2, delta (Δ) represents differences between 'during' and 'before' implementation parameters, while in Table 3 it represents differences between control and enforcement route parameters.
Passenger vehicles
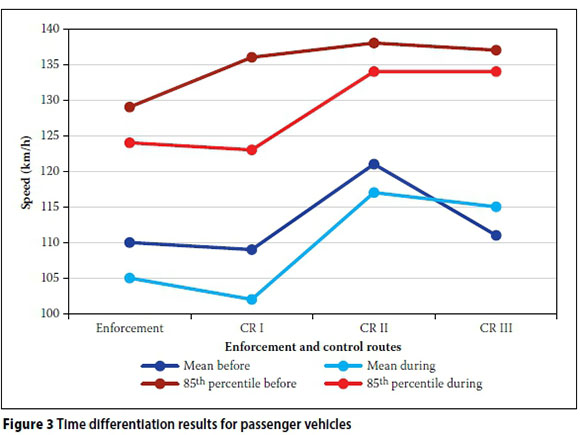
The time differentiation results for passenger vehicles, illustrated in Figure 3 and Table 2, show a reduction of 5 km/h in both the mean speed (to 105 km/h) and 85th percentile speed (to 124 km/h) on the ER, and a change from 66% to 75% in speed limit compliance (similar to the Safely Home and other results mentioned in the "Related Work" section above), which suggests that more time was spent driving below the legal speed limit on the enforcement route. However, these changes are not limited to the enforcement route, with an even greater improvement apparent in the adjacent CR I - here mean speed reduced by 7 km/h and the 85th percentile speed reduced by 13 km/h, corresponding to a 10% reduction. Interestingly the 85th percentile of CR I was 7 km/h higher than that of the ER before ASE, at 136 km/h, and reduced to within 1 km/h after introduction of ASE. A 4 km/h improvement is also noticeable in the 85th percentile speed of CR II, but to a relatively high 134 km/h, with a similar trend on the mean speeds for CR II. Although the 85th percentile for CR III improved by 3 km/h, the mean speed was 4 km/h higher. These results indicate an improvement after introduction of the ASE, but similar improvements in the adjacent and farther away control sections.
Moreover, these improvements on the ER and CR I occurred despite the fact that their speed profiles before enforcement were already significantly lower than those of CR II and III.
Together with Table 3, Figure 3 also gives insight into spatial differentiation results. During enforcement, the ER and CR I had similar mean and percentile speed profiles. CR II and CR III also had similar profiles. At any given percentile, speed margins between the enforcement route and CR I to CR II and CR III were about 10 km/h. Before enforcement, however, these margins were lower and inconsistent, suggesting a higher degree of similarity and the absence of average speed-related enforcement. Coupled with observations from time differentiation results, it was observed that the ASE system appeared to have influenced passenger vehicle drivers to comply with speed limits along the enforcement route and on CR I, but not on control routes further away, such as CR II and CR III.
Two concerns arise from the time and spatial differentiation results. Firstly, between the enforcement route and CR I, it was observed that during enforcement CR I showed a slightly better level of compliance with the speed limit. Its mean and 85th percentile speeds were 3.6 km/h and 1 km/h lower than that of the enforcement route respectively. Speed profiles on CR I were expected to improve, but not to the point where they would be better than the enforcement route. This unexpected result may be due to routine maintenance during the enforcement period on CR I. During maintenance, which typically lasts for two months in a year, speed restrictions are set at 100 km/h, with occasional Stop/Go closure delays (SANRAL 2011; SANRAL 2013). The second point of concern is that CR II and III unexpectedly also showed slight reduction in speeds. This could be due to road safety campaigns carried out across the country on roads with high death tolls. Following this trend, factors responsible for this could to some extent be responsible for reduction in speeds along the enforcement route, which may have nothing to do with the ASE system. Nevertheless, the reduction in speed along the enforcement route was better than that on CR II and III, and was in line with the results mentioned in the "Related Work" section above (all of which did not consider control sections), suggesting that the ASE system has a measurable effect.
Passenger vehicles and minibus taxis
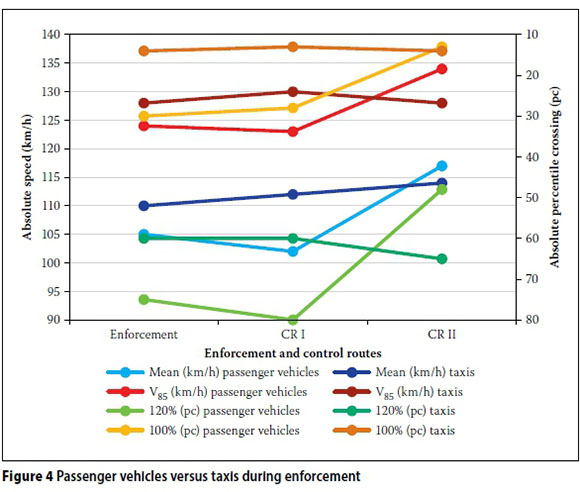
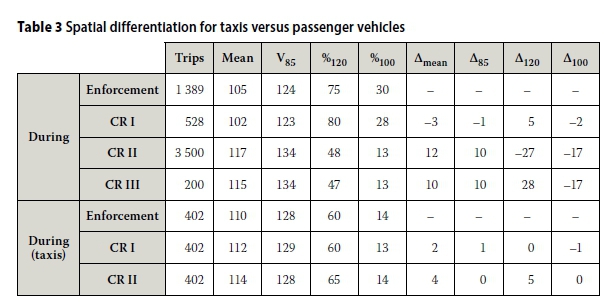
The spatial differentiation results after introduction of ASE are presented in Figure 4 and Table 3, for both passenger vehicles and minibus taxis. Percentiles in Table 3 show that only about 14% of all recorded taxi speeds were within their legal speed limit of 100 km/h. Furthermore, besides lower variations in speed, their speed profiles were very similar to, or higher than, those of passenger vehicles. This finding conforms to a previous study (Booysen & Ebot Eno Akpa 2014), which presents similar results for three other road sections.
The passenger vehicles generally showed rising mean and 85th percentile speeds (+12 and +10 km/h respectively), and falling percentiles for the 100 km/h and 120 km/h crossings (-17 and -27 percentage points respectively), from ER to CR II. Conversely, the minibus taxis exhibited an increase in mean speed of only 4 km/h and no change in 85th percentile crossing. Similarly, for the minibus taxis the 120 km/h crossing was at 5 percentage points higher, and no change for the 100 km/h crossing. These results support the hypothesis that the ASE has an impact on drivers of normal passenger vehicles, but suggest further that there is no significant change for minibus taxis in the ASE section.
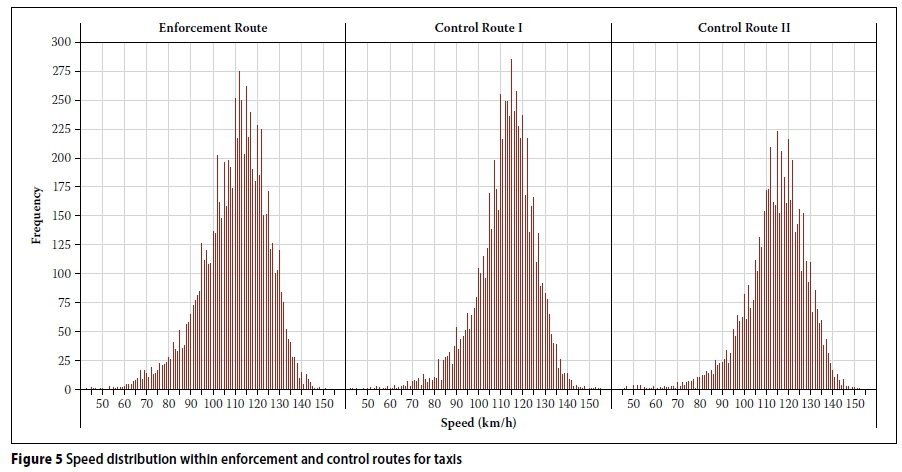
Figure 5, which shows speed distribution plots on all routes, also confirms this finding - mean speeds were at 110 km/h on the enforcement route, 112 km/h on CR I and 114 km/h on CR II. Standard deviations were at 14.7 km/h on the ER, 13.1 km/h on CR I, and 13.7 km/h on CR II. From these results, it appears that minibus taxis were not influenced by the presence of ASE along the R61 at all. Also, the similarity between minibus taxi speeds during enforcement and passenger vehicle speeds before enforcement along the ER and CR I is an indication that time differentiation analysis on minibus taxis showed little or no significant change.
Further investigation on minibus taxis
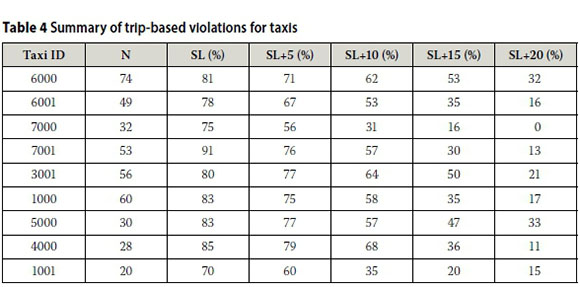
Investigations of individual trips along the enforcement route were conducted for each taxi. Table 4, which is a summary of system violations detected from GPS data, shows that most drivers did not conform to the 100 km/h limit. Results are expressed as the percentage of trips with an average speed beyond a specified threshold. Thresholds start at the 100 km/h speed limit and end at 120 km/h, with 5 km/h increments. N denotes the number of trips completed through the ASE system, and SL denotes the speed limit of 100 km/h.
For average speed, results show that at least 70% of trips taken by each taxi violated their 100 km/h speed limit, and for some taxis close to 34% of their trips violated the 120 km/h speed limit of passenger vehicles. While these results show that ASE has little or no impact on minibus taxis, they also support previous findings (Bester & Marais 2012) on the imprac-ticality and enforcement difficulties associated with differentiated speed limits. Interviews with the taxi drivers revealed that, although they are all aware of the 100 km/h speed limit, they nevertheless consider 120 km/h as the limit that governs their choice of speed.
Effect on crash risk and injury severity
It is well known that speeding increases the risk of crash occurrence and severity. However, the specific cause of a crash may be due to several human factors, and not exclusively due to speeding. The data used in this study classified crashes based on their specific causes, none of which were attributed to speeding. As a result, statistics presented here only refer to crashes with specific causes linked to driver error/negligence.
Comparing two years before enforcement to two years during enforcement on the enforcement route, all crashes increased by 9.6% (from 83 to 91). Despite the increase in reported crashes, fatalities reduced by 79.5% (from 39 to 8), serious injuries reduced by 58.5% (from 53 to 22) and minor injuries reduced by 50% (from 106 to 53). Crash severity involving the two vehicle types considered in this study were queried separately, and the results are shown in Figure 6.
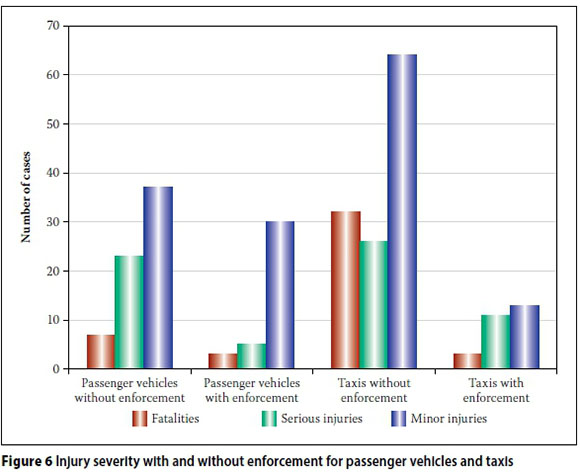
For passenger vehicles, the number of reported crashes decreased by 2% (from 49 to 48). Fatalities reduced by 57.1%, serious injuries reduced by 78.3%, and minor injuries reduced by 18.9%. For minibus taxis, the number of reported crashes increased by 38.1% (from 21 to 29). Nevertheless, a notable decrease in severity was observed - fatalities reduced by 90.6%, serious injuries reduced by 57.7% and minor injuries reduced by 79.7%. From these results it is probable that ASE had a significant role to play in crash severity, considering the reduction in mean speed during enforcement, and the known proportionality between speed and crash severity. However, it should be noted that the fatality results presented were measured over a fixed period of time. As such, effects due to regression-to-the-mean in road accident data were not taken into consideration. While results show that the deployment of the ASE system was effective, subsequent measurements may reveal different statistics which are not necessarily or solely linked to the ASE system.
Driver perception and awareness
This section presents outcomes of the survey related to ASE systems. Twenty drivers who regularly travel along the R61 were interviewed. All drivers were aware of their legal speed limit of 100 km/h and of the location of speed cameras along the route. Eighty percent of the drivers claimed that the presence of cameras caused them to adhere to speed limits within the vicinity of the camera, while 20% claimed not to be influenced by the presence of cameras, because they usually adhered to speed limits. Drivers were then asked if they understood how ASE systems work. Only two (10%) of the twenty drivers understood the concept of ASE and knew how ASE systems operate. The drivers who understood how the system operates also knew where it was deployed along the road. Eighteen drivers (90%) neither knew about the deployment of such a system nor how it worked. Four of these eighteen drivers admitted that they were advised by traffic officers to spend more than a minimum travel time on the road, below which they will get fined. These drivers were nevertheless placed in the third category of oblivious drivers since they neither understood how the system works nor knew the enforcement sections.
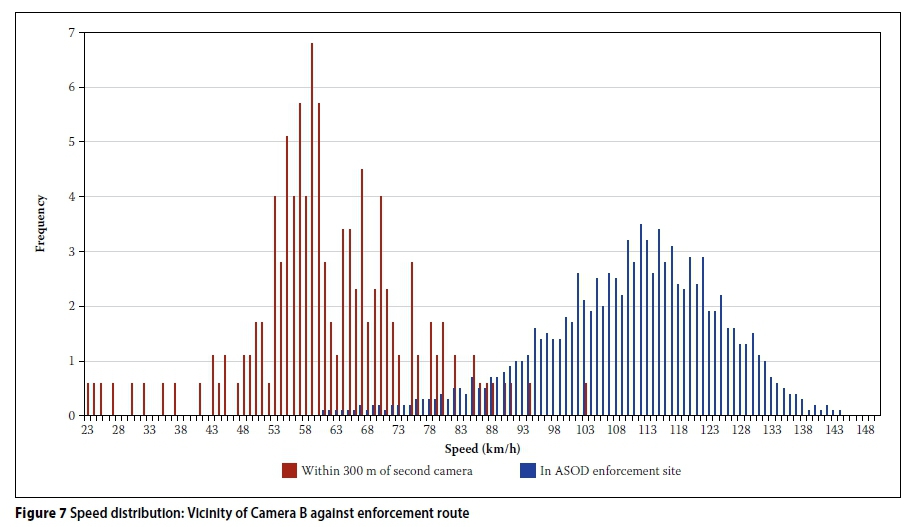
The high percentage of ASE unawareness suggests that cameras at the beginning and end of the enforcement section were viewed as instantaneous speed cameras, which measure instantaneous speed just in the vicinity of the camera, and not over a longer distance. This was verified by examining taxi GPS speeds within three hundred metres of Camera B (camera between Beaufort West and Aberdeen). Camera A (just outside Beaufort West) was not included in this analysis due to comparatively low speeds which can be attributed to its proximity to residential areas. Figure 7 shows normalised results for the speed distribution within 300 m of Camera B against the speed distribution on the enforcement route. The mean speed within 300 m of Camera B was 60 km/h, which is 50 km/h less than the mean speed on the enforcement route, despite no noticeable differences in the road condition. Moreover, in the vicinity of Camera B, over 95% of speed records were below the 100 km/h speed limit. Thus, despite the proven advantage of ASE systems to improve speed uniformity along enforcement routes (Soole et al 2013), most trips completed by minibus taxis proved otherwise, due to an apparent misunderstanding of average speed enforcement.
DISCUSSION
Average speed enforcement along the R61 is currently the primary intervention to counter speeding between Beaufort West and Aberdeen. Questions may arise as to whether improvements in speed compliance of passenger vehicles should be attributed to the system. Answers to these questions are especially relevant since a net decrease in overall speed was observed not only on the enforcement route, but on the control routes as well, although by varying degrees. It should be noted that high death tolls on provincial routes before enforcement have led to the systematic intensification of existing countermeasures and the launching of road safety campaigns during the enforcement period, which may have directly influenced speed compliance. However, this is impossible to quantify. Ad hoc police patrols were the most common countermeasure on this route before ASE. Despite these patrols, mean speeds and 85th percentile speeds were high before ASE, coupled with high crash rates and injury severity. Evidence of the impact of the ASE system can be seen from the fact that, during enforcement, speed compliance on the enforcement route is better than compliance on CR II with a lower 120 km/h percentile and a mean only 3 km/h lower than the speed limit. Also, despite the complementary nature of the ASE system amidst other countermeas-ures, the fact that these changes occur during enforcement indicate that the system could be actively responsible for speed compliance.
The main advantage of ASE over other countermeasures is the reduction in mean speed, 85th percentile speed and low speed variability over long distances. As with other countermeasures, it is also associated with a reduction in crash rates and injury severity.
According to Elvik et al (2009), studies that evaluate the effects of road safety measures by only relying on measures that influence driver behaviour, rather than crash rates or injuries, have less of an impact for two reasons. Firstly, for many forms of behaviour their relationship with crash occurrence is unknown, and secondly, the ultimate objective of all road safety measures is to reduce the expected number of crashes or injury severity. On the other hand, behavioural studies become more relevant when specific causes need to be identified or verified. For passenger vehicles, improvement in speed compliance is depicted by a corresponding decrease in crash rates and injury severity. With the introduction of the ASE system, its combined effect with other counter-measures along the enforcement route has led to a decrease in fatalities and injury severity for both passenger vehicles and minibus taxis.
While it has been assumed that ASE is primarily responsible for the significant improvements on the enforcement route and CR I, two observations undermine this explanation. Firstly, with regard to mean and 85th percentile speeds, CR I performs better than the enforcement route. Secondly, before ASE implementation, mean speeds on the enforcement route and CR I were already lower than the legal speed limit of 120 km/h. From previous ASE evaluations, it was observed that such systems reduced speeds, causing drivers to drive around the enforced speed limit. As a result, reductions in speed observed for passenger vehicles on the enforcement route and CR I could be due to a higher visibility of police enforcement and awareness campaigns during enforcement.
From this study, it is also observed that the two different modes of transport respond differently to existing countermeasures for several reasons. While passenger vehicles complied more closely with speed limits, the sample of minibus taxis did not. The number of reported crashes increased for minibus taxis over this time, although the number of fatalities and injury severity decreased for both modes of transport. This suggests that the presence of ASE may not influence driver behaviour for all modes of transport as expected, but could still lead to a reduction in crash severity and fatalities, as the speed differential of traffic is reduced. The discrepancy in speed compliance between passenger vehicles and minibus taxis shows that generalisation of the outcomes of road safety measures for all modes of transportation could be misleading. Although countermeasures appear to be effective, some vehicle types may be under-represented in the overall results. Poor speed compliance from minibus taxis could be attributed to the frequency at which they travel the route. Each taxi in this study travels along this route at least twice a month, while most passenger vehicles might travel along this route only twice in a year. The effect of travel frequency still needs to be investigated. However, this should not affect the effectiveness of the ASE system, which is an automated system. Another reason for poor compliance could be the impracticality and difficulty associated with differentiated speed limits (Bester & Marais 2012), which restrict minibus taxis to a speed limit 20 km/h lower than passenger vehicles on the same route. From the results, these difficulties may not be the main reason for non-compliance, since some taxis have offence rates of over 30% even with average speeds above 120 km/h along the enforcement route.
It is possible that the poor speed compliance from minibus taxi drivers is related to their low level of understanding of how ASE systems operate. The nature of their job -which requires that they arrive at certain times irrespective of when they depart - is another factor. Other reasons could include ineffective enforcement regimes which fail to prosecute all motorists, or failure of the ANPR cameras in detecting vehicles altogether. Investigation of these reasons was beyond the scope of this paper, and is reserved for future work. This study shows that very few taxi drivers understand the concept of average speed enforcement. Speed distributions show that taxi drivers drive normally on the enforcement route, but slow down within a few metres from the cameras. If taxi drivers were educated on how safety measures such as ASE systems operate, this could improve safety and compliance levels.
CONCLUSION
General effects of ASE on road safety were already evident from reports of low crash rates and fatalities from local authorities. This study supplements these reports with driver behavioural patterns obtained from speed measurements. In summary, the introduction of ASE along the R61 coincided with reduced passenger vehicle speed and crash rates on the enforcement route and its immediate vicinity, but concrete evidence as to whether these reductions can be primarily attributed to ASE is still uncertain. Also, a lack of understanding of how ASE operates can greatly limit its benefits for different transport modes. With separate analyses conducted for each mode of transport, minibus taxi drivers were identified as habitual offenders of the system, exceeding their speed limit often, and having similar speed profiles on the enforcement route, its immediate vicinity, and beyond. Such unsafe driving behaviour on the enforcement route could potentially be mitigated by educating taxi drivers on how the system operates, since they displayed extremely low levels of understanding.
ACKNOWLEDGEMENTS
The authors would like to acknowledge MTN, MiX Telematics and TomTom for their financial and technical support.
REFERENCES
Aarts, L & Van Schagen, I 2006. Driving speed and the risk of road crashes: A review. Accident Analysis & Prevention, 38(2): 215-224. [ Links ]
Afukaar, F K 2003. Speed control in developing countries: Issues, challenges and opportunities in reducing road traffic injuries. Injury Control and Safety Promotion, 10(1-2): 77-81. [ Links ]
Arrive Alive 2015. Minibus taxis and road safety. Available at: http://www.arrivealive.co.za [accessed on 31 January 2015]. [ Links ]
Bester, C J & Marais, M S 2012. Differentiated speed limits that will work. Paper presented at the 31st Southern African Transport Conference (SATC 2012), Pretoria. [ Links ]
Booysen, M J, Andersen, S J & Zeeman, A S 2013. Informal public transport in sub-Saharan Africa as a vessel for novel intelligent transport systems. Paper presented at the 16th International IEEE Conference on Intelligent Transportation Systems (ITSC 2013), 6 -9 October, The Hague, Netherlands. [ Links ]
Booysen, M J & Ebot Eno Akpa, N A 2014. Minibus driving behaviour on the Cape Town to Mthatha route. Paper presented at the 33rd Southern African Transport Conference (SATC 2014), -10 July, Pretoria. [ Links ]
Cascetta, E & Punzo, V 2011. Impact on vehicle speeds and pollutant emissions of an automated section speed enforcement system on the Naples urban motorway. Proceedings, TRB 89th Annual Meeting, Vol 17, Washington, DC. [ Links ]
Elvik, R, Vaa, T, Erke, A & Sorensen, M (Eds) 2009. The handbook of road safety measures. Bingley, UK: Emerald Group Publishing, 18-21. [ Links ]
Gates, T J, Schrock, S D & Bonneson, J A 2004. Comparison of portable speed measurement devices. Transportation Research Record: Journalof the Transportation Research Board, 1870(1): 139-146. [ Links ]
Jun, J, Guensler, R & Ogle, J H 2006. Smoothing methods to minimize impact of Global Positioning System random error on travel distance, speed, and acceleration profile estimates. Transportation Research Record: Journal of the Transportation Research Board, 1972(1): 141-150. [ Links ]
RTMC (Road Traffic Management Corporation) 2011. Road traffic report - 31 March 2011, Pretoria: RTMC. [ Links ]
Safely Home 2012. Launch of average speed enforcement technology: Western Cape Government. Available at: http://www.safelyhome.westerncape.gov.za/campaigns/818 [accessed on 31 January 2015]. [ Links ]
SANRAL (South African National Roads Agency Limited) 2011. Road conditions report: April 2011. Available at: http://www.nra.co.za/content/Roads_Conditions_Report_April_2011.pdf [accessed on 20 February 2015]. [ Links ]
SANRAL (South African National Roads Agency Limited) 2013. Road conditions report: September 2013. Available at: http://www.nra.co.za/content/Roads_Condition_report_2013.pdf [accessed on 20 February 2015]. [ Links ]
SANRAL (South African National Roads Agency Limited) 2013. Road conditions report: December 2013 and January 2014. Available at: http://www.sanral.ensight-cdn.com/content/Roads_Condition_report_December_2013_January_2014.pdf [accessed on 20 February 2015]. [ Links ]
Soole, D W, Watson, B C & Fleiter, J J 2013. Effects of average speed enforcement on speed compliance and crashes: A review of the literature. Accident Analysis & Prevention, 54, 46-56. [ Links ]
Stefan, C 2005. Automatic speed enforcement on the A13 Motorway (NL): Rosebud WP4-Case B Report. Austrian Road Safety Board (KfV). [ Links ]
Sussman, J S 2008. Perspectives on intelligent transportation systems (ITS). New York: Springer Science & Business Media. [ Links ]
Sukhai, A, Noah, M & Prinsloo, M 2004 Road traffic injury in South Africa: An epidemiological overview for 2001. In: Suffla, S. & Van Niekerk, A. (Eds), Crime, violence and injury prevention in South Africa: Developments and challenges. Tygerberg: Medical Research Council-University of South Africa, 114-127. [ Links ]
Trans-Africa Consortium 2008. Overview of public transport in sub-Saharan Africa. TransAfrica project. Brussels: UITP. [ Links ]
WHO (World Health Organization) 2013. WHO global status report on road safety 2013: Supporting a decade of action. Geneva: World Health Organization. [ Links ]
 Correspondence:
N A Ebot Eno Akpa
VASTech, Octo Place Block C,
5 Electron Street, Technopark,
Stellenbosch, 7600
South Africa
T: +27 21 880 9800
E: akokuenow@gmail.com
M J Booysen
Department of Electrical and Electronic Engineering
Stellenbosch University
Private Bag X1
Matieland
7602
T: +27 21 808 4013
E: mjbooysen@sun.ac.za
M Sinclair
Department of Civil Engineering
Stellenbosch University
Private Bag X1
Matieland
7602
T: +27 21 808 3838
E: msinclair@sun.ac.za

NELSON AKOKU EBOT ENO AKPA obtained a Master's in Electrical Engineering (cum laude) from Stellenbosch University, South Africa, in 2015. His research was on mobile-based Intelligent Transport Systems interventions, with a particular focus on the informal public transport sector. He obtained his BEng degree in 2014 from the same university.

PROF THINUS BOOYSEN is a Professor in the Department of Electrical and Electronic Engineering at Stellenbosch University, South Africa. He is a Member of the Institution of Engineering Technology, and a Chartered Engineer (UK). He has ten years' experience in the aerospace and automotive industries with companies which include SunSpace, Rolls-Royce, Boeing, BMW and Jaguar Land Rover. He has been at Stellenbosch University since 2009 where his research focus areas include Intelligent Transport Systems - specifically its application in the informal public transport industry in Sub-Saharan Africa.

PROF MARION SINCLAIR is an Associate Professor of Traffic Engineering and Road Safety within the Department of Civil Engineering at Stellenbosch University, South Africa. Prof Sinclair has spent the past fourteen years working on road safety - specifically the relationship between road user behaviour and the physical, social and political contexts in which driving occurs. She has managed and implemented a range of road safety initiatives in the United Kingdom, and for the past six years has been leading the teaching and research of road safety within Stellenbosch University.

