


Services on Demand
Article
 English (pdf)
 Article in xml format
 Article references
Indicators

Related links
-
 Cited by Google
 -
 Similars in Google
Share

 Permalink
Journal of the South African Institution of Civil Engineering
On-line version ISSN 2309-8775
Print version ISSN 1021-2019
J. S. Afr. Inst. Civ. Eng. vol.58 n.2 Midrand Jun. 2016
http://dx.doi.org/10.17159/2309-8775/2016/v58n2a6
TECHNICAL NOTE
Stormwater pond metals and solids removal efficiency determination with the effluent probability method: A novel classification system
I C Brink; W Kamish
ABSTRACT
This technical note contains findings from a larger research project into the design of stormwater detention and retention ponds for removal of metals and solids. The project required a standard system with which case studies obtained from the International Stormwater BMP Database could be compared in terms of efficiency. A novel classification system for use with the Effluent Probability Method, designed for this purpose, was developed and is presented here.
Keywords: standard classification system, stormwater pond, metals removal
INTRODUCTION
This technical note presents information on the development and application of a classification system for use as a supplement to the Effluent Probability Method (EPM). It is part of a larger project into the determination of links between stormwater pond efficiency, in terms of metals and solids removal, and design. It became apparent during the course of the project that a scheme that enabled the comparison of case studies in terms of efficiency was required. A literature search yielded no such system, necessitating the development of the classification system presented here.
The definition of stormwater pond efficiency used in this paper was adopted from literature provided by the United States of America Environmental Protection Agency (USEPA) and reads as follows: "Efficiency is a measure of how well a BMP (read Best Management Practice) or BMP system removes pollutants" (Geosyntech Consultants et al 1999). In this paper, the term "efficiency" refers specifically to how well a stormwater pond removes metals and solids.
The Effluent Probability Method (EPM) has been used in a number of studies to determine stormwater structure substance removal efficiencies, e.g. Chen et al (2009), Geosyntech Consultants Inc & Wright Water Engineers Inc (2011), and Fassman (2012). The findings of Chen et al (2009) and Geosyntech Consultants Inc & Wright Water Engineers Inc (2011) are limited to graphical comparisons of influent and effluent data for specific substances with cumulative frequency plots. The findings of Fassman (2012) are limited to categorical (swales, wetlands, etc) graphical comparisons of substance effluent event mean concentrations.
These studies illuminate a shortcoming of the EPM, namely that efficiency of specific structures can only be subjectively quoted, simply as "more or less efficient" in relation to other structures, with no scheme to suggest how "efficient" or "inefficient" a structure is.
THE EFFLUENT PROBABILITY METHOD
The EPM provides a statistical view of influent and effluent quality and was recommended by GeoSyntec Consultants & Wright Water Engineers (2009) under support from inter alia the Water Environment Research Foundation (WERF), the United States Environmental Protection Agency (USEPA) and the American Society of Civil Engineers (ASCE).
This methodology broadly comprises the following steps:
1. Determine whether a BMP is providing treatment by calculating statistical significance at 95% confidence level between influent and effluent values.
2. Examine a cumulative distribution function or standard parallel probability plot of influent and effluent quality. (GeoSyntec Consultants & Wright Water Engineers 2009)
The advantages of the EPM are: (1) it is easy to apply, and (2) it provides a clear picture of the effluent vs influent water quality.
Shortcomings of the method are:
1. The measure of statistical significance is only a measure that proves/disproves the null hypothesis that the influent and effluent data medians are equal at a pre-defined significance level. It cannot prove that influent concentration has some impact on effluent concentration.
2. Graphical displays of data provide only a sense of pond performance. Personal judgement must be used to conclude whether a pond performs well or poorly in relation to other ponds.
Cumulative distribution functions (CDFs) can be approximated by cumulative frequency plots (CFPs) (GeoSyntec Consultants & Wright Water Engineers 2009). CFPs are variations of histograms, in which the height of each bar represents the total number of observations that are less than or equal to the upper limit of the bin (Montgomery & Runger 2003). These graphs are useful in pond efficiency evaluations, because they can indicate variations in pond efficiencies over inflow/outflow data ranges. The establishment of pond efficiencies for comparative purposes in this project did not require the establishment of theoretical distributions. Normality of datasets was established through the use of normal probability plots in order to inform the choice between statistical tests. Therefore, the sample approximations of the cumulative distribution functions, i.e. CFPs, were deemed adequate for the graphical representations of data.
The use of statistical significance is controversial and has been criticised. Dickson and Baird (2011) stated that, although statistical significance testing has become the standard in many scientific explorations, the assumption that a significant difference is due to some causal relationship is currently "more an article of faith than a well-established principle". On the choice of the significance level, Dickson & Baird (2011) stated that the choice of significance level is in itself statistically insignificant, is arbitrary and unbased in theory. Statistical significance should therefore be used with cognisance of the criticisms raised against it. The EPM reduces the chance of drawing incorrect conclusions from the p-value by coupling its interpretation with that of graphical displays of data.
CLASSIFICATION SYSTEM DEVELOPMENT
Statistical significance testing
Data was obtained from the International Stormwater BMP Database, v.07.07.11, available on www.bmpdatabase.org. Normality test results indicated that normality could not be assumed in many datasets, and that difference values between inflow and outflow data were generally non-symmetrical. The Sign test was therefore chosen for use. It has been considered by Dixon and Mood (1946) to be most useful when (1) there are pairs of observations on the two things being compared, (2) each of the two observations of a given pair arose under similar conditions, and (3) the different pairs were observed under different conditions. This condition generally makes the t-test invalid. These conditions were suited for use with the data of this project where (1) pond inflow and outflow data could be seen as pairs, (2) the inflow and outflow data arose under the same storm and runoff conditions, and (3) different storm inflow and outflow data pairs arose under different storms and different runoff conditions.
The software program STATISTICA v.10 (Copyright© StatSoft Inc 1984-2011) was used for all calculations. Statistical significance between inflow and outflow data was accepted at p < 0.05. A table published by Dixon (1953) (Table 1, p 468) was used to estimate power.
Cumulative Frequency Plots (CFPs)
Graphical observations were limited to visual categorisation of graphical behaviour according to plot point and regression line proximity. STATISTICA v.10 (Copyright© StatSoft Inc 1984-2011) was used to generate CFPs for all datasets. The Lowess smoothing method was used for the generation of regression lines.
Classification of pond efficiencies
Relationships between in/out CFPs resulted in the categorisation of general pond efficiencies into two basic observational types. Additional consideration of statistical significance results led to the establishment of five different behavioural types (BTs), shown in Table 1.
The behavioural types of pond efficiencies were classified as follows:
1. BT1 - Generally unresponsive efficiency: Pond efficiencies were classified as generally unresponsive in cases where in/ out data points and regression lines in the CFPs were coincidental, closely adjacent and/or intersected along the majority of the data range. A statistically significant result for the dataset was not held to negate this classification. This is because the Sign test results indicated significant differences (below a certain arbitrarily chosen p-value) between medians and could not prove or disprove efficiency on its own. Therefore, visual interpretation of graphical displays of data trumped the results of the Sign test in this case.
2. BT2 - Significantly positive efficiency: Pond efficiencies were classified as significantly positive when (a) in/out data points and regression lines on the CFPs were generally positive, non-coincidental and distant in the majority of the data range, and (b) the Sign test gave a statistically significant result for paired inflow and outflow datasets.
3. BT3 - Significantly negative efficiency: Pond efficiencies were classified as significantly negative when: (a) in/out data points and regression lines on the CFPs were generally negative, non-coincidental and distant in the majority of the data range, and (b) the Sign test gave a statistically significant result for paired inflow and outflow datasets.
4. BT4 - Not significantly positive efficiency: Pond efficiencies were classified as not significantly positive when: (a) in/ out data points and regression lines on the CFPs were generally positive, non-coincidental and distant in the majority of the data range, and (b) the Sign test did not give a statistically significant result for paired inflow and outflow datasets.
5. BT5 - Not significantly negative efficiency: Pond efficiencies were classified as not significantly negative when: (a) in/ out data points and regression lines on the CFPs were generally negative, non-coincidental and distant in the majority of the data range, and (b) the Sign test did not give a statistically significant result for paired inflow and outflow datasets.
EXAMPLES
The results of four case studies are presented to provide examples to illustrate the use of the classification system. Examples were specifically chosen to illustrate the different classification types.
Sign test results
P-values for the selected case studies are shown in Table 2 (p 50). Results were deemed to be statistically significant at p < 0.05.
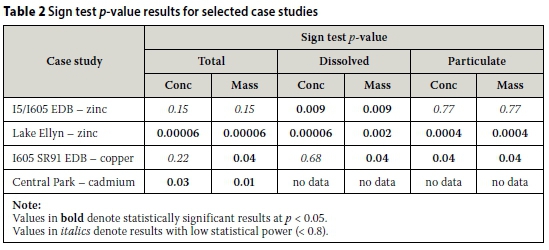
The power of the sign test was low (< 0.8) for (1) the I5/I605 EDB total and particulate zinc concentration and mass, and (2) the I605 SR91 EDB total and dissolved copper concentration datasets. The power of the Sign test can be greatly influenced by sample size (see Dixon 1953) and it is therefore possible that these cases might have produced statistically significant results if larger sample sizes had been available.
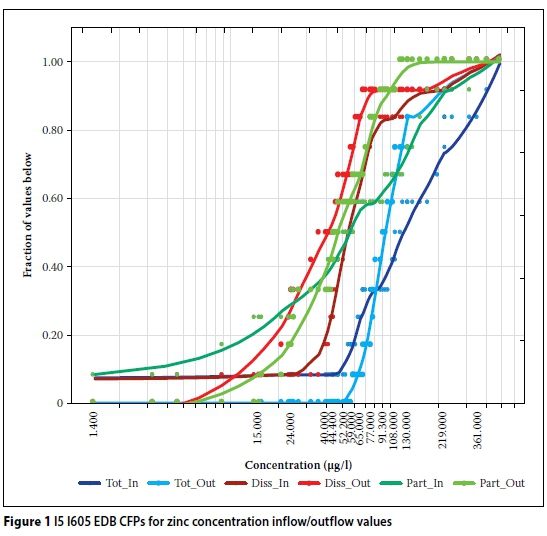
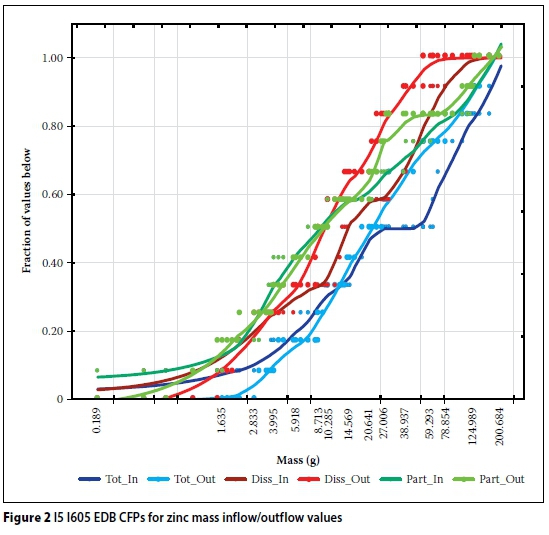
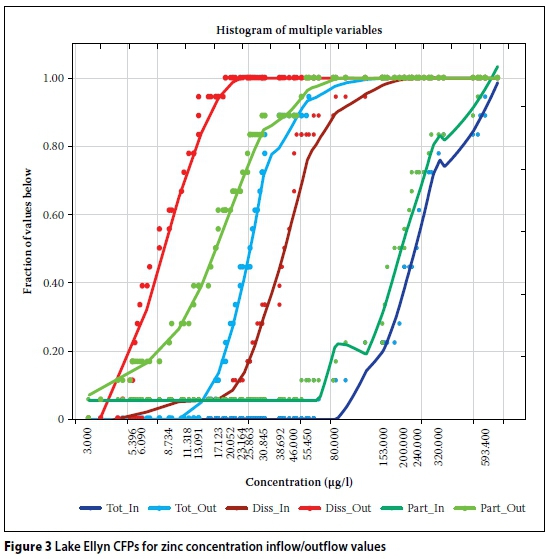
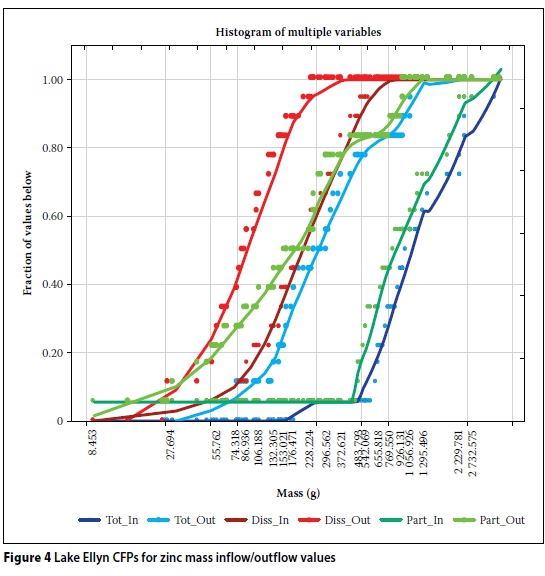
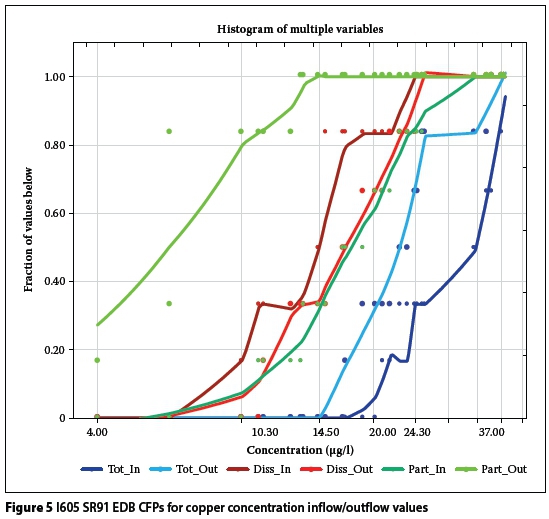
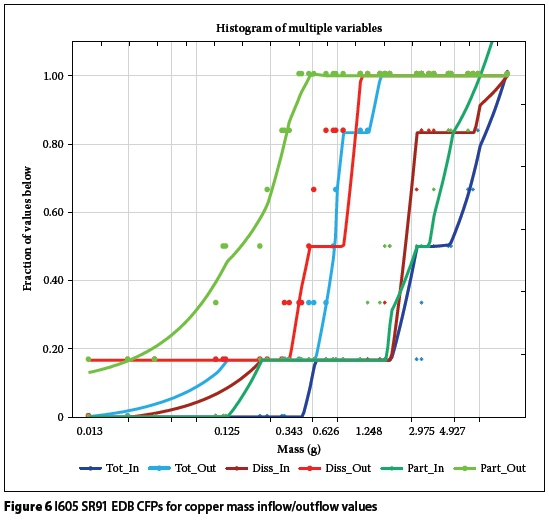
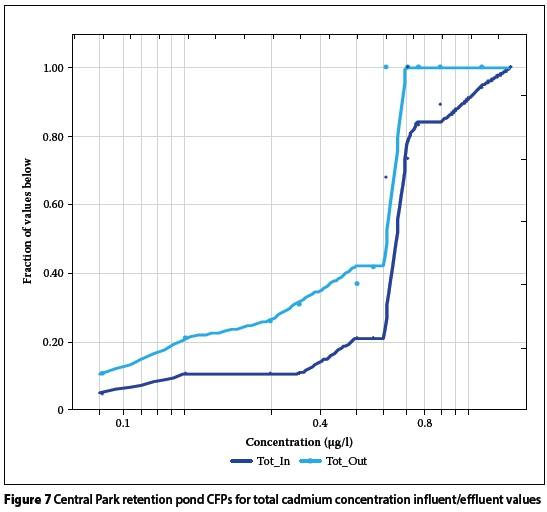
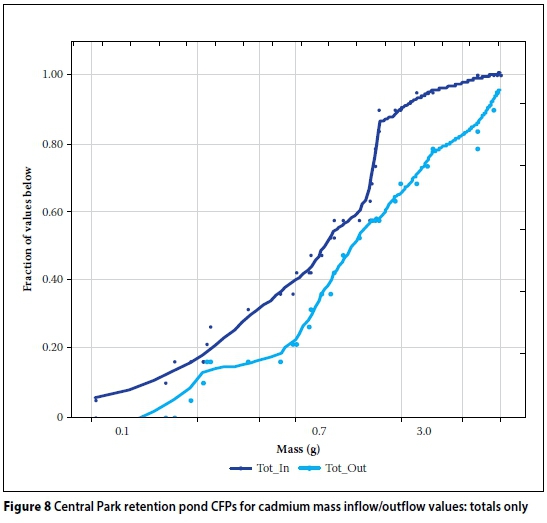
Graphical displays of data
CFPs for the selected case studies are provided in Figures 1-8. The following terms were used in the graphs:
■ Tot_In: Total substance in inflow
■ Tot_Out: Total substance in outflow
■ DissIn: Dissolved substance in inflow
■ DissOut: Dissolved substance in outflow
■ Part_In: Particulate substance in inflow
■ Part_Out: Particulate substance in outflow
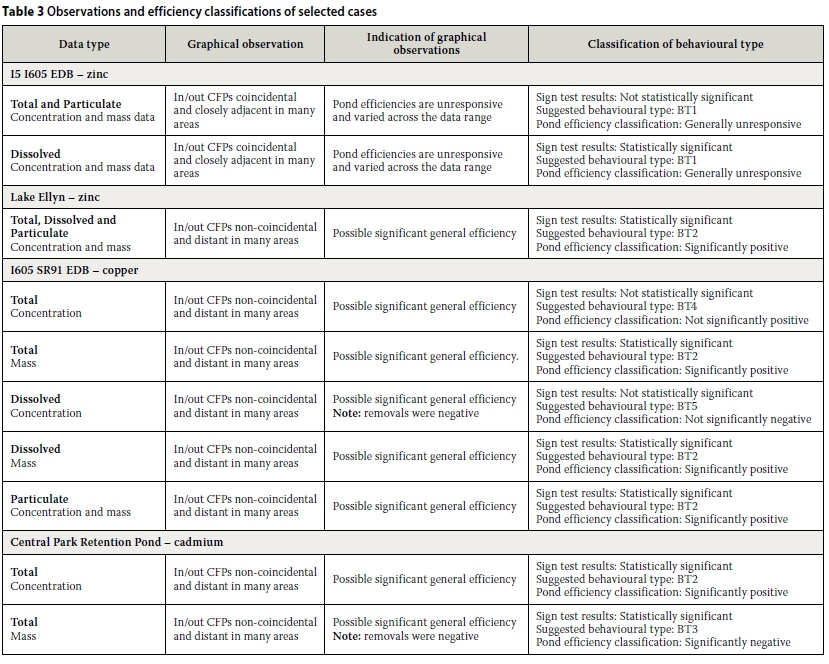
Observations and efficiency classifications
Behavioural observations coupled with the Sign test results and the resultant efficiency classifications are summarised in Table 3 (p 54).
ADVANTAGES OF THE CLASSIFICATION SYSTEM
1. It provides a standardised methodology, as well as terminology for pond efficiency classification through the creation of a singular descriptor of pond efficiencies, which can be used as a quick reference for comparison across case studies.
2. It is a supplement to the EPM, which is a highly recommended method (see GeoSyntec Consultants & Wright Water Engineers 2009) for pond efficiency determinations. The basis of the method is therefore already well established amongst stormwater quality researchers.
SHORTCOMINGS OF THE CLASSIFICATION SYSTEM
1. An advantage of the system, namely the provision of a singular descriptor of pond efficiency, is also a disadvantage. From the results it can be seen that complex cases may arise in which classification is overly simplified, resulting in failure to highlight underlying and complicated pond behaviour. For example, the I5 I605 EDB total zinc removal efficiencies for concentration and mass were classified as "generally unresponsive". Closer inspection of the CFPs showed that removals were positive at higher values and negative at lower values, and this behavioural inconsistency could not be explicitly indicated in the classifications.
2. The efficiency classifications are qualitative rather than quantitative. In this system there are only five classifications and therefore only five levels of comparison, whereas numerical descriptors may result in infinite levels of comparison.
3. Shortcomings of the Effluent Probability Method are inherited by the classification system, e.g.:
a. The graphical interpretations of efficiency are subjective. Cases can arise in which the interpretation of graphs is debatable. For example, the I5 I605 EDB dissolved zinc removal efficiencies were classified as "generally unresponsive", even though the results of the statistical significance tests were p < 0.05 in both cases. The interpretation of the graphs as "CFPs coincidental and closely adjacent in many areas" had a purely subjective basis. Therefore, in cases where CFPs show unclear indications of overall efficiencies, the results of the classification procedure with the EPM may differ from researcher to researcher.
b. The system includes consideration of statistical significance, the use of which is a controversial topic among scientists (Dickson & Baird 2011).
CONCLUSION
The Effluent Probability Method is a preferential method for evaluation of stormwater pond efficiencies, but does not lend itself to comparisons across case studies. The development of the classification system presented here was necessitated by a need to create a standard and singular basis on which pond efficiencies could be compared across case studies.
The main advantage, and disadvantage, of the system is the singular descriptor of efficiency for a pond, which allows comparison between case studies, but at the same time limits the ability to deal with complicated efficiencies over different data ranges.
In addition, the system has inherited the advantages, as well as the limitations, of the Effluent Probability Method.
The classification system is an attempt at improving the EPM for comparison of pond efficiencies. Future development of this system must include definite guidelines for classification and considerations of reproducibility. As it stands, it serves as a first overview of pond behaviour that can be used to inform further, more detailed, behavioural comparison.
REFERENCES
Chen, C F, Lin, J Y, Huang, C H, Chen, W L & Chueh, N L 2009. Performance evaluation of full-scale natural treatment system for nonpoint source and point source pollution removal. Environmental Monitoring and Assessment, 157(1): 391-406. [ Links ]
Dickson, M & Baird, D 2011. Handbook of the Philosophy of Science, Vol. 7. Philosophy of Statistics. Amsterdam: Elsevier. [ Links ]
Dixon, W J & Mood, A M 1946. The statistical sign test. Journal of the American Statistical Association, 41(236): 557-66. Available at: http://www.jstor.org (accessed on 17 September 2012). [ Links ]
Dixon, W J 1953. Power functions of the sign test and power efficiency for normal alternatives. Annals of Mathematical Statistics, 24(3): 467-473. Available at: http://www.jstor.org (accessed on 29 September 2011). [ Links ]
Fassman, E 2012. Stormwater BMP treatment performance variability for sediment and heavy metals. Separation and Purification Technology, 84: 95-103. [ Links ]
GeoSyntec Consultants & Wright Water Engineers 2009. Urban stormwater BMP performance monitoring. Available at: http://www.bmpdatabase.org (accessed on 17 May 2011). [ Links ]
Geosyntech Consultants, Urban Drainage and Flood Control District, URS & UWRRC 1999. Task 3-1 Technical Memorandum. Available at: http://www.bmpdatabase.org (accessed on 17 May 2011). [ Links ]
Geosyntech Consultants Inc & Wright Water Engineers Inc 2011. International stormwater Best Management Practices (BMP) database. Pollutant category summary: Metals. Available at: http://www.bmpdatabase.org (accessed on 28 September 2011). [ Links ]
Montgomery, D C & Runger, G C 2003. Applied Statistics and Probability for Engineers, 3rd ed. New York: Wiley. [ Links ]
 Correspondence:
I C Brink
Department of Civil Engineering
Stellenbosch University
Private Bag X1
Matieland, 7602
South Africa
T: +27 21 808 4195
E: icbrink@sun.ac.za
W Kamish
Department of Civil Engineering
Stellenbosch University
Private Bag X1
Matieland, 7602
South Africa
T: +27 21 808 4352
E: wageed.kamish@gmail.com

ISOBEL BRINK (Associate Member SAICE) is a PhD student in Civil Engineering at Stellenbosch University. She obtained a B Bldg Arts degree from the University of Port Elizabeth in 1999, and a BSc and an MSc in Civil Engineering from the University of Cape Town in 2005 and 2008 respectively (with her MSc specialising in water quality). She was on the Dean's Merit List for all her civil engineering undergraduate study years, which she completed with first-class honours.

WAGEED KAMISH (Pr Eng) obtained a BSc in Chemical Engineering from the University of Cape Town and an MSc in Civil Engineering from Stellenbosch University, where he is also completing his PhD studies in Environmental Engineering. He has 18 years' experience in the water quality field and has specifically been focusing on water quality situation assessments for water resource studies, as well as hydrodynamic water quality and hydrological modelling. More recently he has been involved in cleaner production projects and computational fluid dynamics analyses in support of bulk infrastructure designs.

