


Services on Demand
Article
 English (pdf)
 Article in xml format
 Article references
Indicators

Related links
-
 Cited by Google
 -
 Similars in Google
Share

 Permalink
Journal of the South African Institution of Civil Engineering
On-line version ISSN 2309-8775
Print version ISSN 1021-2019
J. S. Afr. Inst. Civ. Eng. vol.58 n.2 Midrand Jun. 2016
http://dx.doi.org/10.17159/2309-8775/2016/v58n2a5
TECHNICAL PAPER
Stormwater pond efficiency determinations with the effluent probability method: The use of mass versus concentration parameters
I C Brink; W Kamish
ABSTRACT
Use of the concentration parameter has in the past generally been favoured in stormwater structure efficiency determinations, and specifically with use of the Effluent Probability Method. However, efficiency is by definition related to the amount of substance removed within a stormwater structure, and concentration, being a mathematical construct, cannot be "removed". The purpose of this study was to investigate whether there is substantive proof for the use of substance concentration as a proxy for mass in the Effluent Probability Method to ascertain the amount of substance removed by a structure, i.e. its efficiency. Theoretical considerations and results of data analyses did not support this, and it is therefore recommended that mass, and not concentration, be used in efficiency determinations with the Effluent Probability Method.
Keywords: stormwater, pond efficiency, detention pond, retention pond, effluent probability method, mass, concentration
INTRODUCTION
In the past, the use of the concentration parameter has been favoured in general stormwater structure efficiency determinations (Greb & Bannerman 1997; Strecker et al 2001; Hossain et al 2005; Barrett 2008), as well as specifically with use of the Effluent Probability Method (EPM) (Chen et al 2009; Geosyntech Consultants Inc & Wright Water Engineers Inc 2011; Fassman 2012).
This paper contains findings from a larger research project into the design of stormwater detention and retention ponds for removal of metals. Said project required determinations of stormwater pond efficiencies in order to investigate links with pond physical parameters (volume, retention time, etc). The EPM was used for the determination of pond efficiencies.
The term "efficiency" has often been used in literature without explanation of its exact meaning. In this paper, the following definition applies: "Efficiency is a measure of how well a structure or system removes a substance". This definition was adapted from an original definition proposed by Strecker et al (2001), which reads: "Efficiency is a measure of how well a BMP (read Best Management Practice) or BMP system removes pollutants". The revised definition omitted references to the term "BMP" and replaced the original term "pollutants" with the term "substance". This was done to generalise the definition, since the term "BMP" is specific mainly to literature originating in the USA, and the meaning of the term "pollutant" is specific to its application. Furthermore, the definition of efficiency is delineated here only to refer to differences between monitored pond point influents and effluents, i.e. the definition does not include substance sources such as direct overland flow or base flow.
The definition of efficiency used in this research therefore refers to the removal (positive or negative) of a tangible element, i.e. a substance, by a stormwater structure. Therefore, there is a fundamental fallacy in the use of a concentration parameter when determining pond efficiencies, namely concentration is not a tangible element. It is a mathematical construct comprising physically measurable quantities - mass and volume. It is also an abstract concept - one cannot see or feel concentration. Terms such as "removal of concentration" are therefore ill-advised. Concentration does not exist physically and cannot be removed physically. Concentration, however, can be changed through removal or addition of the physical elements found in its compound parameters, namely mass and volume.
Nevertheless, the favoured use of the concentration parameter in literature necessitated further investigation into whether the concentration parameter may be used as a proxy parameter for mass, to ascertain the amount of substance removed by a structure. The aforementioned hypothesis is the subject of this paper. This hypothesis has the theoretical weakness that concentration, although directly related to substance mass, is also influenced by volume, which is wholly unrelated to the amount of substance removed. The use of the term "efficiency", as defined above, in conjunction with the concentration parameter (albeit theoretically established here as a fallacy), has been continued in this paper.
METHODS
Data sources and preparation
Data for the study was obtained from the International Stormwater BMP database, v.07.07.11, available on www.bmpdatabase.org. Data consisted of water quality data (event mean concentrations), total inflow/outflow volumes per storm and physical characteristics of ponds. Experimental methods for data determination were standard and generally well documented within the database. Metals concentrations were measured with various types of spectrometry devices, and solids were measured with gravimetric methods.
The data within the database was provided as event mean concentrations (EMCs). EMCs are a flow-proportional statistical average defined in the BMP Database's Urban BMP Performance Monitoring Manual (GeoSyntec Consultants & Wright Water Engineers 2009, p 7-2) as "the total constituent mass divided by the total runoff volume". They state that this parameter may be combined with flow data to determine pollutant load from any given storm.
Data preparation included case study selection, subcase selection, treatment of non-detects, investigations into data quality and testing for normality in data. The whole project consisted of investigations into 10 detention pond and 20 retention pond case studies. Data was divided into a total of 120 metals and solids subcases, namely arsenic, cadmium, copper, lead, zinc, total suspended solids (TSS) and total volatile solids (TVS). Further division of subcases into total and dissolved fractions yielded 168 data sets.
The Regression on Order Statistics (ROS) method was used to estimate non-detect (censored) values for statistical calculations. The software application NADA for R version 2.15.0 (The R Foundation for Statistical Computing, copyright 2012) was used to model values. Mass data was calculated from ROS modelled non-detect values only in cases where the position of the modelled value in relation to volume data was clear, i.e. where there was no doubt that the modelled value related to a specific storm event. Data sets with > 80% non-detects could not be modelled (Helsel & Lee 2005) and were left unchanged.
Quality assurance: data reviews
Data was deleted from raw datasets in the following cases:
1. Paired datasets where the measured soluble concentration was reported to be a value larger than the measured total concentration. It was impossible to ascertain where the error occurred, and therefore total and soluble data in such cases were wholly removed from the datasets.
2. Datasets where the non-detects were reported with a method detection limit that was higher than any of the measured data. This scenario does not allow for any insight into the placement of data on a ranking scale; it only shows that the non-detects are somewhere within the whole range of the measured data. Such non-detect data was therefore deleted from the datasets.
3. Data that had been identified in the database by the data providers as "not for further use in water quality or volumetric analyses".
4. Data coded as grab samples. The majority of data comprised event-mean concentrations. Grab samples could not be assumed to represent mean concentrations and were therefore not included in further data analyses.
Statistics
Descriptive statistics were calculated with the software program STATISTICA v.10 (Copyright© StatSoft Inc 1984-2011). The results of normality testing indicated a lack of normality in a great number of datasets (untransformed as well as log-transformed). Non-parametric descriptive statistics were therefore further used to determine measures of location, central tendency and spread. The results of these analyses were not directly pertinent to the arguments presented in this paper and were therefore not explicitly included.
The Effluent Probability Method (EPM)
The EPM provides a statistical view of influent and effluent quality, and has been recommended by GeoSyntec Consultants & Wright Water Engineers (2009) under support from inter alia the Water Environment Research Foundation (WERF), the United States Environmental Protection Agency (USEPA) and the American Society of Civil Engineers (ASCE).
The methodology broadly comprises the following steps:
1. Determine whether a BMP is providing treatment by calculating statistical significance at 95% confidence level between influent and effluent values.
2. Examine a cumulative distribution function or standard parallel probability plot of influent and effluent quality. (GeoSyntec Consultants & Wright Water Engineers 2009)
The results of the statistical analysis indicated that normality could not be assumed in many datasets and that difference values between influent and effluent data were non-symmetrical. The state of the data therefore necessitated the use of the non-parametric, but less powerful, Sign test for testing of statistical significance. The software program STATISTICA v.10 (Copyright© StatSoft Inc 1984-2011) was used for all calculations of statistical significance. Statistical significance between influent and effluent data was accepted at p < 0.05. A table published by Dixon (1953, Table 1, p 468) was used to estimate power.
Cumulative Distribution Functions (CDFs) can be approximated by Cumulative Frequency Plots (CFPs) and can be displayed on these plots to determine how well the data fits a theoretical (e.g. normal) distribution (GeoSyntec Consultants & Wright Water Engineers 2009). However, the establishment of pond efficiencies for comparative purposes did not require the establishment of theoretical distributions. Normality of datasets was established through the use of Normal Probability Plots in order to inform the choice between statistical tests. Therefore, the sample approximations of the CDFs, i.e. CFPs, were deemed adequate for the graphical representations of data in this project.
STATISTICA v.10 (Copyright© StatSoft Inc 1984-2011) was used to generate CFPs.
The Lowess smoothing method was used in the generation of regression lines, while graphical observations were limited to visual categorisation of graphical behaviour according to plot point and regression line proximity.
Classification of pond efficiencies
Relationships between input and output CFPs resulted in the classification of general pond efficiencies into two different observational types. Additional consideration of statistical significance results led to the establishment of five different behavioural types (BTs), which are discussed further below. The criteria for the selection of BTs are shown in Table 1 (p 43).
RESULTS AND DISCUSSION
Dataset efficiency classifications
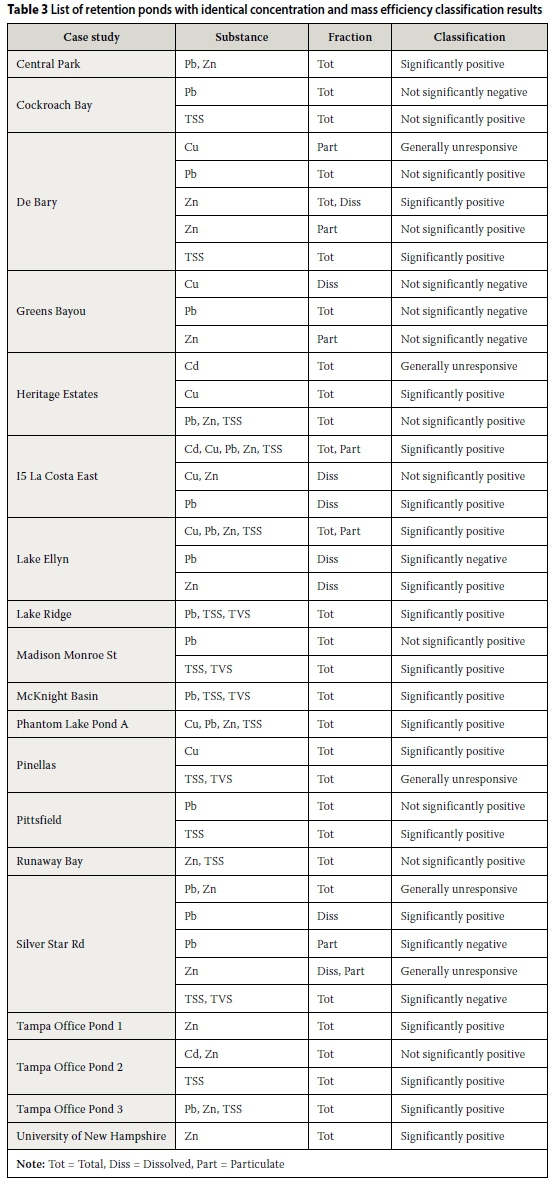
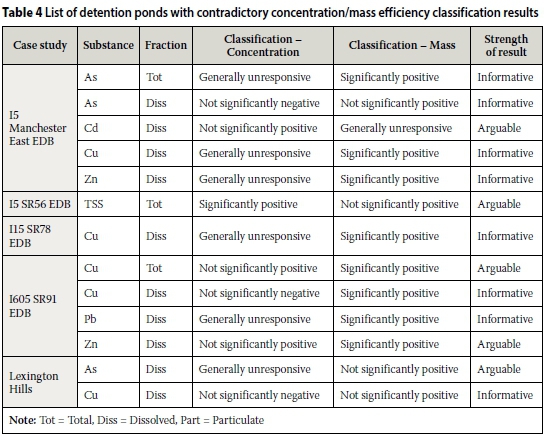
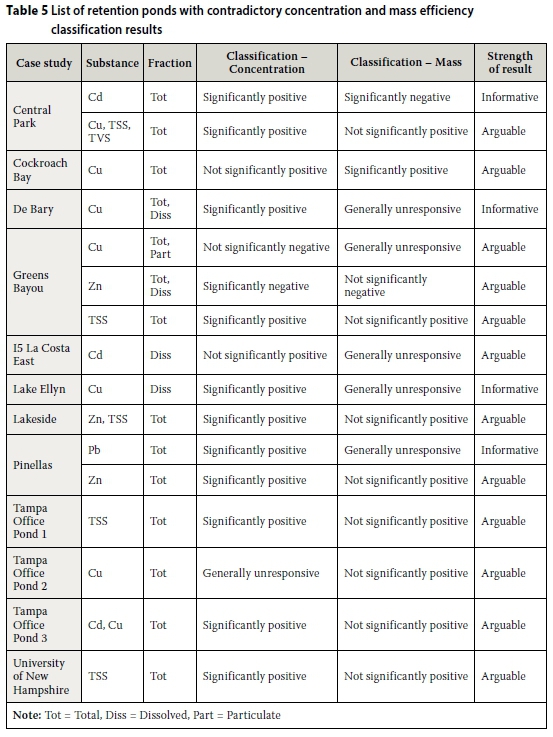
Pond efficiencies were classified separately for substance type (metals and solids), as well as fraction (total, dissolved or particulate). Tables 2 to 5 (pp 43-45) contain lists of detention and retention ponds with similar and dissimilar concentration and mass efficiency classification results.
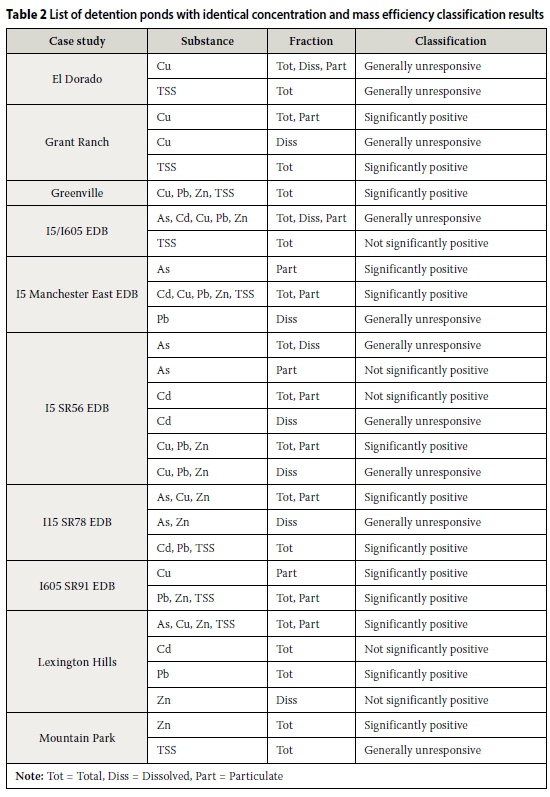
The power of the Sign test results was low for the majority of detention and retention pond total (concentration and mass) cases where statistical significance between influent and effluent values was not found. It is therefore possible that, due to effect size, these case studies may have produced significant results if larger sample sizes had been available. However, the subject of this investigation was to ascertain if concentration and mass data provide similar interpretations of efficiency with the EPM. Therefore, the focus was on the data at hand, and hypotheses regarding different outcomes with larger data samples were considered to be irrelevant.
Classifications where subjectivity may have resulted in arguable outcomes, namely classifications labelled as "not significantly positive", "not significantly negative" or "generally unresponsive" were found in a number of cases. Efficiency classifications of such cases may have been found to be identical rather than contradictory if (1) more data had been available to improve the power and change the outcome of the statistical significance results, or (2) a different (and subjective) decision regarding the graphical display of data had been made.
Therefore it is possible that, under different circumstances, similar concentration and mass classifications may have been found for cases where the classifications were combinations of (1) not significantly positive and significantly positive, (2) not significantly negative and significantly negative, and (3) not significantly positive/negative and generally unresponsive. In this research such cases include the following: I5 Manchester East EDB (dissolved cadmium), I5 SR56 EDB (TSS), I605 SR91 EDB (total copper, dissolved zinc), Lexington Hills Pond (dissolved arsenic), Central Park Pond (total copper, TSS, TVS), Cockroach Bay Pond (total copper), Greens Bayou (total and particulate copper, total and dissolved zinc, TSS), I5 La Costa East EDB (dissolved cadmium), Lakeside Pond (total zinc, TSS), Pinellas Pond (total zinc), Tampa Office Pond 1 (TSS), Tampa Office Pond 2 (total copper), Tampa Office Pond 3 (total cadmium, total copper) and University of New Hampshire Pond (TSS).
Cases where the differences between influent and effluent values were statistically significant, combined with CFPs that were obviously distant, classifications such as "significantly positive" or "significantly negative" are well founded and not considered to be arguable. Therefore, cases where the concentration and mass classifications were combinations - (1) positive and negative, or (2) generally unresponsive and significantly positive/negative - they have notable differences between concentration and mass efficiencies. Such cases included the following: I5 Manchester East EDB (total and dissolved arsenic, dissolved copper, dissolved zinc), I15 SR78 EDB (dissolved copper), I605 SR91 EDB (dissolved copper, dissolved lead), Lexington Hills (dissolved copper), Central Park Pond (total cadmium), De Bary Pond (total and dissolved copper), Lake Ellyn (dissolved copper) and the Pinellas Pond (total lead).
No evidence was found to suggest that contradictory concentration/mass classifications may be linked to specific substances. Contradictory results for both detention and retention ponds encompassed all metals (arsenic, cadmium, copper, lead, zinc) and solids subcases (TSS, TVS).
Graphical data behaviour
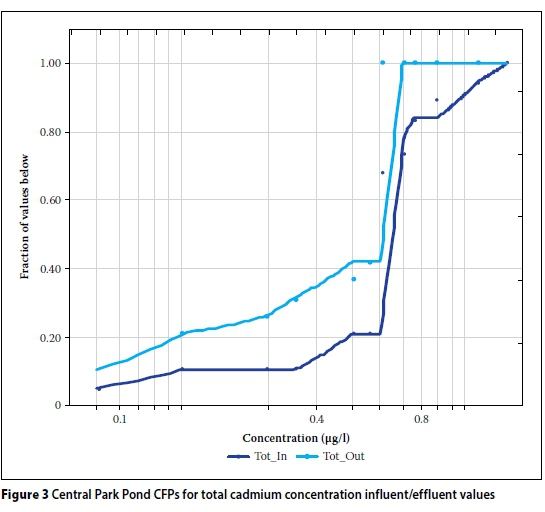
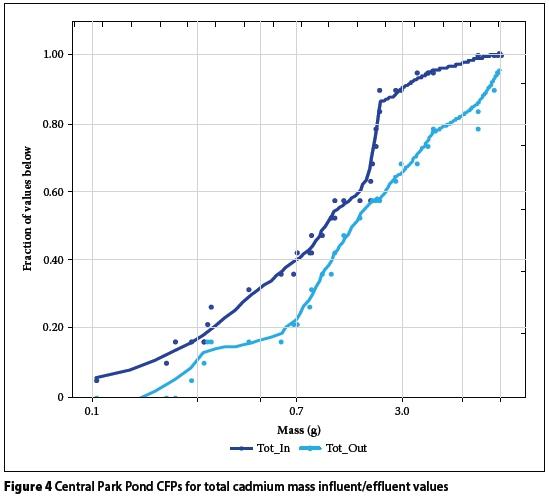
Investigation of CFPs showed differences in concentration and mass data behaviour that were obscured by the simplistic singular efficiency classification results. Two informative cases were selected for illustrative purposes (see Figures 1 to 4).
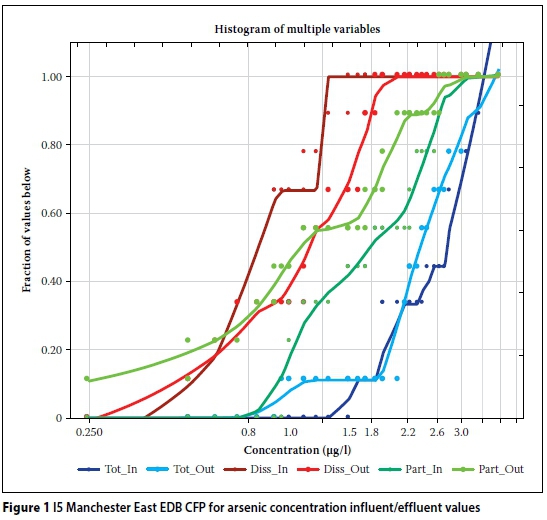
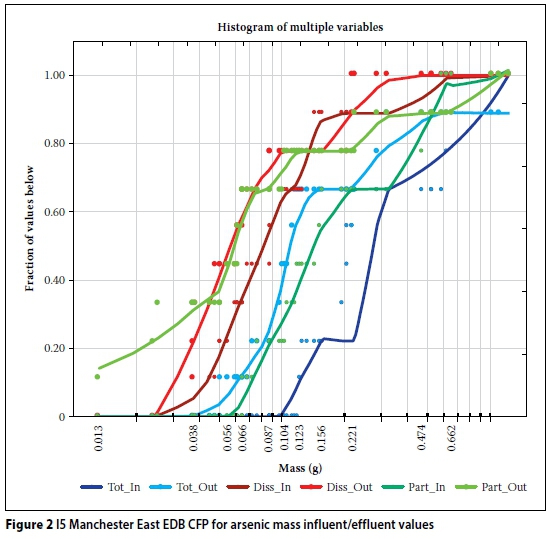
The I5 Manchester East EDB (arsenic) CFPs indicate markedly different total and dissolved arsenic concentration and mass efficiencies. Total concentration influent/ effluent data behaviour is closely adjacent along the majority of the data range while, in contrast, total mass influent/effluent data is distant along the majority of the data range. Dissolved concentration influent/effluent CFPs indicate negative removals along the majority of the data range while, in contrast, the mass influent/effluent CFPs indicate positive removals along the majority of the data range. Interpretation of the concentration graphs therefore leads to an inference of poor total and negative dissolved pond efficiencies, while the interpretation of the mass data indicates considerably better and generally positive pond efficiencies.
The Central Park Pond CFPs (total cadmium) indicate positive concentration efficiencies and negative mass efficiencies. Therefore, interpretation of the concentration graph leads to an inference of positive total pond efficiencies, while the interpretation of the mass data indicates much poorer negative efficiencies.
These graphs illustrate erroneous conclusions that can be made regarding pond efficiencies through the use of concentration as a parameter for the determination of the amount of substance removed, namely:
1. In the I5 Manchester East EDB it is possible that physical pond functioning influenced influent arsenic concentrations in such a way that substances were more concentrated when they reached the pond effluent stream. This does not mean that the pond did not remove substances, as was evidenced by the mass data, only that the substances became more concentrated within the pond.
2. The Central Park pond sources of influent other than the influent stream, such as direct overland flow, direct rainfall or base flow, may have increased pond volumes and decreased influent cadmium concentrations, thereby reducing effluent concentrations. This does not mean that the pond removed cadmium, as was evidenced by the mass data, only that the substance became less concentrated within the pond.
CONCLUSIONS
The subject of this paper was an investigation into the hypothesis that the concentration parameter may be used as a proxy parameter for mass in the Effluent Probability Method (EPM) to ascertain the amount of substance removed by a structure, i.e. its efficiency. The results of theoretical considerations and data analyses negate this hypothesis. Theoretically, the hypothesis has the weakness that concentration, although mathematically directly related to mass, is also influenced by volume, which is completely unrelated to mass.
Data investigations showed that many of the resultant contradictory classifications for concentration and mass data may be arguable. Different graphical interpretations may have resulted in similar classifications for concentration and mass data in some cases. However, a noteworthy number of cases had contradictory concentration and mass classifications that were not deemed to be fundamentally arguable. Cases wherein (1) concentration and mass removals were opposite (i.e. positive and negative), or (2) where significant removals were found for concentration, and generally unresponsive behaviour was seen for mass (and vice versa), were deemed to have unarguably contradictory concentration and mass data behaviours.
Therefore, the efficiency classification results (Tables 2-5 on pp 43-45) indicate that different classifications were possible for evaluations of concentration and mass efficiencies. Such differences were due to different concentration and mass data behaviours, as illustrated in Figures 1 and 2. Pond influent concentrations changed within ponds with subsequent increases or decreases in effluent concentration values without concurrent increases or decreases in mass values.
Figures 1 and 2 demonstrate erroneous conclusions that can be made through the use of the concentration parameter, namely (1) increases in effluent concentrations compared to influent concentrations do not necessarily mean that the pond did not remove substances, only that the substances became more concentrated within the pond, and (2) decreases in effluent concentrations compared to influent concentrations do not necessarily mean that the pond removed substances, only that the substances became less concentrated within the pond.
Therefore the results suggest that not only is the use of the concentration parameter as a proxy parameter for mass unfounded for use in the EPM, but, in addition, erroneous conclusions regarding pond efficiencies can be made. It is therefore recommended that the mass parameter be used for determination of pond efficiencies with the EPM.
REFERENCES
Barrett, M E 2008. Comparison of BMP performance using the international BMP database. Journal of Irrigation and Drainage Engineering, 134(5): 556-561. [ Links ]
Chen, C F, Lin, J Y, Huang, C H, Chen, W L & Chueh, N L 2009. Performance evaluation of full-scale natural treatment system for nonpoint source and point source pollution removal. Environmental Monitoring and Assessment, 157(1): 391-406. [ Links ]
Dixon, W J 1953. Power functions of the sign test and power efficiency for normal alternatives. Annals of Mathematical .Statistics, 24(3): 467-473. Available at: http://www.jstor.org (accessed on 29 September 2011). [ Links ]
Fassman, E 2012. Stormwater BMP treatment performance variability for sediment and heavy metals. Separation and Purification Technology, 84: 95-103. [ Links ]
GeoSyntec Consultants & Wright Water Engineers 2009. Urban stormwater BMP performance monitoring. Available at: http://www.bmpdatabase.org (accessed on 17 May 2011). [ Links ]
Geosyntech Consultants Inc & Wright Water Engineers Inc 2011. International stormwater Best Management Practices (BMP) database. Pollutant category summary: Metals. Available at: http://www.bmpdatabase.org (accessed on 28 September 2011). [ Links ]
Greb, S R & Bannerman, R T 1997. Influence of particle size on wet pond effectiveness. Water Environment Research, 69(6): 1134-1138. [ Links ]
Helsel, D R & Lee, L 2005. Statistical analysis of water-quality data containing multiple detection limits: S-language software for regression on order statistics. Computers & Geosciences, 31(10): 1241-1248. [ Links ]
Hossain, M A, Alam, M, Yonge, D R & Dutta, P 2005. Efficiency and flow regime of a highway stormwater detention pond in Washington, USA. Water, Air, and Soil Pollution, 164(1): 79-89. [ Links ]
Strecker, E W, Quigley, M M, Urbonas, B R, Jones, J E & Clary, J K 2001. Determining urban stormwater BMP effectiveness. Journal of Water Resources Planning and Management, 127(3): 144-149. [ Links ]
 Correspondence:
I C Brink
Department of Civil Engineering
Stellenbosch University
Private Bag X1
Matieland, 7602
South Africa
T: +27 21 808 4195
E: icbrink@sun.ac.za
W Kamish
Department of Civil Engineering
Stellenbosch University
Private Bag X1
Matieland, 7602
South Africa
T: +27 21 808 4352
E: wageed.kamish@gmail.com

ISOBEL BRINK (Associate Member SAICE) is a PhD student in Civil Engineering at Stellenbosch University. She obtained a B Bldg Arts degree from the University of Port Elizabeth in 1999, and a BSc and an MSc in Civil Engineering from the University of Cape Town in 2005 and 2008 respectively (with her MSc specialising in water quality). She was on the Dean's Merit List for all her civil engineering undergraduate study years, which she completed with first-class honours.

WAGEED KAMISH (Pr Eng) obtained a BSc in Chemical Engineering from the University of Cape Town and an MSc in Civil Engineering from Stellenbosch University, where he is also completing his PhD studies in Environmental Engineering. He has 18 years' experience in the water quality field and has specifically been focusing on water quality situation assessments for water resource studies, as well as hydrodynamic water quality and hydrological modelling. More recently he has been involved in cleaner production projects and computational fluid dynamics analyses in support of bulk infrastructure designs.

