


Services on Demand
Article
 English (pdf)
 Article in xml format
 Article references
Indicators

Related links
-
 Cited by Google
 -
 Similars in Google
Share

 Permalink
Journal of the South African Institution of Civil Engineering
On-line version ISSN 2309-8775
Print version ISSN 1021-2019
J. S. Afr. Inst. Civ. Eng. vol.58 n.2 Midrand Jun. 2016
http://dx.doi.org/10.17159/2309-8775/2016/v58n2a3
TECHNICAL PAPER
A qualitative model study on the effect of geosynthetic foundation reinforcement in sand overlying very soft clay
B R Jones; S W Jacobsz; J L van Rooy
ABSTRACT
A centrifuge model study was carried out investigating the effects of the inclusion of geogrid reinforcement in a sand layer constructed over a thin, very soft clay layer to facilitate the construction of warehouse floors supporting product stockpiles. The use of geogrid reinforcement allowed larger surcharge loads to be applied for a given amount of settlement by allowing load to be spread over the footprint area of the geogrid due to the tension membrane effect and its associated benefits. A lower-bound calculation of the load at which the tensile reinforcement starts to function is presented. Upper-bound solutions were found to overestimate allowable surcharge loads, as they are associated with unacceptable deformations. The reinforcing effect of the geogrid was found to have been fully mobilised at 5% vertical compression of the clay layer.
Keywords: centrifuge modelling, soft clay, geogrid, reinforced sand
INTRODUCTION
Southern Africa's eastern coastline is characterised by several lagoonal systems, comprising complex unconsolidated deposits of sands, silts and clays. These river estuaries are hosts to a number of major harbours, and have proved to be problematic as far as foundation solutions for structures, which typically involve piling techniques, are concerned. Zannoni et al (2012) and Moore et al (2012) have both presented case studies where high-tensile strength geogrids have successfully been adopted to provide basal reinforcement upon which structures can be founded. The basal reinforcement utilised in both studies was specifically to support the floors of warehouse structures in which large platform loads developed as a result of product stockpiling. The foundations for the walls and overhead roof structures were piled. The major concern on site for both these studies was the presence of compressible, soft, thin, shallow clay horizons below the foundation footprint.
The warehouse floors were constructed on a layer of sand reinforced with a geogrid constructed over the soft clay layer. The application of surcharge to the floor would result in undrained loading of the clay. Increasing the load would eventually result in the undrained strength of the clay being exceeded. This could result in the clay failing by being squeezed out to the sides (SANS 207 2006). This deformation could result in undesirable non-uniform settlement and horizontal deformation of the floor. The intension with the provision of reinforcement in the sand layer above the clay is to control horizontal deformation and to strengthen the sand layer to provide a more rigid support to the floor.
Deformation observed in soil is the result of both compressive and tensile strains, which usually develop when soil shears (Jewell 1996). However, when reinforcement is placed in soil it can develop bond through frictional contact between the soil particles and the planar surface areas of the reinforcement, and from bearing stresses on transverse surfaces that exist in geogrids or ribbed strips (Jewell 1996). Deformation in the soil causes tensile forces to develop in the reinforcement when the reinforcement is inclined in a direction perpendicularly to that of the compressive strain in the soil. The mobilised reinforcement force, ultimately limited by the available bond, acts to alter the force equilibrium in the soil (Jewell 1996). The performance of reinforced soil foundations depends not only on soil and reinforcement properties, but also on this interaction between the soil and reinforcement (Sharma et al 2009). Sharma et al (2009) also noted that geogrids with higher tensile moduli performed better than geogrids with lower moduli, whilst Binquet and Lee (1975) were also the earliest researchers to show that a failure load could be increased by the use of multiple layers of reinforcement.
Sharma et al (2009) summarised three reinforcement mechanisms of a reinforced soil foundation under strip footings. One mechanism, termed the membrane effect, is characterised by the downward movement of the footing and soil beneath the footing under the applied load. This results in the reinforcement deforming and tensioning. Due to the geogrid stiffness, the curved reinforcement develops an upward force to support the applied load. A certain amount of settlement is needed to mobilise the tensioned membrane effect, and the reinforcement should have enough length and stiffness to prevent it from failing by pull-out and tension.
For reinforcement, which has a width equivalent to the footing width, Huang and Tatsuoka (1990) found that in the zone reinforced beneath the footing, only small strains were induced. They concluded that by densely reinforcing sand with stiff tensile reinforcement having a length similar to the footing width, a failure occurs in sand beneath the reinforced zone, and the bearing capacity characteristics become very similar to those of unreinforced sand loaded with a rigid deep footing having an equivalent depth.
Huang and Tatsuoka (1990) highlighted that there is an obvious increase in the bearing capacity when the geogrid reinforcement is wider than the footing width. They suggest that the increase in the bearing capacity, by using long reinforcement layers, can be considered due to two factors - firstly, from the deep footing effect, as is observed in the case of reinforcing with short reinforcement layers, and secondly, from the effects contributed by the portions of reinforcement placed in the zone beyond the footing width. They termed this the 'wide slab' effect. Their test results showed that the wide slab effect contributed about 10-50% of the total increase in the bearing capacity. Huang and Tatsuoka (1990) also concluded that the degree of contribution also increased with a larger covering ratio above the reinforcement and the number of reinforcing layers present.
Sharma et al (2009) note four possible failure modes for reinforced soil foundations, namely (1) failure above the top layer of reinforcement, (2) failure between reinforcement layers, (3) failure similar to footings on a two-layer soil system, and (4) bearing failure within the reinforced zone. Of the four possible modes of failure defined, the third failure mode was the most relevant to the research covered in this paper. This failure mode is applicable to footings on a two-layer soil system, which is similar to when a strong soil layer overlies a weaker soil layer (Wayne et al 1998). This occurs if the strength of the reinforced zone is much larger than that of the underlying unreinforced zone, and the reinforcement depth ratio (d/B) is relatively small. Consequently, a punching shear failure will occur in the reinforced zone, followed by a general shear failure in the underlying softer unreinforced zone (Sharma et al 2009).
Understanding failure mechanisms is an important component of stability analyses of earth structures. If reinforcement is used, the mechanisms become altered, and choosing the right mechanism for stability analysis may not always be straightforward (Michalowski & Shi 2003). This study seeks to qualitatively define the behaviour of a compressible, soft, thin, shallow clay horizon under an applied load from a wide platform founded upon reinforced sand by using geotechnical centrifuge modelling. Jones and Van Rooy (2014) have previously presented some preliminary findings, and this paper serves to finalise the study.
GEOTECHNICAL CENTRIFUGE MODEL
Test set-up
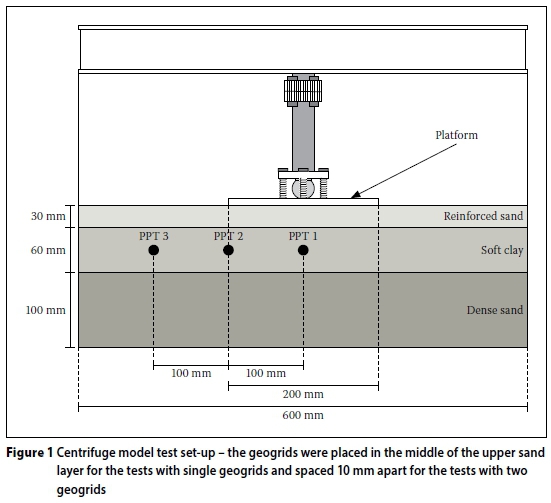
Five geotechnical centrifuge model tests were performed at a scale of 1:50 using the 150 G-ton geotechnical centrifuge housed in the Department of Civil Engineering at the University of Pretoria. Details of the centrifuge facility are described by Jacobsz et al (2014). The model consisted of a 100 mm (5 m) thick dense basal sand layer, overlain by a 60 mm (3 m) thick soft clay layer, which was subsequently overlain by a 30 mm (1.5 m) thick sand layer in which the geogrids were placed. The dimensions in brackets refer to the full scale. Each test was constructed identically, with the model set-up illustrated in Figure 1 and the different configurations of each test illustrated in Figure 2.
The first model (Test 1) was tested without any reinforcement. Tests 2 and 3 consisted of models that were respectively reinforced with one and two geogrids placed in the upper sand layer. The geogrids extended 50 mm (2.5 m) past the edge of the platform and are referred to as having a short width. Tests 4 and 5 had one and two geogrids respectively, extending to 180 mm (9 m) from the edge of the platform, and are referred to as geogrids of extended width. Tests 2 and 4 had one geogrid placed in the middle of the clay layer, while Tests 3 and 5 had two geogrids spaced 10 mm (0.5 m) apart.
Model preparation and construction
The model was prepared in a strongbox measuring 600 mm x 400 mm in plan, fitted with a glass window, which was reduced to 600 mm x 250 mm by placing spacers at the back of the strongbox. The basal sand layer was pluviated to create a 100 mm (5 m) thick dense sand horizon with a relative density of about 69%. This sand was carefully saturated from the base by introducing pore water via a header tank. Dry kaolin clay powder was prepared by mixing under partial vacuum with de-ionised, de-aired water at twice the liquid limit. The slurry was poured over the basal sand horizon and allowed to consolidate in the centrifuge for 14 hours at 50 G under a surcharge load of approximately 25 kPa. This ensured that the clay was normally consolidated and of a very soft consistency with an undrained shear strength which averaged approximately 6 kPa in each test (measured using a vane shear apparatus).
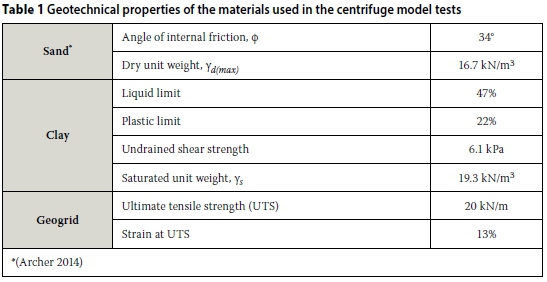
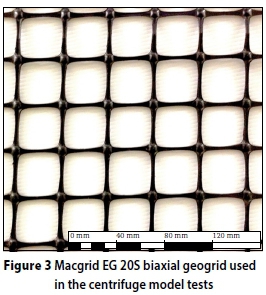
Finally, the reinforced sand layer was pluviated over the clay to a thickness of 30 mm (1.5 m). For the tests with reinforcing included, the sand pluviation was ceased temporarily to allow placement of the geogrids within the reinforcing sand. The geogrids used were unscaled Macgrid EG 20S (a polypropylene biaxial geogrid produced by an extrusion process), obtained from Maccaferri. The geogrid had an ultimate tensile strength of 20 kN/m at 13% strain, with a stiffness of approximately 350 kN/m, i.e. very stiff and strong at the prototype scale. The mesh opening size of the geogrid was 38 mm × 38 mm, and had a percentage open area of 76%. The geotechnical properties of the sand, clay and model geogrid are presented in Table 1, whilst the geogrid is shown in Figure 3.
Three pore pressure transducers (PPTs) were installed at three locations within the clay layer of the model. PPT 1 was installed underneath the centre of the platform, and PPT 2 at the edge of the platform, 100 mm away from the first transducer. PPT 3 was installed 100 mm from the edge of the platform. All PPTs were positioned in the middle of the clay layer. The purpose of the PPTs was to assess the extent of the zone influenced due to the application of the platform load, as loading of the clay would immediately result in the generation of excess pore pressures. Jones (2014) provides further details of the materials and methodology used during the model construction for the centrifuge tests.
Test sequence
During loading of the model an aluminium platform of 200 mm width, 250 mm length, and 5 mm thickness was attached to a jack and lowered at a constant rate of 0.081 mm/s. The bending stiffness (EI) of the plate was 729 Nm2/m width at the model scale, equivalent to 91.2 MNm2/m at full scale. A load cell recorded the applied load mobilised against the platform, while an LVDT measured the vertical displacement at the centre of the platform. The model was observed using a small digital video camera.
CENTRIFUGE TEST RESULTS
Load - deformation behaviour
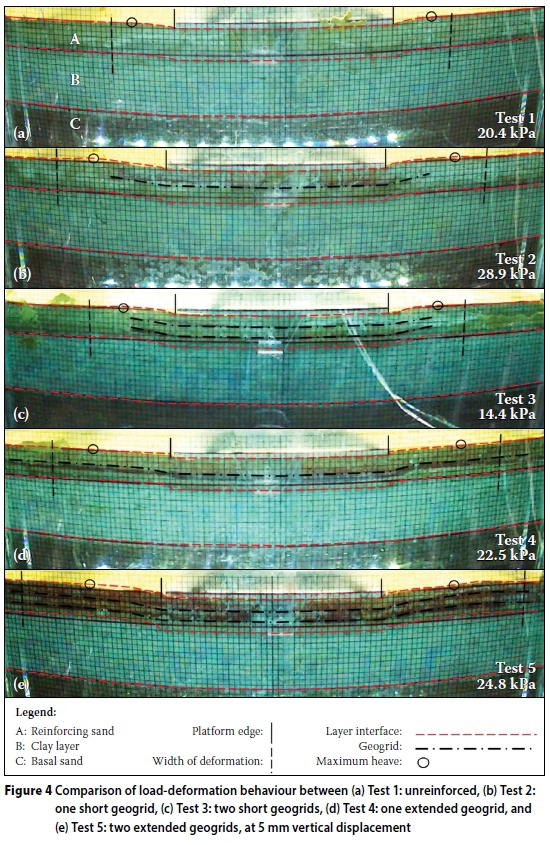
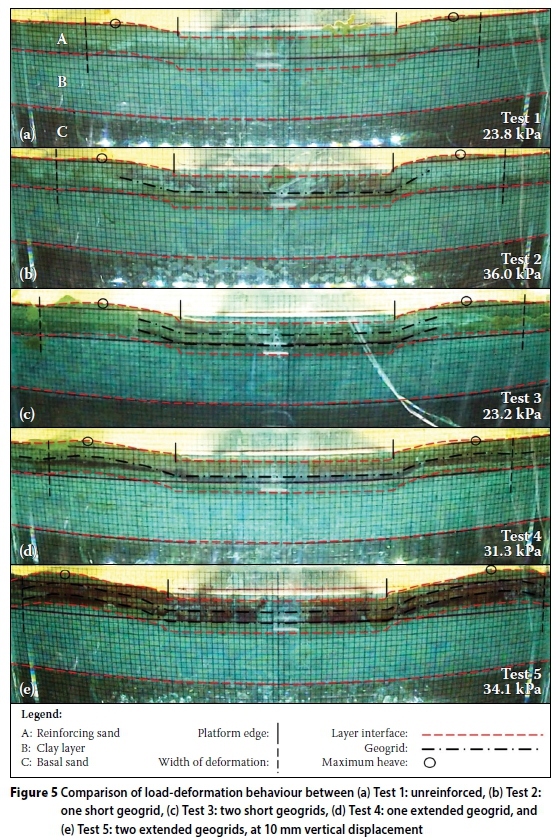
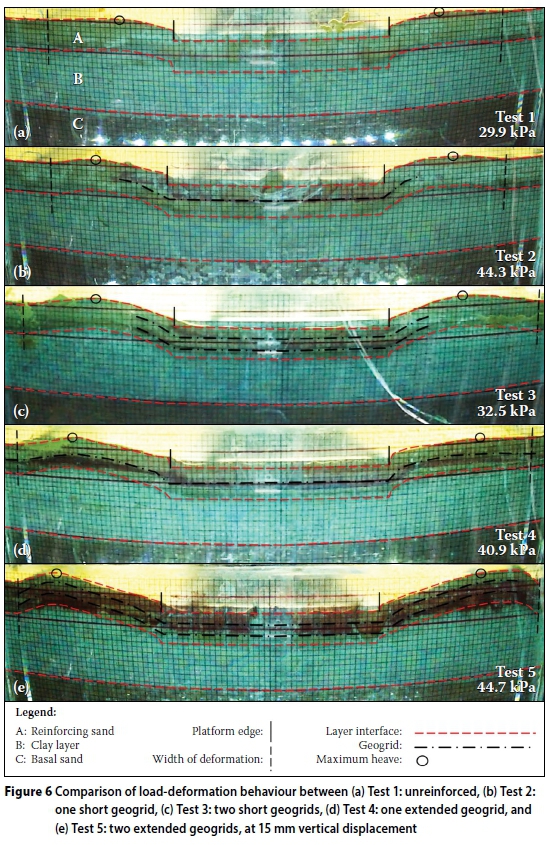
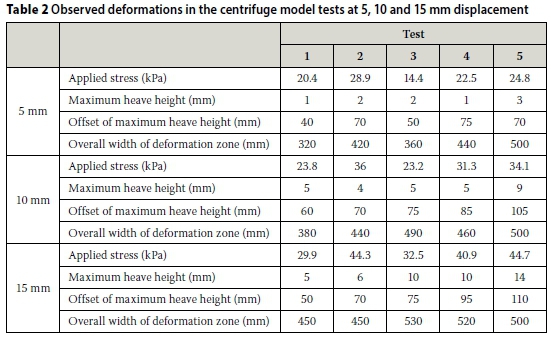
The deformation behaviour from snapshots during each test at respectively 5, 10 and 15 mm vertical displacement is presented in Figures 4, 5 and 6. In order to qualify the deformation behaviour in each model, the following was specifically observed during each test: (1) the mean applied stress recorded against the platform, (2) the maximum vertical height of the heave during deformation of the clay horizon, (3) the offset of this maximum height from the edge of the platform, and (4) the width of the heave zone. A transparency with a grid printed on it was placed between the glass and the model, which assisted in scaling the geometry of the deformation behaviour. Each square on the grid measured 5 mm x 5 mm. Table 2 summarises the observations from the deformation of the clay horizon.
Test 1 - unreinforced
It is evident in Test 1, which had no reinforcement, that at 5 mm vertical platform displacement there was little deformation of the clay horizon. The applied load was 20.4 kPa. The width of the deformation zone is 320 mm, with a maximum height of heave of 1 mm, and the offset of this maximum height at 40 mm from the edge of the platform.
At 10 mm vertical displacement, under an applied load of 23.8 kPa, a shear zone formed vertically through the upper sand horizon below the edges of the platform as punching occurred into the underlying clay. The clay horizon continued to strain underneath the platform and squeezed out laterally. The width of the deformation zone increased to 380 mm, with the heave in the clay attaining a maximum height of approximately 5 mm.
The extent of the deformation zone of the clay at 15 mm vertical displacement had increased in width to 450 mm. The maximum height of heave occurred approximately 50 mm from the edge of the platform. However, there was no change in the height of heave as it remained at a maximum of 5 mm. The load at this time reached 29.9 kPa. In this test the largest strains in the clay appeared to occur immediately underneath the footprint of the platform as the platform punched into the clay, displacing clay outwards and upwards, causing some heave at the adjacent surface.
Test 2 - one short-width geogrid
With one short-width geogrid in Test 2, there was already some deformation of the clay horizon present at small displacements, unlike the unreinforced test. At 5 mm vertical displacement, the width of the zone of visible deformation was 420 mm, whilst the maximum height of heave was 2 mm, located 70 mm from the edge of the platform. The applied stress achieved at this displacement was 28.9 kPa.
At 10 mm vertical displacement, the width of the deformation zone was 440 mm, whilst the heave of the clay horizon attained a maximum height of approximately 4 mm at an offset which remained at 70 mm. The applied stress achieved was 36 kPa.
The lateral extent of the deformation zone, as well as the offset of the maximum height of heave of the clay, was the same at 15 mm vertical displacement. However, the maximum height of heave was 6 mm for the clay horizon, by which time the applied stress had increased to 44.3 kPa. The clay below the width of the geogrid had exhibited the most strain.
Test 3 - two short-width geogrids
Test 3, which had two short-width geogrids, much like in Test 2, showed some deformation of the clay horizon at 5 mm vertical platform displacement at an applied stress of only 14.4 kPa. Reasons for this low stress are possibly related to poor saturation of the clay, as will be discussed later. The heave attained a maximum height of 2 mm at an offset of 50 mm, and the width of the visible deformation zone amounted to 360 mm.
At 10 mm vertical displacement, under an applied stress of 23.2 kPa, the heave of the clay reached a maximum height of approximately 5 mm at an offset of 75 mm, whilst the width of the deformation zone had increased to 490 mm.
The width of the deformation zone of the clay at 15 mm vertical displacement increased to 530 mm. While the offset at which maximum heave occurred, remained unchanged at 75 mm from the edge of the platform, the heave attained a maximum height of 10 mm at an applied stress of 32.5 kPa. Similar to the test with a single layer of short-width geogrid, the largest strains that had occurred in the clay horizon coincided with the width of the geogrid.
Test 4 - one extended-width geogrid
The model with a single layer of extended-width geogrid showed little deformation of the clay horizon at 5 mm vertical displacement. The mobilised stress at this time was 22.5 kPa and the width of the deformation zone approximately 440 mm, with the offset of the maximum height of heave occurring 75 mm from the platform edge. The height of heave was only 1 mm.
At 10 mm vertical displacement, the width of the deformation zone had reached 460 mm, while the heave of the clay reached a maximum height of approximately 5 mm. The offset had moved to 85 mm from the edge of the platform and the mobilised stress had increased to 31.3 kPa.
At 15 mm vertical displacement the lateral extent of the deformation zone of the clay was wider (520 mm). The heave attained a maximum height of 10 mm at an offset of 95 mm, under an applied mobilised load of 40.9 kPa. The inclusion of the single extended-width geogrid reinforcement in the sand in the upper horizon widened the zone of deformation in the clay to a width coinciding with the width of the geogrid.
Test 5 - two extended-width geogrids
Test 5, with two extended-width geogrids, showed some deformation and heave of the clay horizon occurring at 5 mm vertical displacement. The deformation zone attained a width of approximately 500 mm and the heave attained a maximum height of 3 mm, 70 mm from the platform edge. This occurred at an applied stress of 24.8 kPa.
At 10 mm vertical displacement, the horizontal extent of the deformation zone did not change. However, the heave of the clay reached a maximum height of approximately 9 mm, 105 mm from the platform edge. The mobilised stress had increased to 34.1 kPa.
At 15 mm vertical displacement, the heave attained a maximum height of 14 mm, with the offset increasing to 110 mm from the platform edge. The mobilised stress reached 44.7 kPa. Again, most of the deformation in the clay coincided with the width of the reinforcement.
Platform load - settlement behaviour
The loads mobilised against the platform during each centrifuge model test are plotted against the vertical platform displacement in Figure 7. The corresponding applied stresses are also indicated.
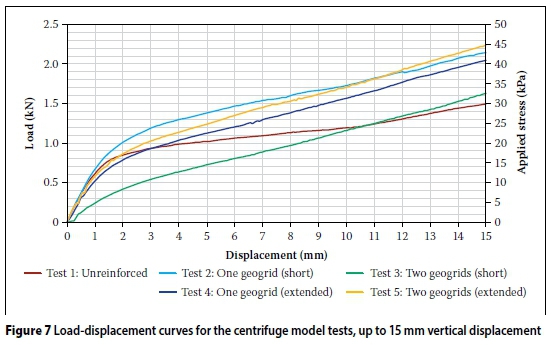
Looking at Figure 7, the loads from Tests 1, 2, 4 and 5 (i.e. the tests without reinforcement, with one short geogrid, and with one and two extended geogrids respectively) initially mobilised at very similar rates. The results from Test 3 (two short geogrids) show a very soft response and it is thought that the clay in this test might have been poorly consolidated or not thoroughly saturated, which makes comparison with the other test results difficult. This test result is therefore generally excluded from the discussions below.
The effect of the inclusion of reinforcement becomes evident after approximately 3 mm of settlement. This illustrates that some settlement is required before tensile strength is mobilised in the reinforcement. In the case of the unreinforced situation, the rate at which load is mobilised with settlement is visibly lower than for the reinforced cases beyond 3 mm settlement. This illustrates the stiffening effect provided by the reinforcement.
The results from the tests on extended geogrids (Tests 4 and 5) are very similar, with Test 5, which had two geogrids, ultimately mobilising a slightly higher load than Test 4.
Load - pore pressure
It was of interest to know the extent of the zone of influence resulting from the loading of the platform as a function of the reinforcement layout used. Load application during the centrifuge tests was rapid to model undrained construction. Undrained loading of the clay layer would have been accompanied by immediate changes in pore pressures. The magnitude of the excess pore pressures generated indicates the magnitude of total stress change acting at each particular location. Pore pressures were therefore measured at three different locations within the clay layer (illustrated in Figure 8(f)) to judge the extent of the zone of influence.
The change in pore pressure measured at three different locations with respect to the platform during each test, plotted against the applied stresses, are displayed in Figure 8. A 45° line is indicated for each test result, indicating an excess pore pressure or total stress change equal to the magnitude of the applied stress.
Figure 8(a) shows the pore pressures generated in the test without reinforcement (Test 1). The pore pressure response under the centre of the platform was initially very similar to the applied stress, up to an applied stress of about 18 kPa, due to undrained conditions. The pore pressure response under the edge of the platform was less, reflecting the reduced stress increase below the edge, as expected. The pore pressure at PPT3, located 100 mm from the edge of the platform, initially showed no response, but then suddenly began to increase beyond about 18 kPa applied stress at a rate similar to the rate of load application. That seems to suggest that the clay under the platform yielded at this point, mobilising a failure mechanism, suddenly expanding the zone of influence. This hypothesis is supported when comparing with Figure 7, where an applied stress of 18 kPa corresponds well with the point on the stress-settlement curve where the rate of settlement versus applied stress increased. The corresponding settlement was approximately 3 mm (5% of the depth of the clay layer).
Figure 8(b) (Test 2) illustrates the effect of the inclusion of reinforcement. The pore pressure response was initially very similar to that of Test 1, but PPT3 began to respond significantly earlier. This illustrates that the reinforcement expanded the zone of influence by loading clay adjacent to the platform. It is also significant to note that the rate of pore pressure increase at PPT3 is much lower than in Test 1, reflecting pre-failure conditions.
In Figure 8(c) (Test 3) it can be seen that the pore pressure response under the platform was significantly less than the magnitude of the applied load. This could indicate that the clay was not well saturated, which would explain the anomalous response referred to earlier. Despite this, it is evident that the pore pressures at PPT3 began to respond even earlier than in the case of Test 2, illustrating that the addition of a second layer of reinforcement more effectively expanded the influence zone.
The pore pressure responses at PPT1 and PPT2 with extended geogrids (Tests 4 and 5) were initially similar to Tests 1 and 2, i.e. the response under the platform reflected the applied pressure. However, PPT3 began to respond almost immediately after load application, illustrating that the wider geogrid was effective in expanding the zone of influence far into the adjacent soil.
The pore pressure at PPT3 reached a peak at an applied stress of between 20 kPa and 25 kPa, and then reduced. When compared with Figure 7, this corresponds well to the point where the rate of settlement accelerated. The pore pressure underneath the platform (PPT1 and PPT2) continued to increase linearly with increasing load. It appears that a failure mechanism was mobilised, intersecting between PPT2 and PPT3 so that there was minimal effect on PPT3 after mobilisation of the failure mechanism.
THEORETICAL ULTIMATE LOAD AND FAILURE MECHANISM
For the design of the geogrid-reinforced foundation it is necessary to assess the maximum surcharge that can be applied to the foundation system. Following SANS 207 (2006) this can be estimated using simplified equilibrium calculations, perhaps more rigorously using the principles of upper- and lower-bound plasticity theory (see for example Atkinson & Bransby 1978; Atkinson 1981; Calladine 2000), or even more rigorously by means of numerical analysis.
In the case of an upper-bound analysis, a potential failure mechanism is identified and the amount of work done by external loads is equated to the amount of internal work dissipated by the mechanism in order to solve the collapse load. It is assumed that full plastic conditions are developed on all failure surfaces. The resulting estimate gives a non-conservative or upper-bound estimate of the collapse load. Failure mechanisms can be optimised to find the most critical one. For the work presented here, the upper-bound collapse load was estimated using the software Limitstate Geo, which applies an optimisation routine to find the most critical failure mechanism and corresponding collapse load estimate. The optimised upper-bound mechanisms for the unreinforced situation are illustrated in Figure 9. An ultimate collapse load of 2.18 kN (model scale) or 43.5 kPa is predicted. When compared to the load displacement curves in Figure 7, this estimate is on the high side and is only reached at large displacements.
For the lower-bound estimate, an equilibrium stress state that nowhere exceeds the yield criterion, is postulated from which the collapse load is estimated using principles of equilibrium. This provides a conservative estimate of the collapse load. Based on the theory of plasticity, the true collapse load will occur between the upper- and lower-bound estimates. Should the two methods provide identical solutions, an exact solution to the problem would have been found (Atkinson 1981).
A potential lower-bound stress state for a clay layer being compressed between two rigid surfaces is postulated in Figure 10. The lines forming the patterns of kites and triangles represent stress discontinuities that allow the stress state to vary across discontinuities (see for example Bolton (1979) or Atkinson (1981)). In every triangle the major principal stress direction is inclined 30° to the vertical, while in the kites it is vertical. The axis of symmetry of the loaded floor is on the right, with clay being squeezed to the left.
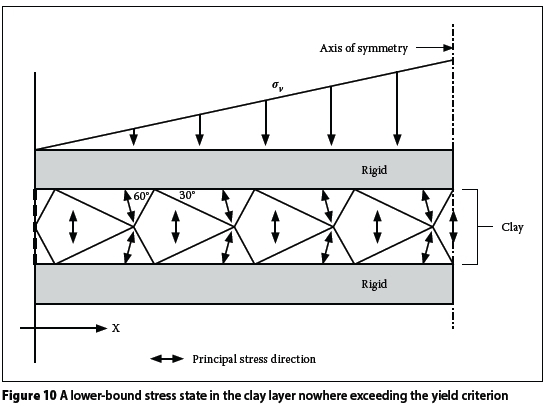
Assuming that the full undrained shear strength of the clay is mobilised in each kite and triangle allows the maximum vertical stress that can be applied to the clay layer to be determined. This maximum vertical stress (σν), i.e. a lower-bound or conservative estimate of the vertical stress required to squeeze out the clay, is given by Equation 1 and increases linearly from the unconfined edge at the left to the centre of the loaded area.
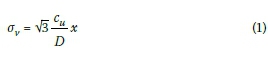
where:
cu= undrained shear strength of the clay
D = thickness of clay layer
x = horizontal distance from unconfined edge
From Equation 1 a lower bound collapse load (Fl) can be estimated as:
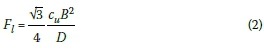
Note that other stress states providing better (i.e. less conservative) lower-bound estimates may be postulated. The lower-bound for the collapse load calculated for the unreinforced situation amounts to 0.433kN. When compared with Figure 7, this fits well with the end of the initial linear sections of the load-displacement curves, indicating that this particular lower-bound provides a realistic indication of the first onset of yielding of the clay, i.e. the point at which significant loads will begin to mobilise in the reinforcement.
DISCUSSION
This study entailed a qualitative investigation into the effects of using comparatively very strong and stiff geogrid reinforcement on the deformation mechanism below a wide, rigid surcharge on sand overlying soft clay. With the exception of Test 3, which is suspected to have suffered from poor clay saturation, the physical models provided consistent results to allow the effect of different reinforcement configurations to be assessed.
In all the centrifuge model tests there was no disturbance to the boundary between the basal sand horizon and the overlying clay horizon. As such, the interface between the two horizons behaved as a fixed boundary. The clay above the sand moved laterally at this boundary as it was squeezed out from under the applied load. The observed failure modes were typical of a strong soil overlying a weaker soil horizon (Wayne et al 1998).
In the absence of reinforcement, shear planes extending vertically downwards from the edges of the loaded platform soon cut through the sand layer, so that the platform and underlying sand punched into and compressed the clay layer. Heave occurred adjacent to the loaded platform as clay was squeezed out to the sides. At large displacements, the extent of the observed zone of influence corresponded well with the extent of the failure mechanism presented in Figure 9.
As expected, the introduction of reinforcement in the sand layer resulted in higher loads being mobilised for any given displacement (Huang & Tatsuoka 1990). Increasing the amount and extent of the reinforcement resulted in an increased mobilised load for a given displacement. The addition of reinforcement visibly expanded the zone of influence around the loaded platform, with the mode of deformation becoming that of a 'wide slab' (Huang & Tatsuoka 1990).
The expansion of the zone of influence was also detected from the pore pressure readings. As the platform was forced downward, the geogrids were also stretched downward near the platform, mobilising the tension membrane effect (Sharma et al 2009). This shifted the point of maximum heave further from the platform. At large displacements the width of the zone of influence appeared to be equal to the width of the geogrid. The maximum heave occurred within the width of the reinforcement. If an additional surcharge load can be applied to this region, it may improve the mobilisable tensile resistance of the geogrid by anchoring it more effectively into the sand layer, also potentially mitigating the amount of heave.
The initial load-settlement response from the various tests were very similar, with loads in all tests mobilising approximately linearly, with settlement up to just under 1 mm (1.7% strain in the clay layer). Thereafter, the mobilised load began to flatten off and the load-settlement response became curved. By approximately 3 mm settlement (vertical strain of 5% in the clay layer) the load again increased linearly, with further settlement but at a reduced rate. The end of the initial linear section of the load-settlement curve corresponds well with the lower-bound collapse load calculated above. This lower-bound load was calculated on the premise that nowhere had yielding of the clay occurred yet. Deformations were subsequently small, and minimal tensile strength would have been mobilised in the reinforcement.
The observation that the load settlement curves began to flatten off beyond the lower-bound estimate suggests that yielding had begun to occur. The onset of yielding, i.e. appreciable deformation of the clay, is required for the mobilisation of significant tension in the reinforcement. The flattening off of the curves beyond 3 mm (5% vertical strain in the clay) suggests that the full load that could be transferred to the reinforcement had been mobilised. Beyond this point the unreinforced model behaved plastically, with only a very gradual increase in load with further settlement as the loaded platform penetrated deeper into the underlying material. The reinforced models showed an increase in load beyond this point as more resistance was mobilised, with further platform settlement as the tension membrane effect (Sharma et al 2009) intensified. The longer geogrids mobilised loads at a greater rate (i.e. behaved stiffer) compared to the shorter geogrid, as it was able to transfer load to a larger body of soil.
Measuring the pore pressure response during loading provided a good indication of the expansion of the zone of influence during loading. Before the zone of influence reached a certain position, no pore pressure response was observed. Once the zone of influence had expanded to a location, the local pore pressure increased. Should the pore pressure peak and then level off or reduce with further settlement, it suggests that a failure mechanism had been fully mobilised and that constant volume deformation was occurring, indicating full plastic conditions. This response is evident from the pore pressures at PPT3 in the test results presented in Figure 8.
Despite being optimised to find a minimum value, the upper-bound calculation significantly over-predicted the load that could be resisted by the platform unless large displacements were mobilised. Such settlement would most likely be unacceptable in practice. The reason for the over-estimation is the result of the assumption that the entire soil mass within the zone of influence was in a state of plastic yielding, which in practice is unlikely, because the zone of yielding is likely to expand progressively with increasing load.
Future improvement to the model will include the application of a flexible rather than a rigid surcharge, and scaling down the stiffness and strength of the reinforcement. Upper-bound mechanisms, taking into account reinforcement, may be considered, but are likely to give even less conservative results than presented here.
CONCLUSIONS
A physical model study was presented, which investigated the effects of geogrid reinforcement in a sand layer constructed over very soft clay in order to facilitate the construction of warehouse floors supporting product stockpiles. The following conclusions are presented:
■ The use of reinforcement allowed larger surcharge loads to be applied for a given amount of settlement by allowing load to be spread over the footprint area of the geogrid due to the tension membrane effect and its associated benefits.
■ A lower-bound estimate was presented, allowing the surcharge load to be estimated, beyond which yielding of the clay occurred, i.e. the load at which the reinforcement began to function.
■ The optimised upper-bound mechanism overestimated the allowable surcharge, as it assumed widespread yielding of the soil, resulting in excessive deformation.
■ The reinforcing effect of the geogrid appeared to have been fully mobilised at 5% vertical compression of the clay layer. More flexible reinforcement is likely to require greater strain to fully mobilise resistance.
ACKNOWLEDGEMENTS
The authors would like to acknowledge Mr Edoardo Zannoni and Maccaferri Africa for their advice and assistance, and for supplying materials for the research. The financial assistance of the National Research Foundation (NRF) towards this research is also hereby acknowledged. Thanks are also extended to Mr Mark Richter and Mr Lionel Moore.
REFERENCES
Archer, A 2014. Using small strain stiffness to predict the settlement of shallow foundations. MEng dissertation (unpublished), Pretoria: University of Pretoria. [ Links ]
Atkinson, J H 1981. Foundations and slopes: An introduction to applications of critical state soil mechanics. New York: Wiley. [ Links ]
Atkinson, J H & Bransby, P L 1978. The mechanics of soils: An introduction to critical state soil mechanics. New York: McGraw-Hill. [ Links ]
Binquet, J & Lee, K L 1975. Bearing capacity tests on reinforced earth slabs. Journal of the Geotechnical Engineering Division, ASCE, 101(12): 1241-1255. [ Links ]
Bolton, M D 1979. A guide to soil mechanics. New York: Wiley. [ Links ]
Caladine, C R 2000. Plasticity for engineers - Theory and applications. Chichester, UK: Horwood Publishing. [ Links ]
Huang, C C & Tatsuoka, F 1990. Bearing capacity tests of reinforced horizontal sandy ground. Geotextiles and Geomembranes, 9(1): 51-81. [ Links ]
Jacobsz, S W, Kearsley, E & Kock, J 2014. The geotechnical centrifuge facility at the University of Pretoria. In: Gaudin, C & White, D (Eds.), Proceedings, 8th International Conference on Physical Modelling in Geotechnics, Perth, Australia, CRC Press. [ Links ]
Jewell, R A 1996. Soil reinforcement with geotextiles. Special Publication (Book 123) of the Construction Industry Research & Information Association (CIRIA). London: Thomas Telford. [ Links ]
Jones, B R 2014. Geotechnical centrifuge modelling of the behaviour of a compressible clay horizon underlying a reinforced sand foundation. MSc dissertation (unpublished), Pretoria: University of Pretoria. [ Links ]
Jones, B R & Van Rooy, J L 2014. Behaviour of a thin compressible clay horizon under geogrid reinforced sand with a wide platform load. In: Lollino, G, Manconi, A, Locat, J, Huang, Y & Artigas, M C (Eds.), Engineering Geology for Society and Territory, Vol 4, Cham, Switzerland: Springer International Publishing, 51-54. [ Links ]
Michalowski, R L & Shi, L 2003. Deformation patterns of reinforced foundation soil at failure. Journal of Geotechnical and Geoenvironmental Engineering, 129(5): 439-449. [ Links ]
Moore, L, Richter, M & Gillie, A 2012. The use of double twisted wire mesh steel geogrids in southern Africa. In: Fernández, M B (Ed.), Proceedings, 5th Geosynthetics Congress (EuroGeo 5), Valencia, Spain, 16-19 September. [ Links ]
SANS (South African National Standard) 2006. SANS 207: 2006 Design and construction of reinforced soils and fills. Pretoria: SABS Standards Division. [ Links ]
Sharma, R, Chen, Q, Abu-Farsakh, M & Yoon, S 2009. Analytical modelling of geogrid reinforced soil foundation. Geotextiles and Geomembranes, 27: 63-72. [ Links ]
Wayne, M H, Han, J & Akins, K 1998. The design of geosynthetic reinforced foundations. In: Proceedings, ASCE 1998 Annual Convention & Exposition, ASCE Geotechnical Special Publication 76: 1-18. [ Links ]
Zannoni, E, Freeman, T & Richter, M 2012. Basal reinforcement over soft soil using high strength bonded geogrids at Agriport Maydon Warf. In: Fernández, M B (Ed.) Proceedings, 5th Geosynthetics Congress (EuroGeo 5), Valencia, Spain, 16-19 September. [ Links ]
 Correspondence:
B R Jones
Department of Geology
University of Pretoria
Private Bag X20
Hatfield, 0028
South Africa
T: +27 12 420 5012
E: bren.r.jones@gmail.com
S W Jacobsz
Department of Civil Engineering
University of Pretoria
Pretoria, 0002
South Africa
T: +27 12 420 3124
E: sw.jacobsz@up.ac.za
J L van Rooy
Department of Geology
University of Pretoria
Private Bag X20
Hatfield, 0028
South Africa
T: +27 12 420 2023
E: louis.vanrooy@up.ac.za

BRENDON JONES completed his BSc (Hons) degree at the University of KwaZulu-Natal in 2010, joining the consulting industry thereafter, and currently he is with SMEC South Africa. In 2014 he graduated with an MSc in Engineering Geology from the University of Pretoria. He has been involved in academia as a part-time lecturer at the University of Pretoria and is studying towards his PhD at the same institution.

PROF S W Jacobsz (Pr Eng, MSAICE) graduated with an MEng degree from the University of Pretoria in 1996 and completed a PhD at the University of Cambridge in 2 0 02. He is an associate professor in the Department of Civil Engineering at the University of Pretoria, and has 20 years of design and research experience in industry and academia.

PROF LOUIS VAN ROOY started lecturing in the Department of Geology at the University of Pretoria in 1985, obtaining his PhD in Engineering Geology in 1992. His research interests include the durability of basic igneous rocks for use in construction, problem soils, safe development on dolomite land, and rock engineering. He has supervised or co-supervised more than 25 MSc and PhD students, and is the author or co-author of more than 30 papers in journals and conference proceedings. He serves on the council of SAIEG (South African Institute of Engineering and Environmental Geologists) and is the Vice-President for Africa of IAEG (International Association of Engineering Geologists).

