


Services on Demand
Article
 English (pdf)
 Article in xml format
 Article references
Indicators

Related links
-
 Cited by Google
 -
 Similars in Google
Share

 Permalink
Journal of the South African Institution of Civil Engineering
On-line version ISSN 2309-8775
Print version ISSN 1021-2019
J. S. Afr. Inst. Civ. Eng. vol.58 n.1 Midrand Mar. 2016
http://dx.doi.org/10.17159/2309-8775/2016/v58n1a6
TECHNICAL PAPER
Electricity generation as a beneficial post-closure land use option for a dormant tailings storage facility
S J van Eeden; S W Jacobsz; M Rust; E Rust
ABSTRACT
Dormant tailings storage facilities (TSFs) have negative effects on their surrounding environments and communities. This study is aimed at determining the financial and practical feasibility of generating energy from the ERGO TSF site, near Brakpan, Johannesburg, as a beneficial post-closure land use option. The beneficial post-closure options investigated were rainwater harvesting and electricity generation from wind power, photo voltaic solar power and a pump storage system constructed on the TSF. Wind power generation and rainwater harvesting from the site were found to be unviable. It was found that a 470 MW (peak capacity) solar photo voltaic plant on top of the ERGO TSF will provide the best solution, both from a practical and financial point of view, yielding a potential internal rate of return (IRR) of 10.7% over 50 years. A pump storage system yields a maximum IRR of 10.3%, but with a substantially smaller generation capacity of approximately 80 MW.
Keywords: electricity generation, solar photo voltaic system, pump storage system, tailings storage facilities, mine closure
INTRODUCTION
As a result of mining that has taken place over the last one and a half centuries in South Africa, many towns and cities have developed around mining hubs, with the most significant of these being the city of Johannesburg. Over the years, residential areas have grown around these mine sites, even well after cessation of mining activities. Mining left a legacy of derelict mining infrastructure, such as dormant mine shafts, sterilised land and abandoned tailings storage facilities (TSFs), with negative impacts on the surrounding environment and communities. This legacy is probably unique in scale compared to any country in the world. In an age where great emphasis is placed on all industries to become more environmentally conscious, mines in South Africa have a challenge to undo the negative legacy from the past. Environmental laws and regulations are becoming increasingly stringent, with the intention to mitigate or minimise the environmental impacts as far as possible.
A lack of funds and commitment from mine owners and regulators have in the past resulted in many un-rehabilitated decommissioned mines posing negative environmental impacts, including potential health hazards, on the surrounding communities. According to the Chamber of Mines of South Africa (1996), preparation for eventual closure should start as soon as possible, and the costs of closure should be regarded as an integral part of the cost of production. However, this has not often been the case. Due to the unpredictability of liability, risk and costs associated with mine closure, South African mining companies are reluctant to spend the necessary time and money on closure of facilities after years of beneficial use. Therefore, an alternative method of funding appropriate rehabilitation and closure of such facilities is required. The ideal first step in the implementation of a sustainable closure plan is to find a beneficial post-closure land use option.
South Africa currently faces an electricity shortage, and consumers regularly experience controlled load-shedding, i.e. managed power interruptions to prevent overload and subsequent collapse of the electricity supply and distribution network. South Africa is highly reliant on coal-fired power stations for the bulk of its electricity needs. These power stations have detrimental effects on the environment, due to high carbon emissions and the impact of large opencast coal mines. A global shift towards renewable energy, in combination with South Africa's current energy shortage, has forced the National Energy Regulator of South Africa to encourage greener alternatives.
This study examined the following four beneficial land use alternatives in an attempt to identify potentially beneficial post-closure land use options for dormant TSFs:
■ Electricity from wind power generation
■ Harvesting of rainwater from the TSF catchment for raw water supply
■ Electricity from photo voltaic solar power generation
■ Electricity from pump storage system power generation.
With the exception of the rainwater harvesting alternative, all options are focused on the generation of electricity. Dormant mine sites are often more favourable locations for the generation of electricity than green-field sites for the reasons listed below (Whitbread-Abrutat & Coppin 2011):
■ Large tracts of derelict land have limited post-closure land use potential. The implementation of an electricity generation system is therefore likely to have little further environmental impact and opposition. In fact, the application of renewable energy infrastructure might mitigate some environmental impacts.
■ Existing infrastructure, such as electricity transmission systems and roads, are usually in close proximity; therefore less capital expenditure is required.
■ Obtaining concessions to utilise the land is more readily achieved, because this land is not normally in high demand, as is the case with green-field sites.
■ TSFs are typically denuded and exposed, making them suitable for solar or wind power plants.
This study was aimed at finding the most beneficial land use option from the list above by examining the financial and practical feasibility of the alternatives. The rainwater harvesting and wind power generation options referred to above were abandoned early on in the study, while the two more promising alternatives, photo voltaic solar power generation and the development of pump storage systems, were investigated in more detail.
HYPOTHETICAL FEASIBILITY ANALYSIS
This study is specifically focused on mitigating the legacy of dormant TSFs. During the mining operation, a TSF is used for the hydraulic placement of finely ground rock waste. The construction method most often employed in South Africa involves deposition along the perimeter of the dam, where the coarsest material settles out first. The remainder of the slurry stream (water with suspended solids) flows to the middle of the TSF where the finest material settles out and the water is contained in the TSF pond. The surface geometry is usually slightly concave, enabling water storage. These facilities are often able to contain a significant amount of water, with the largest potentially storing several million cubic metres.
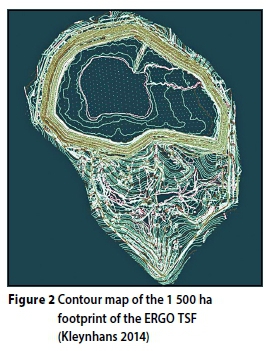
This study was based on the ERGO TSF, situated southeast of Johannesburg (see Figure 1). The ERGO TSF currently occupies the largest footprint area of all gold TSFs in the world. The final footprint area of the facility will have a combined area of 1 500 ha and is illustrated in Figure 2 (Kleynhans 2014). The ERGO TSF is used for deposition of reprocessed tailings from other TSFs scattered over the Johannesburg area. It is still operational and provides storage for between three and five million cubic metres of process water. A barge pump is currently being used to discharge water from the TSF, as the gravity penstock decant system was decommissioned some years ago. The gold content remaining in the ERGO tailings is too low to justify further processing, and hence this facility will eventually reach closure, currently envisaged for around 2050. The final maximum wall height is planned to reach 140 m above natural ground level.
This study site was chosen to maximise the benefits of economy of scale, as there are likely to be advantages in developing larger sites. It was the intention to define potential electricity generation alternatives in sufficient detail to allow a preliminary construction cost to be estimated. This, in combination with the expected income to be generated from the sale of electricity over the life of the facility, was used to assess the financial feasibility in terms of an anticipated internal rate of return (IRR) for the system.
The following assumptions were made regarding the power generation options investigated in the study:
■ According to Kleynhans (2014), the ERGO TSF is only due for decommissioning and closure in 2050, hence a hypothetical closure scenario was created. It was assumed that the ERGO TSF is decommissioned with immediate effect, having a height of 140 m above the surrounding ground level.
■ Hypothetical electricity generation was assumed to commence in January 2015, i.e. the 2015 ESKOM electricity tariff structure and associated increases were applied as discussed below to assess the system's financial feasibility.
■ Historical weather data over the last 50 years was used in this study.
■ All options were assessed over a 50-year operational life cycle. A 50-year life cycle is often adopted for hydropower projects, as these are usually associated with substantial capital investment (BHA 2005; Breeze 2005).
■ Financial feasibility was assessed based on the internal rate of return (IRR), defined as the discount rate at which the net present value of the projected cash flow (sum of all expenses and incomes) is zero. The IRR was selected as feasibility criterion instead of alternatives such as the net present value because, during the course of the study, it became apparent that the optimum scale for a photo voltaic solar plant and a pump storage system differed by an order of magnitude.
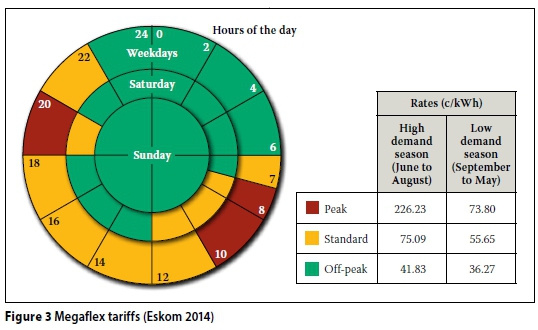
■ Eskom Megaflex tariffs (Eskom 2014) were used to estimate income. It was assumed that electricity produced by the hypothetical plant would be sold at the so-called 'Megaflex tariffs'. The Megaflex tariff structure is shown in Figure 3 and differentiates between seasonal and time-of-day use of electricity (Eskom 2014). It represents 25 'peak' hours, 62 'standard' hours and 81 'off-peak' hours per week. The electricity hypothetically generated from the alternatives investigated (in units of kWh) was multiplied with the tariff applicable at the time of generation to determine the potential income. In the case of the pump storage system, the amount of electricity consumed was taken as the calculated pumping cost.
■ An increase in the above-mentioned tariffs of 7.4% per annum to the end of the life of the electricity plant was assumed, reflecting the envisaged tariff increase for the next five years, as approved by the National Energy Regulator of South Africa.
ASSESSMENT OF WIND POWER AND RAINWATER HARVESTING OPTIONS
As mentioned earlier, the wind electricity generation and rainwater harvesting options were abandoned at an early stage of the study.
Wind records from Oliver Tambo International Airport, located not far from the ERGO TSF, date back to 1958 and show an average wind speed of only 3.3 m/s. Electricity from wind power can be profitably generated when the average wind speed exceeds 5.0 m/s for an onshore site (Breeze 2005). This indicates that the potential for wind power generation at the TSF may be insufficient. There are, however, two more aspects to consider:
■ The wind speed data was recorded at discrete times during each day on record and do not reflect the continuously recorded wind speed. However, wind speed models at 100 m elevation for South Africa also show the Gauteng area to have some of the lowest potential for wind power generation in the country (IRENA 2015).
■ Blight (2007) reported amplification of wind speeds to occur over the crest of a TSF, due to the TSF causing an obstruction in the wind flow path. Blight's models suggest that the amplification factor applicable at the crest of the final 140 m high ERGO TSF could cause wind velocities of the order of about three times the wind speed typically recorded with an anemometer at a weather station (typically installed at 10 m above ground level). Currently, however, there is not enough data available to enable the financial viability of wind power harvesting from high TSFs. Following Breeze (2005), it is recommended that a study be carried out to measure continuous wind speeds on a number of high TSFs for a period of one year to further evaluate the available wind resource.
The rainwater harvesting option was also abandoned at an early stage of the study, as calculations indicated that it is not financially feasible. If it is desired to supply potable water from such a system, the dam would have to be lined. The cost of a suitable lining is prohibitive. For example, the cost of a liner comprising a 1.5 mm thick HDPE membrane with nominal base preparation is estimated to cost in excess of R165 per square metre. Lining the current area of 856 ha will therefore cost in excess of R1.4 billion. The cost of importing raw water from the Lesotho Highlands Water Project (LHWP) was recently reported as only R2.32 per cubic metre (DWS 2014). Should the water from the rainwater harvesting scheme be sold at this rate, an IRR of only 2.4% would be realised over 50 years.
ASSESSING THE FEASIBILITY OF SOLAR PHOTO VOLTAIC ELECTRICITY GENERATION
Photo voltaic electricity
Solar cells or photo voltaic (PV) cells convert sunlight to electricity and consist of a sandwich of several layers of material. The semiconductor most often used in solar cells is silicon, one of the most abundant elements on earth, the main constituent of silica sand (Zweibel 1990). However, although silicon is widely available and therefore cheap, the production of pure silicon used in solar cells is energy-intensive, requiring up to 90 kWh for every kilogram of silicon produced. Therefore, a solar cell typically has to be operational for two years to produce the electricity required to manufacture the cell itself (Breeze 2005). PV cells produce direct current (DC) electricity which requires an inverter to convert it to alternating current (AC) before it can be fed into the electricity grid.
The efficiency of a solar system is measured as light-to-electricity conversion efficiency (Zweibel 1990). The efficiency of commercially available crystalline silicon cells is in the order of 15% (Yingli Solar 2012). The technology behind PV cells has improved significantly since its inception and is still improving. This results in a decrease in cost over time, rendering PV electricity generation systems increasingly cost-competitive. Between 1973 and 1990 the average global cost of PV has reduced about 20 times, and will likely reduce further in the future (Zweibel 1990).
Silicon technology has now been around for a considerable time, and its reliability, long-term operation, plant lifetime and operation are well understood. The power generation potential of any site on earth therefore can be determined if its solar radiation resource is known (Breeze 2005).
Environmentally, solar PV electricity is regarded as one of the most benign renewable energies. It does not emit any atmospheric emissions during operation and does not create any noise. Solar plants are easily erected and can be constructed in a short space of time if the components are readily available (Breeze 2005).
Single solar cells are arranged into modules. These modules (solar panels) are then grouped into arrays, which make them easier to install. Grouping solar cells together can generate a significant amount of power. The following factors influence the output of a solar plant:
■ The quality and angle of sunlight
■ The orientation of the panels
■ The configuration and number of solar panels (a function of the area available)
■ The efficiency of the panels
■ The use of a tracking system allowing the panels to re-orientate themselves to follow the sun (fixed, single or double-axis tracking)
■ The degradation rate of the plant (i.e. performance reduction over time)
■ The use of sunlight concentration by means of mirror systems or not.
Determining the available solar resource
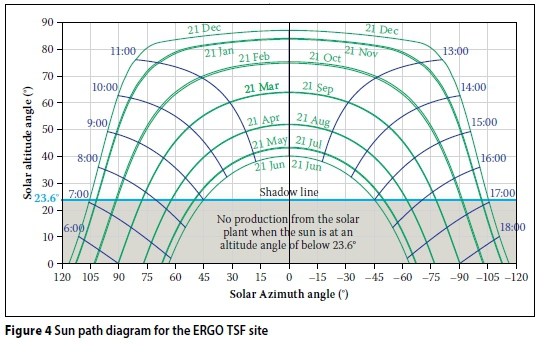
Masters (2004) presented a series of equations enabling the potential solar resource to be quantified. The equations allow a sun-path diagram to be calculated, describing the position of the sun at any time of the year (see Figure 4).
With the position of the sun known, the incoming solar radiation flux (kW/m2) can be determined. This includes direct beam and diffused solar radiation. Radiation reflected from surrounding surfaces was assumed to be negligible.
The radiation on a horizontal surface was calculated and compared to data from NASA (2014) to validate the calculated values. The NASA data also enabled cloud cover to be considered, based on data from the International Satellite Cloud Climatology Project (NASA 2014). The calculated data correlated well with that of NASA.
With the calculated radiation data verified and cloud cover taken into consideration, the electricity production from inclined solar panels could be determined as a function of their orientation. For cost reasons fixed panels were assumed, i.e. no tracking system.
The layout of panel arrays was determined to ensure full sunlight on the panels between 09:00 and 15:00 during the winter months. The shadows cast by adjacent panels on one another early in the morning and late afternoon were considered by conservatively assuming that, if the sun is at an altitude angle of lower than 23.6°, production would be zero.
The variation in the calculated solar flux is discussed in a later section below.
The proposed system and its optimisation
The layout of the plant and the number of panels are dependent on the orientation of each panel, i.e. its direction and tilt angle. This was optimised to provide the highest possible IRR. Although the results show that production is maximum when the panels face directly north, the IRR was found to be somewhat higher if the panels are turned 16.3° east-of-north. The reason for this is the current Eskom peak tariffs applicable between 07:00 and 10:00 during week days.
The optimisation of the tilt angle showed that the panels produce the maximum output when orientated at a tilt angle of 22.5° with the horizontal, i.e. towards the summer solstice position, which takes advantage of the long periods of exposure during the summer months. However, the highest IRR is generated when the panels are placed at a tilt angle of 27.6°, closer towards the winter solstice, taking advantage of the increased tariffs during the high-demand season applicable during the winter months.
The optimum solar panel orientation therefore comprises panels orientated 16.3° east-of-north and tilting at 27.6° relative to the horizontal. Each panel has dimensions of 1 650 mm by 990 mm. They are arranged in arrays of six panels high by 40 panels wide, 15 arrays per block section, with 535 block sections in total. This orientation allows for a total of 1.93 million panels to be placed on the 726 ha top surface area of the ERGO TSF at closure to produce a rated power output of 472 MWp (MWp refers to 'Mega Watt peak', the predicted peak power output).
Indicative cost estimates for this project were obtained from commercial suppliers of large-scale photo voltaic systems in South Africa. The cost of supply and installation of the complete system, including solar panels, mounting structures, direct current cables and inverters was estimated at approximately R22 per Watt peak of installed generation capacity. This rate was used as a first-order estimate for the construction cost of the plant. This rate is applicable to large-scale projects and is not valid for costing small-scale projects, and is based on Yingli Solar's YGE 60 Cell 40 mm Series 245 Wp Panels (Yingli Solar 2012) with an efficiency of 15%. A panel's 'watt peak' output is a term used in the solar PV industry to standardise solar panels according to their performance under standard test conditions, as specified in IEC 60904-3 (IEC 2006). In this case a single panel (size 1 650 mm by 990 mm) with an efficiency of 15% produces an electrical output of 245 W when exposed to a global standard spectrum at 1 000 W/m2 irradiance at 25°C cell temperature.
The system described here does not include battery storage, an item that requires a significant amount of maintenance. Once installed, the solar plant will require minimal maintenance. The system can in principle be controlled via a remote computer, and therefore no personnel are required on site (Breeze 2005). Occasional cleaning and servicing of panels might be required. The costs of these were deemed to be negligible compared to the overall cost of installation.
Predicted daily electricity production
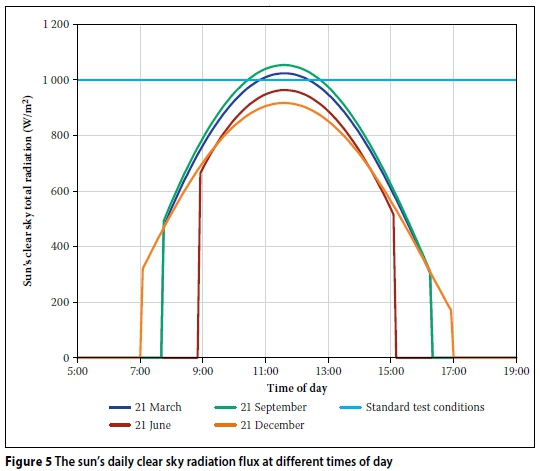
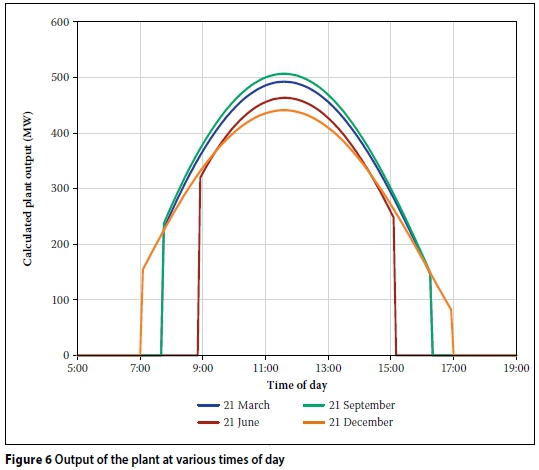
The daily plant production will vary depending on the solar declination, the applicable cloud cover factor and the duration of exposure to sunlight. To illustrate the projected daily plant output, four dates were chosen, i.e. 21 December (summer solstice), 21 March (autumnal equinox), 21 June (winter solstice) and 21 September (spring equinox). The results presented apply to the first year of operation with no time-related deterioration considered.
Figure 5 illustrates the sun's radiation flux per square metre of solar panel, calculated using the formulas by Masters (2004), i.e. the energy that could be captured with a hypothetical 100% efficient solar panel. The 21 December curve has the longest exposure time, corresponding to the longest day in Figure 4, but produces the lowest peak value. That is due to the tilt angle that was optimised to favour the winter solstice to benefit from the high-demand season rates applicable during winter. For the same reason, although the exposure time is shorter during the winter solstice, the production peak is higher than the summer solstice. It is also interesting to note that, during the middle of the day, around the time of the spring and autumnal equinoxes, the sun's potential exceeds that of the standard test conditions (1 000 W/m2) under clear sky conditions. Hence, the output from a single solar panel would theoretically be higher than the nominal rated power output of 245 Wp assumed in the determination of the IRR.
The output of the entire plant (under ideal clear sky conditions, i.e. no cloud cover) is shown in Figure 6. It can be seen that the plant's generation capacity can exceed 500 MW under ideal circumstances, although the rated power output is 472 MWp. This is of the same order of magnitude as the Topaz Solar Farm (currently the largest solar PV plant in the world), which has a rated power output of 550 MWp (PV Magazine 2014).
Electricity production and associated income
By integrating the area underneath the 'output vs time' curves in Figure 6, and allowing for the cloud cover factor (derived from the NASA data) and plant degradation, the expected daily production from the plant was calculated at an average of 2.6 GWh, reducing linearly over the 50-year life of the plant to 1.6 GWh. The following degradation rates, expressed as percentage change in the rated output per annum, were assumed to account for the degradation of the solar panels' performance over the life of the facility as per the manufacturer's warrantee (Yingli Solar 2012):
■ 0 to 10 years of operation: 0.88% per annum
■ 10 to 25 years of operation: 0.70% per annum
■ 25 to 50 years of operation: assumed an average of 0.70% per annum.
The daily production (kWh) was multiplied with the electricity tariffs applicable at the time of generation (as illustrated in Figure 3) to determine the expected daily income during the 50-year life. Table 1 summarises the details of the optimal solar plant layout that can be built on the ERGO TSF.
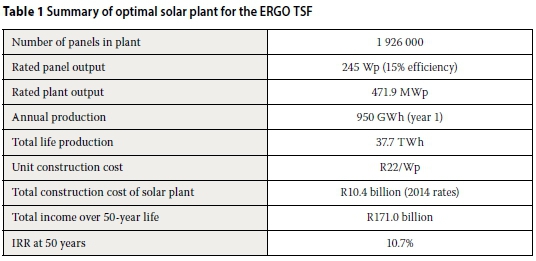
The proposed system in Table 1 compares well with the largest existing solar PV plant, the Topaz Solar Farm in California. The Topaz Solar Farm uses smaller and thin film technology, which is known to have a lower efficiency than crystalline silicone. The generation capacity is 550 MWp, and the annual electricity production is expected to be 1.096 GWh.
Reliability and sensitivity analyses
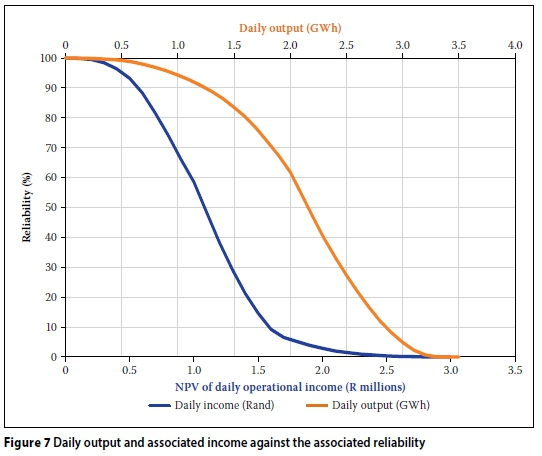
A reliability analysis was conducted on the calculated electricity production data, by plotting distribution histograms and fitting normal distributions to the data, to assess the level of certainty that the solar plant will produce a certain amount of electricity (GWh) or income on any given day. Figure 7 presents daily generation capacity and associated profit against the associated level of confidence. It was found that the solar plant will produce 1.25 GWh/day, generating R550 000 (in 2014 monetary value, i.e. no inflation taken into account) with a confidence level of 90%.
The series of sensitivity analyses were conducted to determine the effect of the various assumptions made in this study on the calculated IRR. The following parameters were varied, each around their expected range, to determine the sensitivity of the IRR over a 50-year lifetime to each parameter, whilst keeping all other variables constant:
■ Deterioration rate of solar panel efficiency after 25 years (assumed 0.7%/annum, varied between 0.6 and 1.5%/annum).
■ Unit cost of construction (assumed R22/Wp, varied between R17 and R25 /Wp).
■ Surface area covered by solar plant (assumed 726 ha, varied to as low as 250 ha).
It was found that varying the reduction in solar panel performance stated above changed the IRR by between only 10.72% and 10.49%, and that it had a small effect on the plant's total life production, predicted to vary between 38.0 TWh and 35.5 TWh depending on the rate of deterioration. Probable deviations in panel-efficient degradation over 25 years should therefore only have a minor effect on the IRR.
The IRR was found to be sensitive to a change in unit cost of construction (assumed to be R22/Wp), with an increase in IRR of up to 12.4% if the unit price is reduced to R17/Wp. This is positive for the future of solar technology, as technology often becomes cheaper over time.
Due to the constant unit price of R22/Wp used for calculation, the surface area available for construction does not affect the IRR, hence the plant can be constructed in stages and can be applied to smaller TSFs. Note that it was assumed that the plant would be sufficiently large for the economy of scale unit construction cost of R22/Wp to apply.
FEASIBILITY ANALYSIS OF PUMP STORAGE SYSTEM ELECTRICITY GENERATION
Pump storage systems entail the accumulation of water in an upper reservoir and then releasing it in a controlled manner to drive a hydro turbine to generate electricity, usually when the electricity demand is high. The released water then accumulates in a second lower reservoir located at a lower elevation. This water is then pumped back into the upper reservoir during so-called off-peak periods, when there is surplus electricity available in the national electricity grid. The viability of such a system requires a surplus of electricity at certain times to function (i.e. to pump the water back to the upper reservoir). It is therefore essentially a method of energy storage where the potential energy of water stored in the upper reservoir can be released and converted into electricity when needed.
The possibility of converting the abandoned ERGO TSF into a pump storage system was assessed. For this purpose, the pond on top of the dam, located at an elevation of 140 m above the surrounding ground level, can in principle be converted to an upper reservoir, while a lower reservoir has to be constructed below the facility. Inlet/ outlet structures need to be constructed at the upper and lower reservoirs, as well as the necessary water conduits, turbine/pump combinations, generators and electricity reticulation systems.
Costing a pump storage system
In order to determine the volume of water available for electricity generation, a water balance simulation was conducted based on the historical rainfall record of the last 50 years (1964 to 2013). The water balance simulation takes the following into account:
■ Rainfall runoff from the TSF and lower reservoir catchments
■ Evaporation from the open water pond surface
■ Seepage from the pond into the tailings material.
The rainfall runoff was calculated by multiplying the recorded daily rainfall (mm) with varying catchment areas and varying runoff factors. Daily evaporation was estimated with the FAO-56 Penman-Monteith equation (Valiantzas 2013). Seepage was taken into account using Darcy's equation. For more detail please refer to Van Eeden et al (2014). The water balance simulation showed that the volume of water stored on the TSF would vary between about 1 and 6 million cubic metres over the duration of the rainfall record (1964 to 2013) in the absence of any releases. From the water resource available, the release rate between the upper and lower reservoirs was varied to determine the optimal combination of required infrastructure and electricity generation capacity that would result in the highest IRR. The required infrastructure was costed using generic formulas by Saini and Singal (2008, modified by Van Vuuren et al 2011). This included the capital cost of the electro-mechanical equipment, civil works and annual cost of maintenance and operation. An additional cost of R400/m3 was allowed for the construction of the lower reservoir, based on recent cost estimates of another project.
Accounting for the expected income from electricity sales was done in a similar manner as for the Solar PV option, and a maximum IRR of 10.27% was calculated.
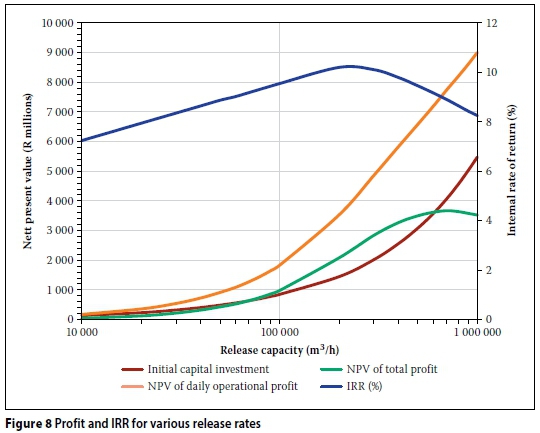
Figure 8 presents the results of the theoretical optimisation exercise, with the blue curve showing the IRR for a range of release capacities. The optimum pump storage system will have a generation capacity of 78.2 MW, with an associated release rate of 230 000 m3/h (64 m3/s). Table 2 summarises the details of the optimal pump storage system. The table contains the costs of the required infrastructure for the optimal system using the generic formulas by Saini and Singal (2008, modified by Van Vuuren et al 2011).
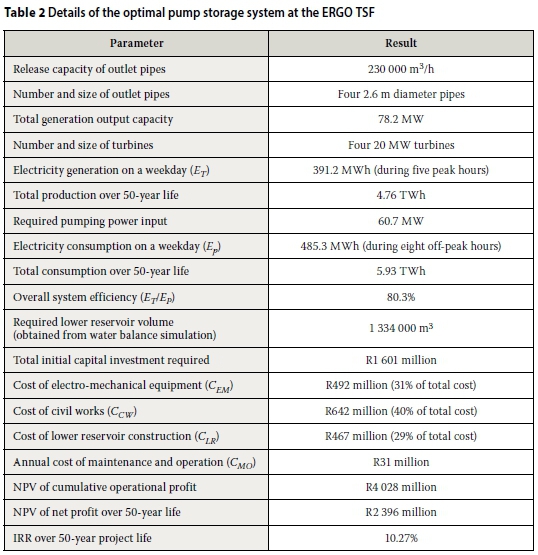
In order to convey water at such a high flow rate of 64 m3/s, a large inlet structure and outlet conduit are required. In fact, to maintain the recommended 3 m/s flow velocity in the outlet pipe, a single 5.2 m diameter outlet pipe has to be installed. However, due to practical reasons, it might be better to split it up into four 2.6 m diameter outlet pipes, each with its own 20 MW turbine. Both the pumps and the turbines were assumed to have efficiencies of 90%. These calculations are based on the assumption that the TSF catchment can be used as is, i.e. the TSF basin will not be lined. The option of lining the basin is discussed below.
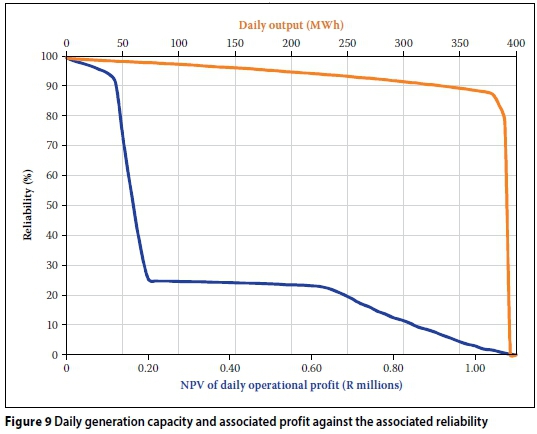
Reliability of daily plant production and associated income
A reliability analysis was conducted on the calculated electricity production data to evaluate the level of confidence that the pump storage system would produce a certain amount of electricity (GWh) or operational profit on any given day. The production is primarily dependent on the amount of water available in the upper reservoir. Figure 9 presents daily generation capacity and associated profit against the associated level of confidence. The calculations show that 90% of the time the system will produce at least 330 MWh on a weekday (during the five peak consumption hours). There is a 90% chance that the plant will produce at least R120 000 (in net present monetary value) on a week day. There is a 25% chance that the plant will produce at least R200 000 and a 23% chance that the plant will produce at least R620 000. This is due to the difference in tariffs applicable to the high- and low-demand seasons, respectively from June to August and September to May.
A series of sensitivity analyses were conducted to determine the effect of various assumptions made during the course of the study on the calculated IRR. The following parameters were varied within their expected ranges, whilst keeping the other variables constant, to determine their effect on the IRR (over a 50-year lifetime):
■ Size of catchment area (assumed to be 1 500 ha, varied to as low as 100 ha)
■ TSF height (assumed to be 140 m, varied to as low as 30 m)
■ Outlet pipe flow velocity (assumed to be 3 m/s, varied between 1 and 10 m/s)
■ Turbine and pump system efficiency (assumed to be 90%, varied between 75 and 95%).
The IRR was most sensitive to the height and the catchment area of the TSF, as these are both directly related to the amount of potential energy available from a specific TSF that can be exploited. This indicates that smaller/ lower TSFs might not provide feasible post-closure land use options. The IRR also proved to be sensitive to the other assumptions made (outlet pipe velocity and pump/ turbine efficiencies), but these are controllable variables that can be engineered. It is therefore important that the assumptions be refined if this design is to be implemented. The most important aspects to confirm are the total contributory catchment area and the head which drives the turbines.
Lining the TSF basin
The most sensitive aspect governing the performance of the pump storage system is the availability of water for power generation. If the runoff from the catchment can be improved and seepage limited, more water will be available for electricity generation. The TSF basin can potentially be lined with an impermeable barrier system, such as high-density polyethylene (HDPE).
The water balance was repeated, predicting a TSF pond volume varying between 7 and 20 million cubic metres of water available for electricity generation. The cost of lining the basin was estimated at R165/m2 and was included in the analysis. The optimal release rate in this case was found to be approximately 1.4 million m3/h (or 390 m3/s), giving a generation capacity of 478 MW and an IRR of 10.14%. That is a release rate six times higher than that of the unlined option.
Accommodating a flow rate of 390 m3/s from a tailings dam poses significant challenges. If it is assumed that the release system described above (i.e. a series of 2.5 m diameter conduits) can be expanded to provide the necessary release capacity, a total of 27 2.5 m diameter outlet pipes, each with its own 18 MW turbine, would be required. This may in principle be possible, as there is ample space available on top and around the facility. However, many engineering challenges associated with the construction of such a system on a tailings dam would have to be addressed during the design phase. These include, for example, a methodology for the installation of the inlet/outlet structures and water conduits in tailings, and how to allow for the settlement that is likely to occur. Addressing these practicalities falls outside the scope of this study.
VIABILITY OF THE SOLAR PV AND PUMP STORAGE SYSTEMS
The optimal Solar PV option in terms of IRR will cost R10.4 billion and produce 472 MWp, giving an IRR of 10.70%. This will, however, only produce power when the sun shines, and its performance will deteriorate somewhat with time. In comparison, the optimum hydro-power system (in terms of IRR) is small, with a generating capacity of only 78 MW (17% of that of the photo voltaic system). This is due to the limited amount of water available for power generation. The most significant factor limiting the amount of water available on the TSF for hydropower generation is seepage losses. These losses can be virtually eliminated by lining the facility.
The unlined TSF pump storage scheme option will cost R1.6 billion (15% of the PV option) and, as long as there is water in the top reservoir and sufficient space in the lower reservoir, there is 78 MW generation capacity that can be utilised at any time of day. This results in an IRR of 10.27%. The lined TSF pump storage scheme option will cost R9.9 billion (95% of the PV option) and has a capacity of 478 MW (almost exactly matching the Solar PV option), resulting in an IRR of 10.14%. However, the construction of a hydropower system is associated with numerous technical difficulties that will have to be addressed, whereas the construction of a Solar PV system is relatively simple, with the major challenge probably being a founding solution for the numerous solar panels. A system of mini-piles is envisaged.
CONCLUSIONS
Despite mining activity having benefited South Africa on a probably unsurpassed scale compared to the rest of the world, it has also left a negative legacy in terms of derelict land, un-rehabilitated mine sites, impacts on groundwater, abandoned tailings storage facilities impacting negatively on the environment, etc. These impacts result in costly mitigation. A number of beneficial land use options were investigated to make productive use of dormant tailings storage facilities, i.e. rainwater harvesting, wind power generation, photo voltaic solar power generation and conversion of a TSF to a pump storage system for electricity generation. These were evaluated with the large ERGO TSF southeast of Johannesburg in mind. Should land use options not be economically feasible on a facility of this scale, it is unlikely to be economical on smaller TSFs, due to factors associated with the economy of scale.
Rainwater harvesting was found to be prohibitively costly, due to the requirement of lining the TSF in combination with the low selling price of water. Wind power generation was abandoned due to the low ambient wind velocities in the Gauteng area. However, following Blight (2007) it is recommended that a study be carried out to evaluate the effect of wind speed amplification over high tailings storage facilities, as this may possibly render small-scale wind power generation systems economical.
Both the construction of a photo voltaic solar power electricity generation system and a pump storage system on the TSFs were predicted to offer returns on the capital investment in excess of 10%. However, the construction of a pump storage system on a tailings dam is associated with many engineering challenges, while a large number of solar panel arrays can readily be installed on the surface of a tailings dam, provided that a suitable foundation solution be devised. This is not expected to be problematic. It is therefore concluded that the most beneficial land use option for a dormant tailings storage facility from those investigated is the installation of a solar power electricity generation system. With the large number of disused and abandoned TSFs scattered around Gauteng, their utilisation to house Solar PV systems can contribute significantly to reduce their negative impacts, while contributing positively to the province's electricity supply.
ACKNOLEDGEMENTS
The following institutions made this study possible:
a. The Green Fund which provided the funding for this project. The Green Fund is an environmental programme implemented by the Development Bank of Southern Africa (DBSA) on behalf of the Department of Environmental Affairs (DEA). Opinions expressed and conclusions arrived at are those of the authors and are not attributed to the Green Fund, DBSA or DEA.
b. DRDGold Limited, who kindly provided the background information of the site.
c. The South African Weather Service for supplying the weather data for the study.
REFERENCES
BHA (British Hydropower Association) 2005. A Guide to UK Mini-Hydro Developments, Version 3.0. Wimborne, UK: The British Hydropower Association. Available at: http://www.british-hydro.org, [ Links ]
Blight, G E 2007. Wind erosion of tailings dams and mitigation of the dust nuisance. Journal of the South African Institute of Mining and Metallurgy, 107(2): 99-107. [ Links ]
Breeze, P 2005. Power Generation Technologies, e-book. Amsterdam: Elsevier. [ Links ]
Chamber of Mines of South Africa 1996. Guidelines for environmental protection. Volume 1. The engineering design, operation and closure of metalliferous, diamond and coal residue deposits. Johannesburg: Chamber of Mines. [ Links ]
DWS (Department of Water and Sanitation, formerly DWAF) 2014. Approved domestic and industrial raw water tariffs (WARMS) 2014/15. Available at: http://www.dwaf.gov.za/Projects/WARMS/Revenue/WRI%20D&I.pdf. [ Links ]
Eskom 2014. Schedule of standard prices. Available at: http://www.eskom.co.za/tariffs. [ Links ]
IEC (International Electrotechnical Commission) 2006. IEC 60904-3. Photovoltaic devices. Part 3: Measurement principles for terrestrial photovoltaic (PV) solar devices with reference to spectral irradiance data, ed. 2.0. Geneva: IEC. [ Links ]
IRENA (International Renewable Energy Agency) 2015. Wind resource maps of the Global Atlas. Available at: http://www.irena.org/globalatlas. [ Links ]
Kleynhans, L 2014. Personal communication with Mr Louis Kleynhans, a horticultural expert for DRDGold who is responsible for the rehabilitation of their remined sites. [ Links ]
Masters, G M 2004. Renewable and Efficient Electric Power Systems. Hoboken, NJ: Wiley. [ Links ]
NASA 2014. Surface meteorology and solar energy - A renewable energy resource web site, release 6.0. Available at: https://eosweb.larc.nasa.gov/sse/. [ Links ]
PV Magazine 2014. World's largest solar plant in operation. Available at: http://www.m.pv-magazine.com/news/details/beitrag/worlds-largest-solar-plant-in-operation_100017288. [ Links ]
Saini, R & Singal, S 2008. Cost analysis of low head dam-toe small hydropower plants based on number of generating units. Energy for Sustainable Development, 12(3): 5-60. [ Links ]
Van Eeden, S J, Jacobsz, S W, Rust, E & Rust, M 2014. Feasibility of a pump storage scheme development on a dormant tailings storage facility. Proceedings, Hydro 2014 Conference, Cernobbio, Italy, 13-15 October. [ Links ]
Van Vuuren, S J, Blersch, C L & Van Dijk, M 2011. Modelling the feasibility of retrofitting hydropower to existing South African dams. Water SA, 37(5). WRC 40-year Celebration Special Edition. [ Links ]
Whitbread-Abrutat, P H & Coppin, N J 2011. Exploring alternative energy options for mine sites. Proceedings, 6th International Conference on Mine Closure, Alberta, Canada, Volume 2, pp 559-568. [ Links ]
Valiantzas, J D 2013. Simplified forms for the standardized FoA-56 Penman-Monteith reference evapotranspiration using limited weather data. Journal of Hydrology, 505: 13-23. [ Links ]
Yingli Solar 2012. YGE 60 Cell 40 mm series product brochure. DS_YGE60Cell-29b_40mm_EU_ EN_201211_v02.20. Available at: http://www.yinglisolar.com. [ Links ]
Zweibel, K 1990. Harnessing Solar Power. The Photovoltaics Challenge. New York: Plenum Press. [ Links ]
 Correspondence:
STEPHAN VAN EEDEN
19 Marlowe Road, Cambridge, CB3 9JW, United Kingdom
E: vaneedensj@gmail.com
SW JACOBSZ
Department of Civil Engineering
University of Pretoria
Pretoria 0002. South Africa
T: +27 12 420 3124
E: sw.jacobsz@up.ac.za
MARTIN RUST
Jones &Wagener
Engineering & Environmental Consultants
PO Box 1434, Rivonia 2128, South Africa
T: +27 11 519 0200
E: rust@jaws.co.za
EBEN RUST
Department of Civil Engineering
University of Pretoria
Pretoria 0 002, South Africa
T: +27 12 420 3286
E: eben.rust@up.ac.za

STEPHAN VAN EEDEN graduated in civil engineering from the University of Pretoria, South Africa, whereafter he gained four years of design experience with a consulting firm in Johannesburg. He was also involved with the design of a number of tailings storage facilities, which included feasibility studies and water balance modelling in a number of countries across Africa. He is currently busy with his Master's degree dissertation, which is based on a research project titled "The use of dormant urban mine sites to achieve greener cities".

PROF SW JACOBSZ, who has 20 years of design and research experience in industry and academia, graduated with an MEng from the University of Pretoria in 1996 and a PhD from the University of Cambridge in 2002, both in Geotechnical Engineering. He is currently an Associate Professor in the Department of Civil Engineering at the University of Pretoria.

DR MARTIN RUST, who is a technical director at Jones and Wagener, a consulting firm in Johannesburg, South Africa, graduated with a PhD from the University of Southampton, England. He is a geotechnical engineer with 16 years of design experience.

PROF EBEN RUST, completed his BSc(Eng) at the University of Pretoria in 1977. He spent ten years in practice as a geotechnical consultant before joining the University of Pretoria as a lecturer. In 1996 he obtained his PhD from the University of Surrey. Apart from lecturing he is involved in research in the fields of fundamental soil mechanics and in-situ testing.

