


Serviços Personalizados
Artigo
 Inglês (pdf)
 Artigo em XML
 Referências do artigo
Indicadores

Links relacionados
-
 Citado por Google
 -
 Similares em Google
Compartilhar

 Permalink
Journal of the South African Institution of Civil Engineering
versão On-line ISSN 2309-8775
versão impressa ISSN 1021-2019
J. S. Afr. Inst. Civ. Eng. vol.57 no.4 Midrand Out./Dez. 2015
http://dx.doi.org/10.17159/2309-8775/2015/v57n4a7
TECHNICAL PAPER
Chloride conductivity testing of concrete - past and recent developments
M Otieno; M Alexander
ABSTRACT
The chloride conductivity index (CCI) is a quality control parameter used to assess the resistanc of concrete to chloride ingress. It is determined from the chloride conductivity (CC) test which has been in use in South Africa for close to two decades. During this time, it has undergone a number of changes to improve on its robustness, reproducibility, and repeatability. Plans are now under way to incorporate the test and other durability index tests (oxygen permeability and water sorptivity) into the SANS standards, and it is important that the end user is aware of the changes and why they were made. Specifically, aspects concerning a new design of the CC testing rig which is already in use, and a modified old design which is still being used in some laboratories, are highlighted, such as the significant but variable differences in CCI results that could occur between the old and new CC test rigs. Experimental investigations were carried out to establish the cause of these differences, which was identified as largely due to possible incomplete filling of the original device. Modifications were therefore made to the old CC test rig to ensure that both the new and the modified CC test rigs give similar results.
INTRODUCTION
The paradigm shift from prescriptive to performance-based durability design and specification of concrete structures has faced many challenges, not only in South Africa, but also around the world. These challenges include possible increased initial project costs, changing the mindset of practising concrete engineers and contractors, selection of suitable materials, quantification of severity of exposure environments, and development and standardisation of durability tests. Nevertheless, strides have been made to overcome these challenges, and in South Africa the combined efforts of researchers, engineers, contractors and cement manufacturing companies have seen the concrete industry adopt the durability index (DI) tests for concrete durability design and specification. The DI tests encompass chloride conductivity (CC), oxygen permeability (OP) and water sorptivity (WS) tests, and were developed as a result of collaborative research efforts at the Universities of Cape Town and the Witwatersrand, with support from the concrete industry. The DI tests have been in use in South Africa for close to two decades, and have been subjected to various tests to assess their robustness, reproducibility and repeatability, including international round-robin tests (Gouws et al 2001; Stanish et al 2006; Beushausen & Alexander 2008). The ultimate goal is to incorporate these tests into the South African National Standards (SANS), and plans are already under way to realise this.
This paper focuses on the chloride conductivity test, which is used to assess the resistance of concrete to chloride penetration. Like any other test, the testing equipment, operator experience and materials used are just as important as the testing process itself. Common sources of error in this test include improper specimen conditioning (i.e. oven-drying followed by vacuum-saturation with 5M NaCl solution), use of wrong concentration of the salt solution in the test, incorrect circuit connection (incorrect test set-up), and incomplete filling of the luggin capillaries and the anode and cathode compartments with the salt solution. The latter source of error (i.e. incomplete filling of the luggins and the compartments) mainly relate to the design of the CC test rig, although operator experience can also contribute to the errors.
In an attempt to limit the probability of occurrence of these errors, a number of changes have been made to the design of the CC test rig over the years, and it is important that the end user is made aware of these changes, i.e. why the changes were made, and how they affect the results, if at all. This is the purpose of this paper, but first a brief background of the CC test is given.
BRIEF BACKGROUND ON THE CHLORIDE CONDUCTIVITY TEST
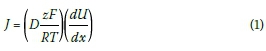
The CC test, developed by Streicher (1997), is a rapid chloride conduction test used to assess the intrinsic potential of a given concrete (or mortar) to resist the ingress of chlorides by diffusion. However, in the test, chlorides penetrate the test specimen by migration (also referred to as conduction, electro-diffusion or accelerated diffusion) due to a potential difference induced in the test set-up. The two transport mechanisms (diffusion and migration) can be related by the Nernst-Planck equation (Bockris et al 1981; Andrade 1993):
where
J = unidirectional flux of the ionic species (mol/cm2s)
D = diffusion coefficient of the ionic species (cm2/s)
z = electrical charge of ionic species (ionic valence)
F = Faraday's constant (96500 C/mol)
T = absolute temperature (K)
U = potential difference (voltage) across the sample (V)
x = a distance variable (cm)
R = universal gas constant (8.314 J/mol-K)
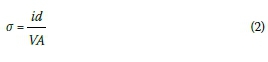
A detailed test procedure is available in the Durability Index Testing Manual (DI Manual 2010). In summary, nominally 70 ± 2 mm diameter, 30 ± 2 mm thick concrete discs are prepared, typically from cored specimens. Four specimens (discs) are tested for each concrete. Prior to testing, the specimens are dried in an oven at 50°C for not less than seven days and not more than eight days. The specimens are then vacuum-saturated with 5M NaCl solution before being placed in a test rig with a cell filled with the same salt solution on either side. A 10 V potential difference is applied across the specimen, and the current through the specimen is measured in a very short time (typically 10 seconds). The chloride conductivity index (CCI) is then calculated using the formula (Streicher & Alexander 1995):
where
σ= chloride conductivity index of the specimen (mS/cm)
i = electric current through the specimen (mA)
V = voltage difference across the specimen (V)
d = average specimen thickness (cm)
A = cross-sectional area of the specimen (cm2)
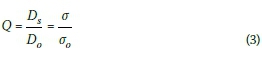
Chloride penetration resistance of a given concrete increases with decrease in σand vice versa. Values of σ typically vary from < 0.5 mS/cm for dense chloride-resistant concretes to > 2.5 mS/cm for very penetrable concretes. The chloride conductivity is fundamentally related to steady state diffusivity (Ds) by the Nernst-Einstein equation, which relates the conductivity of a bulk material to its Dsas follows (Bockris et al 1981; Garboczi & Bentz 1992):
where
Q = diffusivity ratio
σ= conductivity of concrete (S/m)
σ(3 = conductivity of the pore solution (S/m)
Ds= steady state diffusivity of chloride ions through concrete (m2/s)
Do = diffusivity of chloride ions in the equivalent pore solution (m2/s)
However, in reality non-steady-state conditions exist, and the chloride diffusion is represented by an apparent diffusion coefficient (Da). This limits the application of the Nernst-Einstein equation. Therefore the CCI (σ) is empirically related to the (apparent) chloride diffusion coefficient (Da) which is used in service life design (Mackechnie & Alexander 1996). Practically the diffusion coefficient determined from σ is dependent on the binder type, age of concrete and marine exposure environment (Mackechnie 2001). This means that concretes made using different binder types can exhibit the same CCI, but different diffusion coefficients. This is mainly due to differences in chloride binding capacities of different binders (Arya et al 1990).
THE CHLORIDE CONDUCTIVITY TEST SET-UP AND TESTING RIG
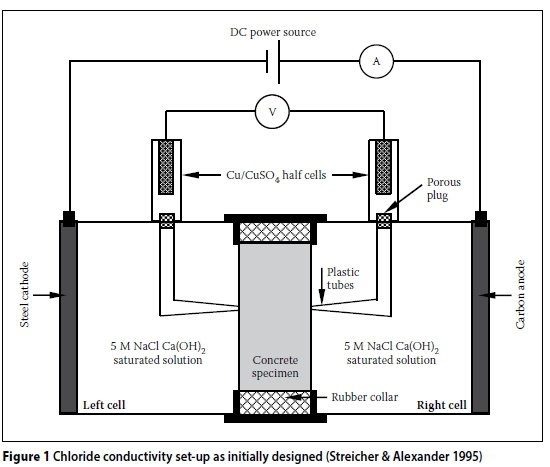
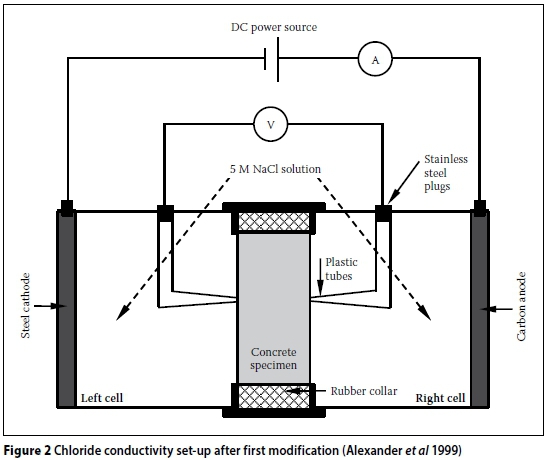
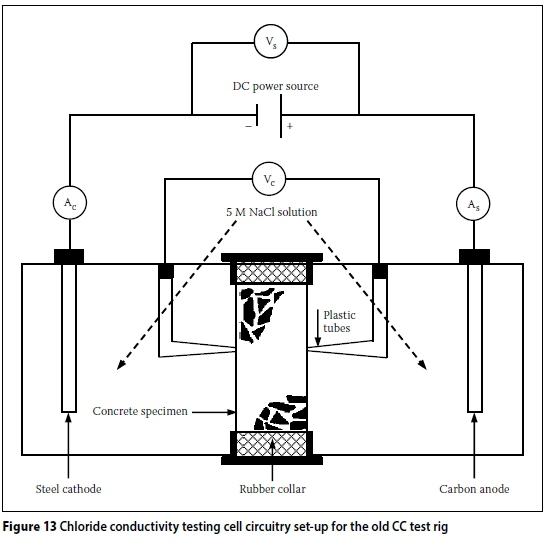
The design of the CC test rig and set-up can contribute to systemic errors. The initial CC test set-up developed by Streicher (1997) is shown in Figure 1. Initially, 5M NaCl in saturated Ca(OH)2 solution was used. However, Streicher and Alexander (1995) showed that Ca(OH)2 has a negligible effect on the conductivity of the salt solution. Therefore, subsequent test set-ups used only 5M NaCl solution. Furthermore, the Cu/CuSO4half cells were also omitted in subsequent test set-ups, as the voltage across the specimen could be accurately measured directly by replacing the porous plugs with stainless steel plugs (Figure 2). The modified CC test rig, shown in Figures 3 and 4, will be referred to as the "old CC test rig" in this paper.
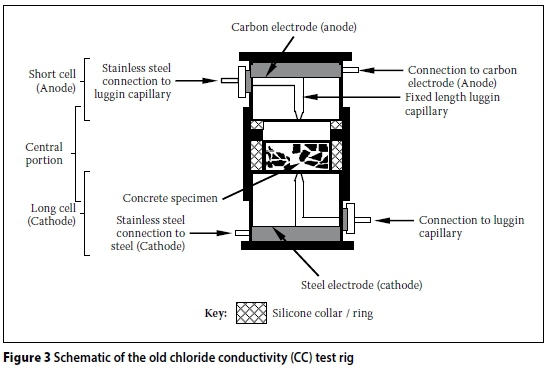
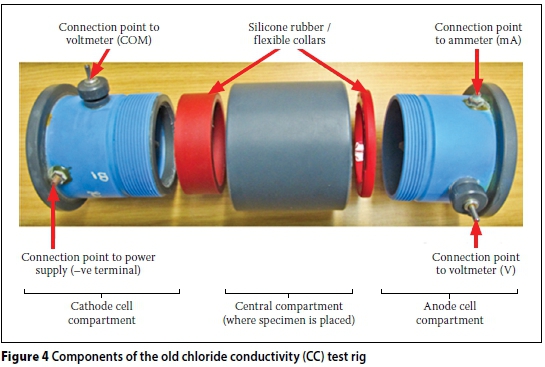
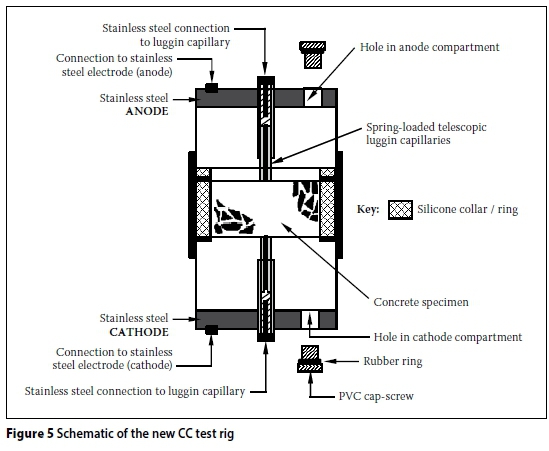
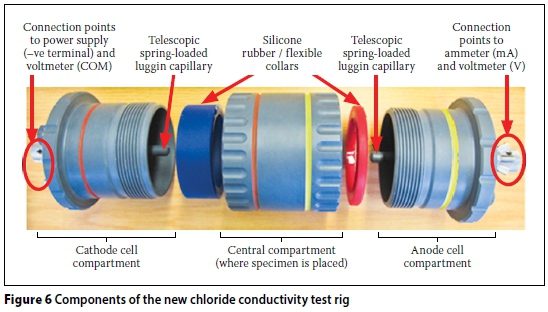
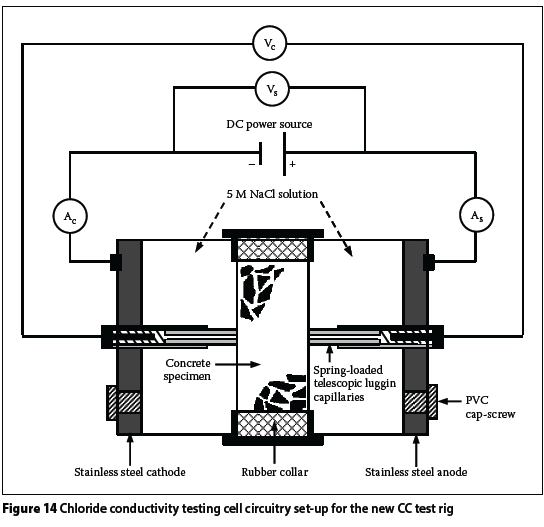
The CC test rig shown in Figures 3 and 4 has been used virtually since the inception of this test. More recently (circa 2012), a "new CC test rig" was developed. A schematic representation of the new CC test rig is shown in Figures 5 and 6. The new CC test rig encompasses the following changes (with respect to the old CC test rig):
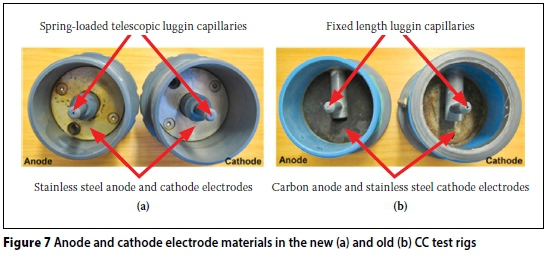
i. The carbon anode is replaced with a stainless steel anode, i.e. both the anode and cathode are now made using stainless steel - Figure 7(a) and (b).
ii. The fixed length luggin capillaries are replaced with telescopic spring-loaded ones - Figures 7 and 8.
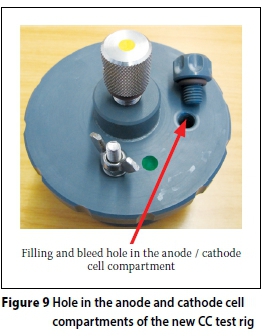
iii. A hole has been drilled in both the anode and cathode compartments to facilitate easier filling with 5M NaCl solution -Figures 5 and 9.

These design changes were motivated for the following reasons:
i. Use of stainless steel as both the anode and cathode electrode - this was not only driven by practical and cost considerations, but also by similar test set-ups used in other standard tests in which stainless steel is used as both the anode and cathode material, e.g. the Standard test method for electrical induction of concrete's ability to resist chloride ion penetration (ASTM 2012). Early proving trials showed that replacing the carbon anode with stainless steel had no effect on measurements.
ii. Replacement of fixed length luggin capillaries with telescopic spring-loaded ones -even though the 5M NaCl solution has very high conductivity (213.7 mS/cm (Streicher 1997)), the luggin capillaries are meant to facilitate accurate measurement of the voltage across the test specimen only. The tips of the luggin capillaries should therefore be as close to the specimen surface as possible. The telescopic luggin capillaries enable this to be achieved, especially when specimens of varying thickness are tested.
iii. A hole drilled in both the anode and cathode compartments - these ensure complete filling of the anode and cathode compartments with the 5M NaCl solution before testing.
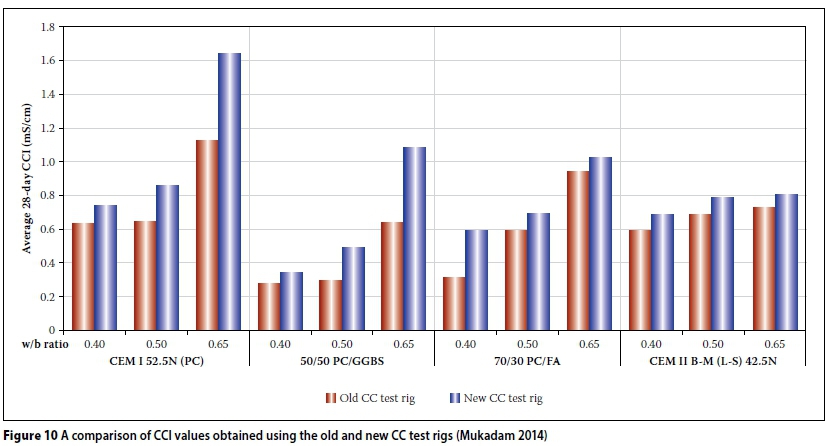
In order to ensure that the robustness, accuracy and repeatability of the CC test were not compromised, it was necessary to assess the effect(s), if any, of these changes on the test values, which are current (i) through, and voltage ( V across, the specimen. It was required that the old (Figure 3) and the new (Figure 5) CC test rigs should give similar results if the same concrete specimen is tested at the same age in both rigs. An initial detailed assessment of the performance of the new CC test rig in comparison to the old one was conducted by Mukadam (2014) whose study showed that (Figure 10):
i. In general, for a given concrete (binder type and w/b ratio) the new CC test rig consistently gave higher CCI values than the old one. However, there was no consistency in the differences in the CCI values between the two CC test rigs. For a given binder type, concretes with higher w/b ratios resulted in higher differences in CCI values between the two rigs than those with lower w/b ratios.
ii. Even though there were differences in CCI values between the two rigs, the trends in CCI values for a given binder type and w/b ratio were consistent for the two test rigs, with CCI values increasing with increasing w/b ratio and vice versa, as expected.
Mukadam (2014) suggested three possible causes of this difference, summarised as follows:
i. Difference in electrode material: the use of stainless steel for both the anode and cathode material in the new CC test rig as opposed to stainless steel cathode and inert carbon anode in the old one.
ii. Use of telescopic (new CC test rig) versus fixed length (old CC test rig) luggin capillaries.
iii. Presence of air bubbles in the old CC test rig which could potentially block the migration of chloride ions, causing a decrease in the current registered, and as a result a lower conductivity. However, it was not clear in his work whether the "air bubbles" were entrapped in the luggin capillaries, anode and cathode compartments, or both.
The findings by Mukadam (2014) were the genesis of an exploratory investigation to find out the cause(s) of the differences in CCI values between the old and new CC test rigs. However, after a critical review of the three possible causes, (i) and (ii) were found unlikely to be the source(s) of the difference in CCI values between the two test rigs due to the reasons given earlier. Focus was therefore placed on (iii) even though the reason given by Mukadam (i.e. "... air bubbles blocking the migration of chloride ions") was not clear because it could potentially occur in either of the rigs, and would therefore be random in nature.
Further experimental tests were needed, but before these could be carried out, a critical review of Mukadam's raw data (Mukadam 2014) was necessary. The review showed that the difference in the CCI values between the old and new CC test rigs emanated only from the difference in the measured current through the test specimen; all the other parameters (i.e. specimen geometry and voltage across the specimen) remained unchanged. Mukadam's results showed that a higher current through the test specimen was recorded in the new CC test rig than in the old one, even though the voltage across the specimen was, as required, kept constant at 10 V. The review of Mukadam's results and a careful assessment of the old CC test rig led to the hypothesis that the difference in the CCI values obtained using results from the old and new CC test rigs was due to incomplete or variable filling of the anode and cathode compartments with 5M NaCl solution during the test, specifically of the old CC test rig, and not due to blocking of chloride ion migration by air bubbles entrapped in the system (luggin capillaries, anode and cathode compartments, or both) as suggested by Mukadam (2014). The following section further explores this hypothesis.
Cause and effect of incomplete filling of the anode and/or cathode compartments with 5M NaCI solution
Cause: The design of the old CC test rig and the procedure used to assemble it during the test makes it susceptible to incomplete filling of the anode and/or cathode compartments (especially the cathode cell compartment -see Figure 11(a)) with the 5M NaCl solution). This is not the case in the new CC test rig where the anode and cathode compartments are filled through the holes in the compartment ends (see Figures 5 and 9). However, care should still be taken when filling the new CC test rig with the salt solution to avoid entrapping air bubbles in either the anode or cathode compartments (and even in the telescopic luggin capillaries).
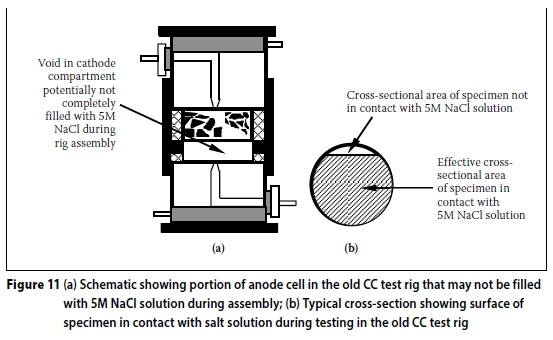
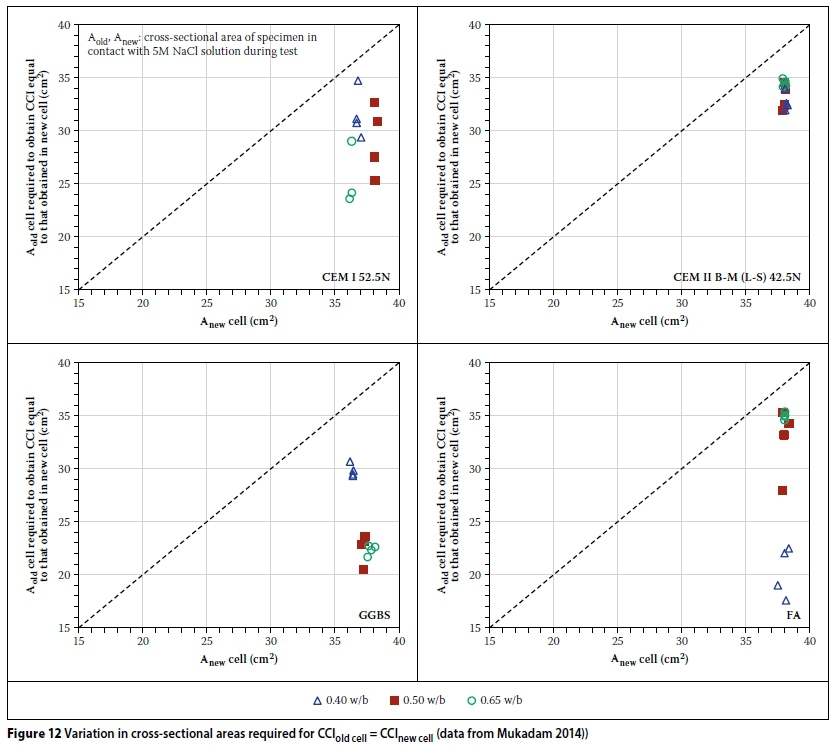
Effect: Incomplete filling of the anode and cathode compartments in the old CC test rig leads to over-estimation of the cross-sectional area of the specimen when calculating the CC index using Equation 2, which assumes that the whole surface area of the specimen's cross-section is in contact with the salt solution during the test when it is carried out with the test rig assembly in a horizontal position. If the whole cross-section area of the specimen is not in contact with the salt solution during the test (Figure 11(b)), the current through the specimen is smaller than if it were fully in contact with the salt solution - this will be shown later in the results obtained from tests carried out. Theoretically, the conductivity of a given material will increase with increasing cross-sectional area (Urone et al 2013), i.e. conductivity is inversely proportional to cross-sectional area (in contact with the 5M NaCl solution). Over-estimation of the specimen cross-section leads to under-estimation of the CCI and explains the lower currents reported by Mukadam (2014) in the old CC test rig compared to the new one.
A further critical analysis of Mukadam's results (Mukadam 2014) showed that, in order to obtain similar CCI values in the old CC test rig as those in the new one, lower cross-sectional areas are required (see Figure 12). This confirms that the whole surface area of the specimen was not in contact with the salt solution during the test. However, determining the actual surface area of the specimen in contact with the salt solution during the test is not practically feasible or desirable.
SERIES I EXPERIMENTS: ASCERTAINING MuKADAM'S (2014) RESULTS
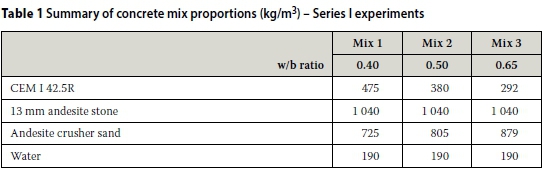
In order to ascertain Mukadam's (2014) results with respect to the trends in CCI values obtained using both the old and new CC test rigs, three concrete mixes were made using CEM I 42.5R and three w/b ratios (0.40, 0.50 and 0.65). The mix proportions are summarised in Table 1. Three 100 mm cubes were cast for each mix. After casting, the concrete cubes were covered with a plastic sheet in the laboratory for 24 hours after which they were demoulded and cured under water at 23 ± 2°C for 28 days. After curing for 28 days, two 100 mm concrete cubes for each mix were cored to make test specimens (70 ± 2 mm diameter χ 30 ± 2 mm discs) for testing in the old and new CC test rigs.
The circuitry used for the CC tests using either the old or new CC test rig was slightly modified to enable the recording of the supply voltage (Vs) and current (Ac) - see Figures 13 and 14. In the standard CC test, only the luggin capillary voltage (Vc) and supply current (As) are measured - these are adequate for the calculation of the CCI using Equation (2). The additional parameters were measured because this was an exploratory experimental investigation. In summary, the following parameters were measured during the CC testing (see Figures 13 and 14):
i. Supply voltage (Vs), i.e. voltage supplied by the power supply
ii. Capillary voltage (Vc), i.e. voltage across the test specimen
iii. Current "to" the test specimen (As), i.e. from the power supply
iv. Current "from" the test specimen (Ac). The above measurements were recorded simultaneously using an Agilent 34970A data logger (fitted with Agilent 34901A 20 channel multiplexer module) connected to a desktop computer. Theoretically, for the series circuits shown in Figures 13 and 14:
i. Vs> Vc
ii. As= Ac
The specimens were tested following the procedure outlined in the DI Manual (2010) to the letter, except for the assembly procedure for the new CC test rig with respect to filling the luggin capillaries and anode and cathode compartments with the 5M NaCl solution. For a given concrete, the same set of four specimens for each concrete mix was tested in both the old and new CC test rigs. During the testing process using the two rigs, the following were noted:
i. It was easier and less time-consuming to assemble the new CC test rig than the old one. This is attributed to the improved ergonomic design and the colour-coding used in this rig (see Figure 6).
ii. Filling of the anode and cathode compartments with 5M NaCl solution took a slightly longer time in the new CC test rig than in the old one.
Series I results and discussion
The results obtained from the Series I experiments showed the following:
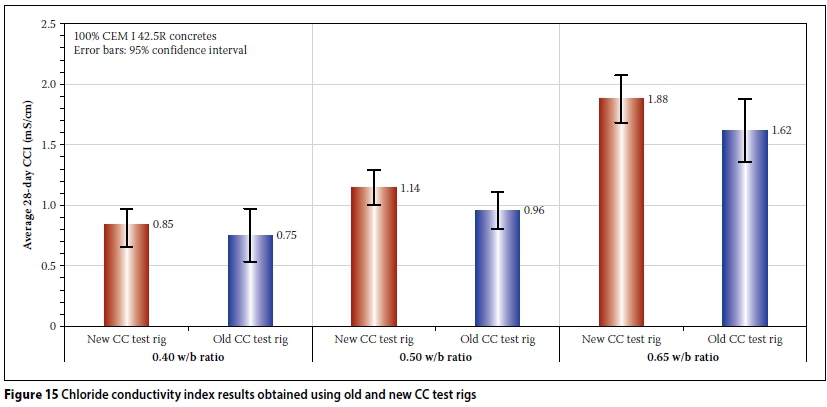
i. As expected, the average 28-day CCI values increased with increase in w/b ratio regardless of the CC test rigs used (old or new) - Figure 15. Increase in CCI depicts decreased resistance of a concrete to chloride penetration (Alexander et al 1999).
ii. The CCI values calculated using results from the new CC test rig were consistently higher than corresponding ones calculated using results from the old CC test rig - Figure 15.
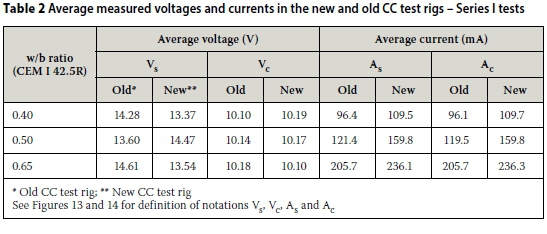
iii. For a voltage of ~10 V across the specimen, a higher current through the specimen is measured in the new CC test rig than in the old one - Table 2.
iv. The results also show that, as expected, Vs > Vc and As = Ac in both the new and old CC test rigs - Table 2. Furthermore, the results show that a higher supply voltage (Vs) is needed in the old CC test rig than in the new one to ensure that the voltage across the test specimen (Vc) is ~10 V as required.
These results, except for (iv), corroborate those of Mukadam (2014); Mukadam (2014) only reported Vc and As. The trend in (iv) further confirmed the hypothesis that the differences in CCI values between the old and new CC test rigs are due to incomplete filling of the anode and/or cathode cell compartments with the 5M NaCl solution in the old CC test rig. It is interesting to note from Figure 15 that the error bars from the old and new CC test rigs overlap completely, or largely, for the different w/b ratios. Thus, statistically the sets of results can be considered statistically similar for each w/b ratio, implying that in practice differences are relatively small. As stated earlier, the conductivity of a test specimen decreases with decrease in "wetted" cross-sectional areas. Therefore, for a series circuit like the one used in the CC test, a higher voltage thrust will be required to ensure that the voltage across the specimen in the old CC test rig, whose whole cross-section area is not in contact with the salt solution during testing (Figure 11), is ~10 V. The increased resistance of the test specimen, due to decreased cross-sectional area conducting the current, results in a lower current through the specimen in the old CC test rig than in the new one. This is consistent with Ohm's law, i.e. V = IR where V is the voltage, I is the current through the conductor and R is the resistance (or its inverse, conductance) of the material (Abbott 1989). However, it was suspected that the difference in the supply voltages (Vs) between the old and new CC test rigs was, to some extent, also due to the difference in electrode materials used in both rigs - carbon anode and stainless steel cathode in the old CC test rig, and stainless steel anode and cathode in the new CC test rig. This was explored in the next series of tests presented later in this paper in which the influence of incomplete filling of the anode and cathode compartments was eliminated.
It was necessary to test experimentally the hypothesis that incomplete filling of the anode and/or cathode cell compartments with the 5M NaCl solution in the old CC test rig was the cause of the difference in CCI values between the old and new rigs. A second series of tests was therefore carried out. This is presented in the following section.
SERIES II EXPERIMENTS: TESTING THE HYPOTHESIS OF INCOMPLETE FILLING OF THE ANODE AND CATHODE COMPARTMENTS WITH SALT SOLUTION IN THE OLD CC TEST RIG
In order to test experimentally the hypothesis that the differences in CCI values between the old and new CC test rigs were due to incomplete filling of the anode and/ or cathode cell compartments in the old CC test rig, two options were available:
i. develop a method to quantify the actual surface area of the test specimen in contact with the 5M NaCl salt solution during the test, or
ii. ensure that the whole cross-section of the test specimen is in contact with the 5M NaCl salt solution during the test.
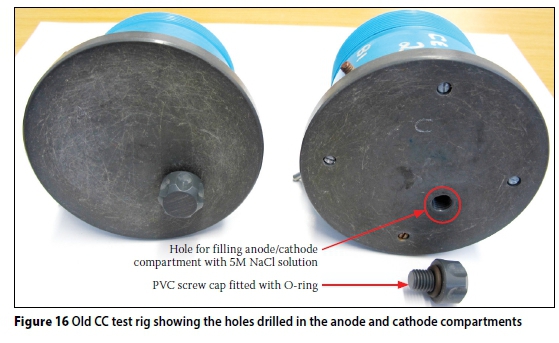
After a careful assessment of the practical feasibility of each option, option (ii) was pursued. In order to ensure that the whole cross-section of the test specimen is in contact with the 5M NaCl salt solution during the test, it was necessary to make sure that the anode and cathode compartments were completely filled with the salt solution. This was achieved by modifying the old CC test rig by drilling a hole (~8.7 mm diameter) in both the anode and cathode compartments of the old CC test rig (Figure 16), similar to the holes in the new CC test rig (Figure 5 and 9). After filling the compartments with the salt solution, the holes were closed using PVC screw caps, as is the case in the new CC test rig.
In this series, chloride conductivity tests were then carried out on in laboratories at the Universities of Cape Town (UCT) and the Witwatersrand (WITS) for comparison purposes. Different specimens were tested in both laboratories, but this did not affect the objective of the tests, i.e. to test the same specimens in both the new and modified old CC test rig. Each laboratory had its own set of CC test rigs. The following should also be noted about the specimens tested in this series of tests at either the UCT or WITS laboratory:
i. At the WITS laboratory, the same concrete specimens that were used in Series I tests were again used in the new CC test rig and the modified old one (with holes for filling the anode and cathode cell compartments with salt solution). After Series I tests, the specimens were left submerged in 5M NaCl solution for 113 days; the specimens were therefore tested at the age of 148 days after casting. However, testing age was not important, so long as the same specimens were tested in both the modified old and new CC test rigs at the same age.
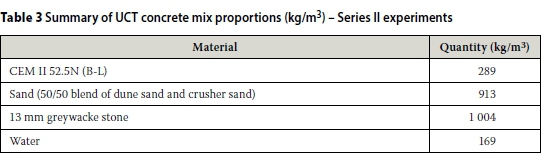
ii. At the UCT laboratory, test specimens were prepared from 100 mm cubes of the same concrete mix of a recent study; three 100 mm cubes were cast using the concrete with a w/b ratio of 0.58 and CEM II 52.5N (B-L), with minimal quantities of ground granulated corex slag and limestone. The mix proportions are summarised in Table 3. After casting, the concrete cubes were covered with a plastic sheet in the laboratory for 24 hours, after which time they were demoulded and cured under water at 23 ± 2°C for 28 days. After curing for 28 days, two 100 mm concrete cubes were cored to make test specimens (70 ± 2 mm diameter χ 30 ± 2 mm discs) for testing. Each specimen was tested first in the modified old CC test rig, and then immediately in the new CC test rig.
Series II results and discussion
The results obtained from the Series II experiments from both UCT and WITS laboratories can be summarised as follows:
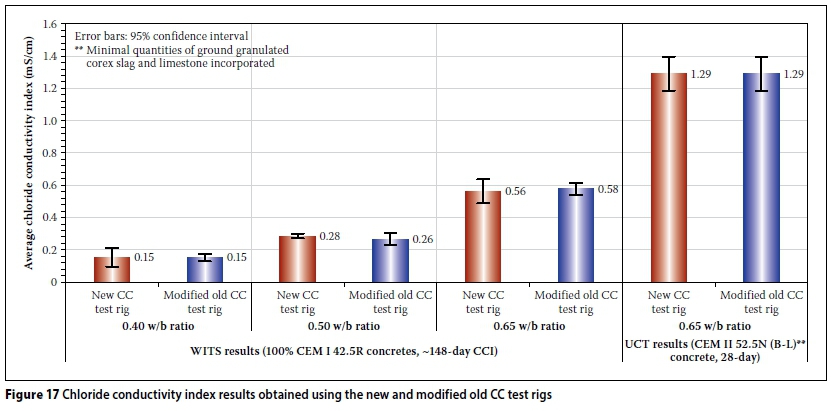
i. The average 148-day CCI values (WITS results) increased with increase in w/b ratio, regardless of the CC test rigs used (new and modified old) - Figure 17. This trend was expected, and corresponds to that obtained in Series I experiments. However, the CCI values obtained in Series II experiments are considerably lower than those of Series I experiments due to the difference in age (i.e. microstructure densification due to continued cement hydration and a degree of chloride binding) of the specimens at testing - 28 days and 148 days in Series I and II experiments respectively.
ii. The CCI values calculated using results from either the new or modified old CC test rig are consistently statistically the same for the various concretes tested in the two laboratories - Figure 17.
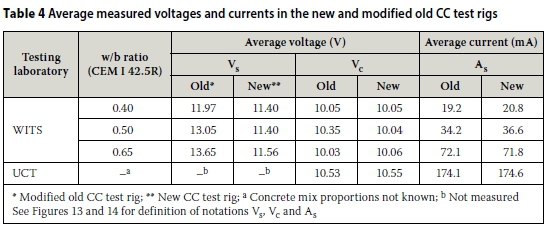
iii. For a voltage of ~10 V across the specimen, similar currents through the specimen are measured in both the new and modified old CC test rigs - Table 4. In the case of the WITS results where As and Ac were measured, even though not reported here, I As = Ac in both the new and modified old CC test rigs, as in the Series I experiments. iv. The WITS results show that, as expected, Vs > Vc in both the new and modified old CC test rigs - Table 4. The results also show that, similar to Series I experimental results, a higher supply voltage (Vs) is still needed in the modified old CC test rig than in the new one to ensure that the voltage across the test specimen (Vc) is ~10 V as required. In Series I experiments, the trend in (iv) was attributed partly to incomplete filling of the anode and/or cathode cell compartments with the 5M NaCl solution in the old CC test rig, and partly due to the difference in electrode materials in the old (carbon anode and stainless steel cathode) and new (stainless steel anode and cathode) CC test rigs. However, in Series II experiments, the influence of the contribution of incomplete filling of the anode and/ or cathode compartments was eliminated by completely filling these compartments through the holes drilled in them as shown in Figure 16. Therefore, in the WITS results, the higher Vs values recorded in the modified old CC test rig compared to the new one can be reasonably assumed to be due to difference in electrode material used in the two rigs. Nevertheless, the supply voltage (Vs) does not affect the CC test results, because a series circuit is used in the test. Regardless of the Vs value during the test, it is important to ensure that a ~10 V potential difference (Vc) is created across the test specimen before the corresponding current (As) is recorded, as was done consistently and correctly in Series I and II experiments.
The results of Series II experiments therefore confirm that the differences in CCI values, which were essentially due to a difference in the measured currents through the different test specimens (see Table 2), had been caused by incomplete filling of the anode and/or cathode compartments of the old CC test rig with 5M NaCl solution. In the Series II experiments where the old CC test rig was modified to ensure the anode and cathode compartments are completely filled with the salt solution, the measured currents through the different test specimens were sensibly the same, as were the CCI values.
CONCLUDING REMARKS AND THE WAY FORWARD
Based on the results of the experiments presented in this paper and those of Mukadam (2014), and taking into consideration that the chloride conductivity test is in the process of being incorporated into SANS standards, it is prudent that the larger South African concrete construction industry be aware of the design changes and modifications made with respect to the test rig. These are summarised as follows:
1. The old CC test rig can continue to be used, but it should be modified by drilling a hole in both the anode and cathode compartments to facilitate complete filling of these chambers with the 5M NaCl solution. This will ensure that:
i. consistent chloride conductivity results (especially the current through the specimen) are obtained, and
ii. results obtained using the new and modified old CC test rigs are similar (or statistically the same).
Laboratories using the old CC test rig can contact the authors of this paper to facilitate its modification as mentioned above. Contact can also be made with Mr Eike von Guerard of Secundum Engineering Services cc in Cape Town (T: +27 21 551 1734, M: +27 84 250 4430, E: secundum@ blitsweb.com).
2. A new CC test rig is now being manufactured for use in the CC test. The old CC test rig will no longer be manufactured. The new CC test rig has the following characteristics:
i. Telescopic spring-loaded luggin capillaries
ii. A hole each in both the anode and cathode compartments
iii. Stainless steel anode and cathode
iv. It is colour-coded and has improved ergonomic design to facilitate easy assembly during the test.
Both the new and modified old CC test rigs will give similar results, and either can be used for testing the penetration resistance of a concrete to chloride ingress. However, it is important to highlight the following aspects of the CC test that will continue to require the attention of the user to ensure that reliable results are consistently obtained:
1. The luggin capillaries should be completely filled with the 5M NaCl solution before the test is carried out. In the process of filling the luggin capillaries, care should be taken to avoid entrapping air bubbles.
2. The CC cell assembly (both the new and modified old test rigs) should be placed standing vertically on a level surface when being filled with the 5M NaCl solution through the holes in the anode and cathode compartments to ensure that it is fully filled with the salt solution.
3. The test voltage across the specimen is read from the voltmeter (correctly connected across the luggin capillaries); it is not the voltage indicated in the DC power supply.
4. Inter-laboratory tests: laboratories are encouraged to participate in round-robin tests from time to time to check the reproducibility and repeatability of the test results.
REFERENCES
Abbott, A F 1989. Physics, 5th ed. Oxford: Heinemann. [ Links ]
Alexander, M G, Streicher, P E & Mackechnie, J R 1999. Rapid chloride conductivity testing of concrete. Research Monograph No. 3., University of Cape Town and University of the Witwatersrand. [ Links ]
Andrade, C 1993. Calculation of chloride diffusion coefficients in concrete from ionic migration measurements. Cement and Concrete Research, 23(3): 724-742. [ Links ]
Arya, C, Buenfeld, N R & Newman, J B 1990. Factors influencing chloride binding in concrete. Cement and Concrete Research, 20(2): 291-300. [ Links ]
ASTM 2012. ASTM-C1202-12 2012. Standard Test Method for Electrical Indication of Concrete's Ability to Resist Chloride Ion Penetration. West Conshohocken, PA, US: ASTM International. [ Links ]
Beushausen, H-D & Alexander, M G 2008. The South African durability index tests in an international comparison. Journal of the South African Institution of Civil Engineering, 50(1): 25-31. [ Links ]
Bockris, J, Conway, B, Yeager, E & White, R E (Eds.) 1981. Comprehensive Treatise of Electrochemistry, Vol. 4 of Electrochemical Materials Science, New York: Plenum Press. [ Links ]
DI Manual 2010. Durability index testing procedure manual, Version 2.0. Cape Town: Department of Civil Engineering, University of Cape Town. [ Links ]
Garboczi, E J & Bentz, D P 1992. Computer simulation of the diffusivity of cement-based materials. Journal of Materials Science, 27(8): 2083-2092. [ Links ]
Gouws, S M, Alexander, M G & Maritz, G 2001. Use of durability index tests for assessment and control of concrete quality on site. Concrete Beton, 98: 5-16. [ Links ]
Mackechnie, J & Alexander, M G 1996. Marine exposure of concrete under selected South African conditions. Proceedings, 3rd ACI/CANMET International Conference on the Performance of Concrete in Marine Environments, St. Andrews, Canada, pp. 205-216. [ Links ]
Mackechnie, J R 2001. Predictions of reinforced concrete durability in the marine environment. Research Monograph No. 1, Department of Civil Engineering, University of Cape Town and University of the Witwatersrand. [ Links ]
Mukadam, Z 2014. Critical review of the South African durability index tests, with possible improvements. MSc dissertation, Cape Town: Department of Civil Engineering, University of Cape Town. [ Links ]
Stanish, K, Alexander, M & Ballim, Y 2006. Assessing the repeatability and reproducibility values of South African durability index tests. Journal of the South African Institution of Civil Engineering, 48(2): 10-17. [ Links ]
Streicher, P E 1997. The development of a rapid chloride test for concrete and its use in engineering practice. PhD thesis, Cape Town: Department of Civil Engineering, University of Cape Town. [ Links ]
Streicher, P E & Alexander, M G 1995. A chloride conduction test for concrete. Cement and Concrete Research, 25(6): 1284-1294. [ Links ]
Urone, P P, Hinrichs, R, Dirks, K & Sharma, M 2013. College Physics. Houston, TX, US: Rice University (OpenStax College) (Reviewed by Christensen et al, p. 703). [ Links ]
 Correspondence:
MIKE OTIENO
School of Civil and Environmental Engineering
University of the Witwatersrand
Johannesburg
Private Bag X3
WITS 2050
South Africa
T: +27 (0)11 717 7117
E: mike.otieno@wits.ac.za
MARK ALEXANDER
Department of Civil Engineering University of Cape Town
Private Bag X3 Rondebosch 7700
Cape Town
South Africa
T: +27 (0)21 650 4012
E: mark.alexander@uct.ac.za

DR MIKE OTIENO (SAICE Associate Member) is a lecturer in the School of Civil and Environmental Engineering at the University of the Witwatersrand, Johannesburg. He received his PhD and MSc (Eng) degrees from the University of Cape Town, South Africa, and his BSc (Civil Eng) degree from the University of Nairobi, Kenya. His research interests include concrete durability, service life prediction, steel corrosion in reinforced concrete structures, and repair and rehabilitation of concrete structures.

PROF MARK ALEXANDER (SAICE Fellow) is a professor of Civil Engineering at the University of Cape Town. He holds BSc (Eng), MSc (Eng) and PhD degrees from the University of the Witwatersrand, Johannesburg. His research interests are in cement and concrete materials, with experience in fundamental and applied research relating to design and construction.

