


Servicios Personalizados
Articulo
 Inglés (pdf)
 Articulo en XML
 Referencias del artículo
Indicadores

Links relacionados
-
 Citado por Google
 -
 Similares en Google
Compartir

 Permalink
Journal of the South African Institution of Civil Engineering
versión On-line ISSN 2309-8775
versión impresa ISSN 1021-2019
J. S. Afr. Inst. Civ. Eng. vol.57 no.4 Midrand oct./dic. 2015
http://dx.doi.org/10.17159/2309-8775/2015/v57n4a2
TECHNICAL PAPER
Perceptions of professional practitioners and property developers relating to the costs of green buildings in South Africa
D A Coetzee; A C Brent
ABSTRACT
Sustainable design practices are a key component in ensuring that the building and civil infrastructure industry does not damage our natural environment. Green buildings - and allied initiatives in other sectors of the built environment - are a primary mover in promoting sustainable design practices. An important and dangerous inhibitor of sustainable design practices, however, is the perception among key decision-makers that the additional costs of green - or sustainably designed - buildings are too high, and that they are therefore not economically viable. This study tested what those perceptions are, and compared the results to (limited) actual cost data and found that the cost premium is less than half of what most decision-makers think it is. Recommendations are then made around the development of awareness programmes at both undergraduate and postgraduate levels, the need to highlight the necessity for developing further and more accurate data related to green building costs, and the need to establish incentives to drive the take-up of sustainable design practices.
INTRODUCTION
The research that is summarised in this paper is based on the notion of sustainable development and its prerequisite, sustainable design. The sustainability philosophy that underlies sustainable design manifests (partially) in the development of the "green buildings" and "green precincts" movement.
The built environment industry imposes burdens on resources, and thus green buildings are going to play an ever more critical role in world society as population levels increase and natural resources become more and more constrained, and therefore expensive. The CSIR (2002) has estimated that buildings and civil infrastructure consume up to 40% of all resources and produce 40% of all waste, including 30% of greenhouse gas emissions, over the life cycle of the assets - from construction, through the operational life, to final decommissioning. Consumption of water is estimated at about 17% and energy at between 30% and 40% of the entire economy (CSIR 2002: 12).
The Green Building Council of South Africa (GBCSA 2012) states that "... a green building is energy and resource efficient and environmentally responsible. Using design, construction and operational practices, green building is high-performance and reduces the negative impact of construction on people and the environment."
Some of the practical implications are summarised in Table 1. Many studies have been conducted elsewhere into the cost premiums of implementation versus the savings gleaned over the life cycle of a green building. In general, the studies indicate premiums ranging from 1% to 8% (Tatri & Kucukvar 2011). It is generally accepted, however, that perceptions in the marketplace are that cost premiums are much higher than the research shows, sometimes as much as 30% (Morris 2007). However, these perceptions have not yet been tested in the South African context to better understand the barriers preventing the pursuing of green buildings and sustainable design as a country.

The economics of green building
According to Boston Mayor, Thomas Menino (in Kubba 2010b: 305), "High performance green building is good for your wallet. It is good for the environment. And it is good for people." This statement defines one of the basic premises of this study, namely that green building and sustainable design make economic sense.
Brown et al (2011) speak of the 4th economic revolution, one defined by resource scarcity. The first three - Agrarian, Industrial and Digital - are part of accepted economic theory. The 4th will be defined by the following five new competencies:
■ Collaborative growth and efficiency
■ Zero waste
■ Renewable resources
■ Climate resilience (an ability to adapt to climate changes that we are already seeing now), and
■ Eco-performance measurement (measuring resource usage, particularly energy and water).
Some of the economic benefits of green buildings are:
1. Increased income:
a. Higher rental rates
b. Higher rental growth, and
c. Higher occupancy rates.
2. Lower costs:
a. Operating costs:
i. Lower energy costs, and
ii. Lower water costs.
b. Reduced life cycle and capital costs.
Comparisons of costs for green buildings versus standard buildings are difficult because of the wide range of costings and many third variables. However, in spite of this the United States Green Buildings Council (USGBC 2012) indicates that:
1. The cost per unit area for LEED-certified buildings falls into the range of standard buildings. In other words, there are very little discernible cost premiums for green buildings [LEED stands for Leadership in Energy and Environmental Design].
2. LEED-certified office rentals are on average 11% higher than the average for multi-tenant Class A office space.
3. Operating costs of green buildings are 13.6% lower for new buildings and 8.5% lower for existing buildings.
4. Building values are 10.9% higher on new construction and 6.8% on existing buildings.
5. Returns on investments are 9.9% higher on new and 19.2% higher on existing buildings.
6. Occupancy rates are 6.4% higher for new and 2.5% for existing buildings.
7. Rental premiums are 6.1% higher for new and 1% higher for existing.
8. LEED gold building in the general services category use 25% less energy and 11% less water.
9. Maintenance costs are 19% lower, and this value is supported by Fowler et al (2010).
10. Occupant satisfaction is 27% higher in green buildings.
11. Green buildings have 34% lower greenhouse gas emissions.
The 2009 Greening of Corporate America report (McGraw Hill Construction & Seimens 2009: 2) indicates that 71% of corporates in North America expect a cost benefit from sustainability adoption (see Figure 1). This represents a major move towards a positive perception of the cost benefit of sustainable design and construction in America. The same report shows that the most important driver of green buildings is increased energy costs (McGraw Hill Construction & Siemens 2009: 7).

Generally research indicates that energy (25% lower) and water (11% lower) (Fowler et al 2010) provide the largest opportunities for cost savings, and this makes intuitive sense, especially in the South African context where the country is facing major constraints.
The Incisive Media 2008 Green Survey: Existing Buildings showed that 65% of building owners report a positive return on their investment in green building features (in Kubba 2010b: 306).
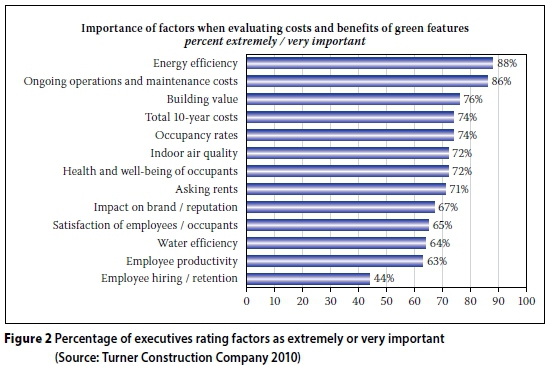
The Turner Construction Company reported that their 2010 survey showed that almost all building owners and developers intend to incorporate some level of green building features into their next projects, with reduced energy and operating costs being the most common drivers. However, the focus is now extending to other benefits, such as health and well-being, and corporate reputation (see Figure 2).
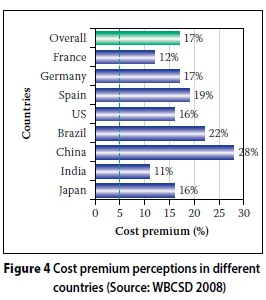
Morris (2007) reports anecdotal evidence of perceptions of the green building premium ranging as high as 30%. Kats (2009) summarised research from various sources, including the World Business Council for Sustainable Design, and showed (see Figure 3) that there is indeed a significant disparity between actual cost premiums and perceptions, with an actual cost premium median at below 2% and perceptions at 17%, as shown in Figure 4 (WBCSD 2008).

In 2006 the Green Building Council of Australia reported that negative perceptions regarding green buildings were rife, and there was a belief that cost penalties were significant and tenants did not care about "green". By 2008 this had changed and the focus had moved away from cost towards benefit (GBCA 2008: 12).
The payback perception is linked to the cost premium perception, because payback is the final measure of benefit. North American opinions of acceptable payback periods are shown in the Turner Construction Company Green Building Market Barometer (2010), as shown in Figure 5.
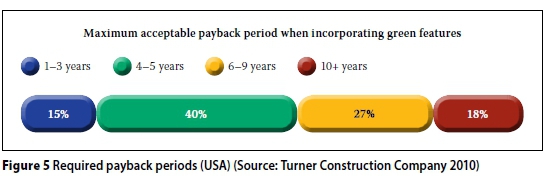
Figure 5 shows a fairly short required payback period, with 40% of US organisations requiring a four- to five-year period in terms of the Turner Construction Company Green Building Market Barometer (2010) survey. This appears to correlate with experiences in the South African market, where developers are believed to sell their interest fairly early on and therefore require short payback periods. This is known as a split incentive and is cited by the GBCSA (2012: 102) as a barrier to green building development in South Africa. This occurs because the entity that pays for the design and building of the facility is often not the one that operates and maintains it. Therefore the benefit of the additional cost accrues to a different party.
The same survey reported that 63% of organisations thought (perceived) that long payback periods were the most significant inhibitor of green building development. In its Green Jobs Study the United States Green Building Council (USGBC 2009) developed data that shows an average payback of just less than five years (see Table 2).
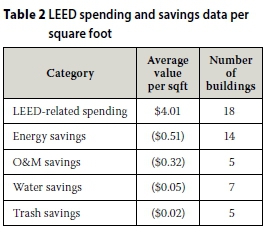
The LEED-related spending value of US$4.01 divided by the annual savings of !W gives a payback of just under 4.5 years; this is therefore consistent with the Turner Barometer.
Davis Langdon has probably been the most active researcher into the cost issues of green buildings. In an initial report in 2004 they reported no statistically significant differences between average costs per square foot for LEED buildings versus non-LEED buildings (Davis Langdon 2004). In a later report a 3% to 5% cost premium for a 5 Star (LEED) building, and a further 5% for a Gold Star building (Davis Langdon 2007) were documented. This represents US$19/m2 for a possible change from 4 to 5 Star and US$40/m2 for a change from 4 to 6 Star.
A number of additional key points are likely to affect the economic balance of green building implementation in the near future (Davis Langdon 2007):
1. The impact of possible future taxes related to sustainability.
2. The diminishing of the "additional cost" perception as green buildings become the norm (mainstreaming).
3. Marketplace influence and hence marketability, as green buildings become more mainstream and therefore expected. This applies particularly to the premium end of the market.
4. A growing tendency towards a full life cycle analysis.
5. A growing appreciation for the productivity benefits of green buildings, which have previously been discounted as too "soft" to evaluate.
6. The possibility of carbon trading systems.
Current status in South Africa
South Africa has made some advances in the green building space. Specifically, the Green Star rating system was developed, and has been managed by the Green Building Council of South Africa as a voluntary tool that provides the property industry with "an objective measurement for green buildings, [and] recognises and rewards environmental leadership in the property industry" (GBCSA 2012). However, the country has not yet reached a maturity level comparable with countries such as the United States, the United Kingdom or Australia (GBCSA 2012). This implies that the country needs to move from its current state to an improved position with regard to how it designs its built environment.
In 2011 the Department of Trade and Industry (DTI) added sections to the National Building Regulations (SANS 10400) that relate to environmental sustainability of (Part X) and energy usage in (Part XA) buildings. Although mandatory, the interpretation of the amended regulations is not standardised and remains a challenge (CivilSure 2015). O'Rourke (2015), in his examination of the natural building movement in South Africa, highlights costs as a key driver of change - environmental benefits that surpass the mandatory regulations, and banking requirements are still perceived as expensive. A lack of knowledge in the market is highlighted as a central theme that inhibits the green building movement.
Objective of this paper
The objective of this paper is therefore to confirm whether there is a predisposition by built environment professionals and property developers to overstate the cost premium of green buildings in South Africa. The paper then attempts to confirm whether that belief is reasonable and, if not, gathers evidence to prove that the perception is wrong. The purpose is to assist in providing knowledge for the development of green buildings in South Africa.
RESEARCH METHODS
An action research approach was followed, using case information, together with a perception survey. Thus the research comprised an inductive, non-experimental field study with no planned intervention and no random assignment (Welman et al 2005:34). The sample was self-selecting, because the surveys were sent out to a stratified random sample of built environment professionals and property developers, and the researcher had no control over the response rate.
The survey, as the main research instrument, was structured to provide a view of the perception of built environment professionals and property developers towards the costs of green buildings in South Africa.
A relevant "third" variable is the grouping into which the respondents fall. The following groups were identified and the data grouped accordingly:
■ Property developer - Commercial
■ Property developer - Industrial
■ Property developer - Residential
■ Professional - Architect
■ Professional - Building services engineer
■ Professional - Electrical engineer
■ Professional - Quantity surveyor The data was analysed according to these groupings to determine whether there were any discernible patterns.
A further "third" variable is geographical, i.e. in terms of the regions where the respondents reside. Accordingly the analysis also considered these groupings to determin any possible patterns.
The primary question, regarding cost premium, was analysed as univariate data to determine distribution, mean mode and median, and analysed using appropriate statistical formulae, such as the single population median and its confidence range.
■ The independent variable is: Built Environment Professionals and Property Developers
■ The dependent variable is: Cost Premium Perception
An online survey was utilised. The advantage of an online survey is that it is easy to administer and distribute. The disadvantage is that an online survey requires any potential respondent to have access to the internet in order to complete the survey.
RESULTS AND DISCUSSION
data gathering process
The original intention was to issue the perception survey via the various professional councils in the built environment. The Engineering Council of South Africa (ECSA), the South African Council for the Architectural Profession (SACAP) and the South African Council for the Quantity Surveying Profession (SACQSP) were approached and asked to support the survey. The South African Property Owners Association (SAPOA) was also approached in order to obtain input from this important part of the built environment industry.
Of these ECSA agreed to issue a request to complete the questionnaire to its registered members, SACQSP advised that it would not issue unsolicited email requests to its members, and SACAP did not respond. SAPOA indicated interest, but did not issue its request in time for the data to be considered.
The Association of South African Quantity Surveyors (ASAQS) provided enthusiastic support and issued a request to its members. The South African Institute of Architects was also approached, but did not respond in time.
The Green Building Council of South Africa (GBCSA) was willing to request its members to respond to the survey. This offer was declined, however, as it was felt that GBCSA members were likely to be biased towards sustainably designed buildings, as well as having better knowledge of their benefits. It was felt that a more representative sampling procedure would be obtained by accessing GBCSA registered members via the other professional bodies. In fact, 7% of respondents were members of the Green Building Council of South Africa.
Data gathered
ECSA issued the survey to its registered members in July 2013. Due to confidentiality issues and the nature of the ECSA mailing list, the survey request was issued to all registered members and no sampling methodology could be employed. However, based on the number of registered members, more than 20 000 professionals were reached through the survey.
A total of 1 192 responses were received between 5 July and 8 August 2013. Over 51% of all responses were received on the first day, with almost 90% received in the first eight days. These responses where all the result of the requests from ECSA and ASASQ to complete the survey.
Data results
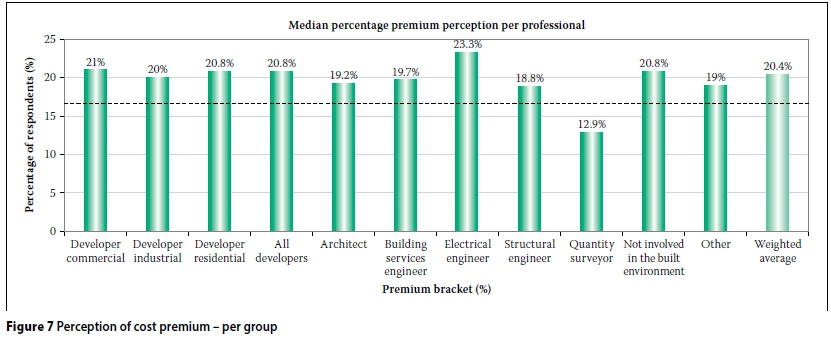
The main question asked in the survey was what the respondent's perception of the cost premium of green or sustainably designed buildings over standard buildings is. The results are shown in Figures 7 and 8.
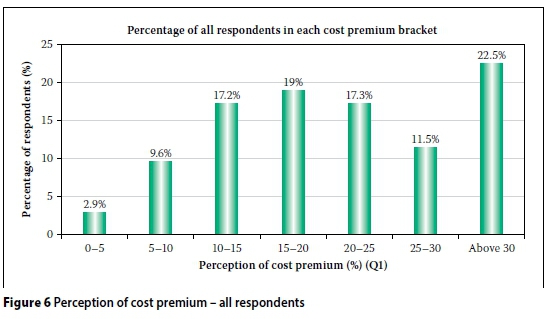
The weighted median perception was 20.36%. It should be noted, however, that the responses have highlighted a weakness in the survey design (as can be seen in Figure 6). The options for cost premium in the survey were set in 5% intervals from 0%-5% up to 25%-30%, with a "catchall" of > 30% for anything above. The results show that 22.5% of respondents (nearly one in four) selected "Above 30%". This shows that the survey design should have had at least a further two or more categories, namely 30%-35% and 35%-40%. Given this weakness, the mean is a less reliable measure of central tendency. The median is a better measure and has been used in the analysis.
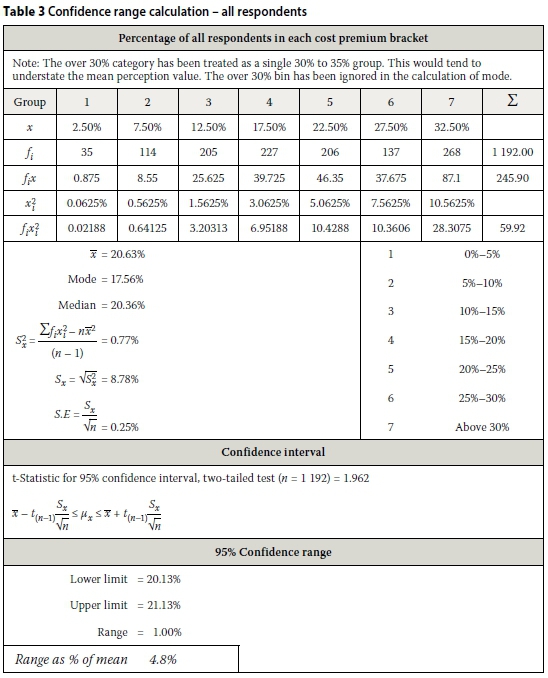
In the analysis of the median percentage premium the calculation is based on assuming that all "Above 30%" respondents fall into a 30%-35% interval. This, whilst conservative, may be misleading and will result in an understatement of the median value. Due to the relatively large sample, the confidence range of the results is narrow (1%) (refer to Table 3). The mean, median and mode values were calculated using grouped data methods.
Unfortunately only 16 quantity surveyors responded to the survey, thus not a statistically representative number. However, the median value of 12.9% is much lower than that of the whole group value. This most likely reflects the better financial knowledge of quantity surveyors. It also correlates better with the limited actual cost premium data available in South Africa (see Tables 4 and 5), and in other countries.
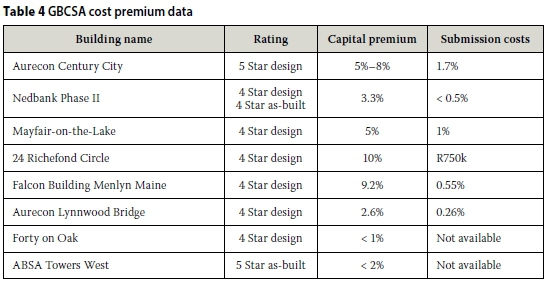
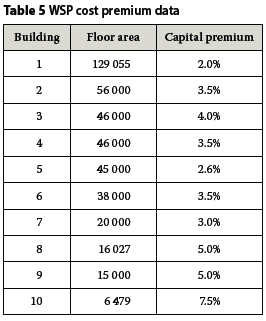
Whilst there is a shortage of information about the actual cost premium of green or sustainably designed buildings in South Africa, the following data is available:
1. The Green Building Council of South Africa (2012) - see Table 4.
2. WSP South Africa (2011) - see Table 5. These case studies indicate that green buildings in South Africa could reasonably be expected to cost between 2% and 10% more than so called "standard buildings".
The median cost premium perception of the sample (n = 1192) gives a median cost premium of (approximately) 20% to 21%. This compares well with other research that indicates a value of 17% (WBCSD 2008). It is reasonable to expect South Africa to have a higher cost perception due to the later take-up of sustainable building design in this country, since South Africa is at a lower maturity level with regard to green buildings than leading overseas countries (GBCSA 2012). As a new technology becomes embedded it generally gets less costly as it becomes mainstream. The perception is that the South African premium is higher than First World countries, but that it will drop over time.
The actual data compiled by WSP (2011) and GBCSA (2012) clearly indicates values of 2% to 10%. If a worst case of 10% for actual costs is assumed, then the South African perception of the cost is double or 10% higher than what it actually is.
This has important ramifications for the take-up of sustainable design in South Africa, because decision-makers will not pursue green or sustainable design practices if they believe them to be too expensive, or if they do not believe that green practices will provide an economic benefit. The data clearly shows that the actual cost is significantly lower than perceptions. This means that the potential take-up of sustainable design practices in the built environment is being inhibited inappropriately.
This is particularly unfortunate, because the attitude of key decision-makers is not at all negative towards the idea of sustainable design. Less than 5% say they actively do not intend to pursue sustainable design practices. Despite the cost perception mismatch with actual cost, and the fact that nearly 29% of respondents feel that the cost recovery takes too long, nearly 63% still believe that green or sustainably designed buildings make economic sense.
Furthermore, there is a mismatch between perceptions of the payback period versus the required payback period. The perception of the payback period is seven years, while the required payback period is just under five years. This requirement of developers is consistent with international data -40% of respondents to a Turner Construction Company Green Building Market Barometer (2010) indicated a requirement of four to five years.
Although there is currently no local data to determine actual payback periods, international data shows that the payback period is in fact less than five years - as is required by local decision-makers. These values are very good, given that the lifespan of a building is (arguably) over 30 years. However, it must be noted that this argument only holds if the project initiator occupies the building, or the premium can be passed on to the purchaser or tenant. The latter then requires greater awareness of the advantages in the end-user market.
Narrative feedback
The narrative feedback from the survey was diverse, However, a number of themes are evident in the data:
1. There is a lack of training in sustainable design principles at undergraduate level.
2. There is a perception that a lot of current development in the green building sector is based on it being "fashionable", rather than for responsible design or good practice reasons.
3. The implementation of sustainable design principles in the built environment should be part of all good design, and should not be considered as something extra or new. This is particularly true for energy consumption - responsible design must strive for maximum efficiency beyond compliance to the regulations.
4. A large number of those surveyed felt that sustainable design was both ethically correct and socially responsible. This means that there is a strong foundation to build
a sustainable design movement upon.
5. Many expressed the feeling that the "compliance" aspect of the green building certification programme is too "rules-based" and does not adequately recognise innovative thinking. The additional design costs caused by certification were also challenged. This could lead to projects that do not pursue certification, but may nevertheless follow the principles of green buildings. This is not necessarily a bad thing.
6. The approach being followed in South Africa is too closely modelled on the First World and is not sufficiently aligned with the reality of Africa.
7. Part of the cost premium problem is due to various parties taking advantage and charging more than necessary because of the immaturity of the market. This seems to be mostly directed at solar heating. Also part of this issue is untrained and unscrupulous operators trying to make money by "peddling" products under the moniker of "green", but which may not in fact support sustainability principles correctly. This damages the credibility of sustainably designed buildings.
8. Local government needs to become more active in creating an enabling environment for sustainable design (for example, through the use of such systems as smart metering). This is inhibited by the lack of capacity in that sector.
9. There is a disjunction between the initial development of the building, which may be based on sustainability principles, and the operations, which often do not follow the same principles.
10. The split incentive was raised. This is where a developer pays the cost, but the tenant reaps the reward. This problem is addressed by the concept of a green lease, which attempts to share the benefits of
a sustainably designed building between landlords and tenants. It also attempts to ensure that a sustainably designed building is operated in a sustainable way. This addresses the problem raised in the preceding point.
11. Existing specifications and practices were highlighted as constraints against the adoption and implementation of sustain-ably designed buildings. The key issue is that existing ways of doing things often counter the objectives of sustainable design. This means that it is important to ensure that all existing legislation, standards, by-laws and other regulations, specifically SANS 10400 Parts X and XA, as well as "best practice" are aligned with the principles and objectives of green buildings and sustainable design, and that they are also coherent.
CONCLUSIONS AND RECOMMENDATIONS
Contribution to practice
The objective of this survey was to test the perceptions of local built environment decision-makers to determine whether they believe that the cost premium of implementing green or sustainably designed buildings is more than it actually is. The data shows that this is the case - the perception of the cost is more than double what the actual cost premium is. This perception is consistent with international research.
The results also show that, despite these beliefs, there is a very positive attitude towards green or sustainably designed buildings. This means that there is a sound platform for promoting and improving sustainable design principles in the built environment.
The study shows that a well-constructed, facts-based information disseminating programme is likely to result in an accelerated take-up of green buildings built on sustainable principles, because there is a clear mismatch between the perception and the actual data.
It also shows that there is a need to assemble further (and more accurate) data regarding the actual cost premium of green or sustainably designed buildings, as well as data about the potential savings in operating costs that result from implementing more efficiently designed buildings. These two areas of data and information will provide better support to any initiative to increase the implementation of green buildings.
Conclusions
This study shows that the cost of implementing sustainable design practices in the built environment is less than most key decision-makers believe. Further studies are required to confirm international data which shows that the payback of such investments is less than five to seven years. However, it is certain that the net present value of any such investment is positive, because the lifespan of a building is more than thirty years, i.e. the benefit is realised for the investor over the lifespan.
The primary recommendations of this study are for more extensive and more accurate data and information, and for further education of decision-makers. This is likely to accelerate the take-up of sustainable design and operational practices in the built environment.
The following extracts from responses to the survey highlight three important points with regard to green buildings and sustainable design:
"Sustainable design should be pursued as a matter of course. It is often cheaper than conventional design, so there is no 'payback' period."
"I measure everything against cost. If it makes financial sense I incorporate it. Green in my language is written gReen."
The words "It's the right thing to do" were mentioned in 13 separate narrative comments.
The study shows that there is a need to assemble further (and more accurate) data regarding the actual cost premium of green or sustainably designed buildings, as well as data about the potential savings in operating costs that result from implementing more efficiently designed buildings. These two areas of data and information will provide better support for any initiative to increase the implementation of green buildings.
This research highlights the lack of good data regarding the actual cost premium of green or sustainably designed buildings, as well as the economic payback that they produce. This is required in order to compare the results of a perception study (such as this one) to the real facts. The type of data needed relates to both the capital cost of a building designed for sustainability and the potential life cycle savings that can be generated by such a building during its operational life.
Recommendations
■ Recommendation 1: Carry out on-going detailed studies of the additional capital cost of green or sustainably designed buildings using all the data available for the current Green Star certified buildings. Categorise this, based on the rating achieved (Four Star, Five Star or Six Star).
■ Recommendation 2: Carry out on-going detailed studies of the potential operational cost savings of green or sustainably designed buildings, using all the data available for the current Green Star certified buildings. Categorise this based on the rating achieved (Four Star, Five Star or Six Star).
■ Recommendation 3: Implement an on-going programme to track the actual operational cost of Green Star certified buildings so that a comparison can be made against the savings predicted (as per Recommendation 2 above).
■ Recommendation 4: Derive average payback periods for green or sustainably designed buildings using the information calculated in Recommendations 1, 2 and 3 above. Notwithstanding the limitations described above, this survey has clearly shown that there is a mismatch between what built environment decision-makers believe the green building cost premium is and what it really is. This means that there is a need to provide information and training to the industry to clarify misperceptions. In order to do this, one requires the information generated from Recommendations 1 through 4.
■ Recommendation 5: Develop information sheets and training programmes which provide data to built environment professionals and other decision-makers, to support the notion that green or sus-tainably designed buildings are cheaper than they might think, and that the payback period for the additional investment is not only less than they think, it is well within the lifespan of a building and therefore results in a positive net present value.
■ Recommendation 6: Elevate the principles of green buildings and sustainable design to the highest possible significance levels in undergraduate education in built environment faculties. A focus on ethics and social responsibility with regard to sustainability is critical.
■ Recommendation 7: Execute extensive post-graduate and continuing professional development programmes focusing on green buildings and sustainable design.
■ Recommendation 8: Because people generally make decisions on an economic basis (what is in their best, usually financial, interest), the government needs to encourage sustainable design via the use of legislation that provides incentives for good sustainable design practices, and disincentives for bad practices.
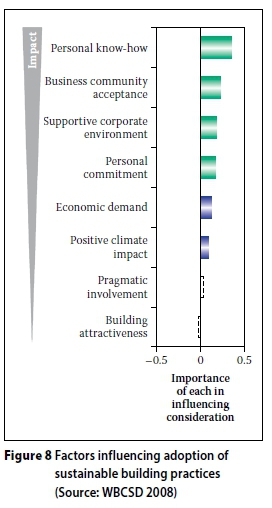
The World Business Council for Sustainable Development (WBCSD 2008) lists a number of factors that influence the take-up of sustainable building practices. In order of impact these are as follows (see Figure 8):
1. Personal know-how
2. Business community acceptance
3. Supportive corporate environment
4. Personal commitment
5. Economic demand
6. Positive climate impact
7. Pragmatic involvement
8. Building attractiveness.
Of these factors the first four are all related to the perceptions and attitudes of those involved in the industry. This highlights the importance of accumulating and disseminating accurate information to role players, as described in the recommendations above.
REFERENCES
Brown, S, Chilcott, M & Carmichael, B 2011. Sustainable competitive advantage - The 4th economic revolution: Unavoidable, opportunity. Available at: http://www.dosen.narotama.ac.id/wp-content/uploads/2012/03/Sustainable-Competitive-Advantage,pdf [accessed on 31 March 2014]. [ Links ]
CivilSure 2015. Environmental sustainability & energy usage in buildings - Parts X & XA. Available at: http://www.sans10400.co.za/energy-usage [accessed on 22 April 2015]. [ Links ]
CSIR (Council for Scientific and Industrial Research) 2002. Agenda 21 for sustainable construction in developing countries - First discussion document. Available at: http://www.cidb.org.za/documents/kc/external_publications/ext_pubs_a21_sustainable_ construction.pdf [accessed on 31 March 2014]. [ Links ]
Davis Langdon 2004. Costing green: A comprehensive cost database and budgeting methodology. Available at: http://www.chs.ubc.ca/archives/files/Costing%20Green_A%20Comprehensive%20Cost %20Database %20and%20Budgeting%20Methodology.pdf [accessed on 31 March 2014]. [ Links ]
Davis Langdon 2007. The cost & benefit of achieving green buildings. Available at: http://www.usgbc.org/Docs/Archive/General/Docs2583.pdf [accessed on 31 March 2014]. [ Links ]
Fowler, K M, Rauch, E M, Henderson, J W & Kora, A R 2010. Re-assessing green building performance: A post occupancy evaluation of 22 GSA buildings. Available at: http://www.pnl.gov/main/publications/external/technical_reports/PNNL-19369.pdf [accessed on 31 March 2014]. [ Links ]
GBCA (Green Building Council of Australia) 2008. The dollars and sense of green buildings. Available at: http://www.gbca.org.au/dollars-sense08/ [accessed on 31 March 2014]. [ Links ]
GBCSA (Green Building Council of South Africa) 2012. The rands and sense of green building. Available at: http://www.gbcsa.org.za/knowledge/publications/ [accessed on 31 March 2014]. [ Links ]
Kats, G 2009. Greening Our Built World - Costs, Benefits and Strategies. Washington DC: Island Press. [ Links ]
Kubba, S 2010. Green Construction Project Management and Cost Oversight. Burlington, MA, US: Architectural Press. [ Links ]
McGraw Hill Construction & Siemens 2009. Greening of corporate America. Available at: http://construction.com/market_research/FreeReport/GreeningCorpAmerica/2009_ GreeningCorpAmerica.pdf [accessed on 31 March 2014]. [ Links ]
Morris, P 2007. What does green really cost? The green issue feature. Available at: http://www.davislangdon.co.nz/upload/images/publications/USA/Morris%20Article.pdf [accessed on 31 March 2014]. [ Links ]
O'Rourke E C 2015. Natural building in South Africa: Assessing the niche-regime relationship through a 'latent niche' mediation. Master's dissertation, Stellenbosch: Faculty of Economic and Management Sciences, Stellenbosch University. [ Links ]
Tatri, O & Kucukvar, M 2011. Cost premium prediction of certified green buildings: A neural network approach. Building and Environment, 46(5): 1081-1086. [ Links ]
Turner Construction Company 2010. Green building market barometer. Available at: http://www.turnerconstruction.com/content/files/Green%20Market%20Barometer%202010.pdf [accessed on 24 March 2012]. [ Links ]
USGBC (United States Green Building Council) 2009. Green jobs study. Available at: http://www.usgbc.org/ShowFile.aspx?DocumentID=6435 [accessed on 24 March 2012]. [ Links ]
USGBC (United States Green Building Council) 2012. Green building facts. Available at: http://www.usgbc.org/articles/green-building-facts [accessed on 11 September 2013]. [ Links ]
WBCSD (World Business Council for Sustainable Development) 2008. Energy efficiency in buildings: Business realities and opportunities. Available at: http://www.cidb.org.za/Documents/KC/External_Publications/ext_pubs_energy_eff.pdf [accessed on 24 March 2012]. [ Links ]
Welman, C, Kruger, F & Mitchell, B 2005. Research Methodology, 3rd ed. Cape Town: Oxford University Press. [ Links ]
WSP South Africa 2011. WSP Green Building Guide 2011. Bryanston: WSP. [ Links ]
 Correspondence:
DAVE COETZEE
Graduate School of Technology Management
Engineering 2
University of Pretoria
Pretoria, 0002
South Africa
T: +27 (0)12 420 5179
E: davecoetzee@afrihost.co.za
Department of Industrial Engineering
Faculty of Engineering Stellenbosch
University Stellenbosch,
7600 South Africa
T: +27 (0)21 808 9530
E: acb@sun.ac.za

DAVE COETZEE Pr Tech Eng started his career in the Durban Municipality's Construction Division, where he managed teams carrying out municipal construction work. Thereafter he moved to the Structures Section where he spent five years doing structural design. Dave then joined the Development Services and Project Management Division of Africon Engineering (now Aurecon), where he worked as a project and programme manager on a wide variety of developmental projects covering, amongst others, civil and building infrastructure, and telecommunications infrastructure projects. He is now involved in infrastructure asset management, where his specific interest is Building Asset Management.

PROF ALAN BRENT Pr Eng holds bachelor degrees in engineering (chemical) and philosophy (sustainable development); master degrees in science (environmental engineering), engineering (technology management), and philosophy (sustainable development); and a PhD in engineering management. He is an NRF-rated researcher, with a focus on sustainable technology management. Currently he is a professor of engineering management and sustainable systems in the Department of Industrial Engineering at Stellenbosch University, and the associate director of the Centre for Renewable and Sustainable Energy Studies (CRSES) at the same institution.

