


Services on Demand
Article
 English (pdf)
 Article in xml format
 Article references
Indicators

Related links
-
 Cited by Google
 -
 Similars in Google
Share

 Permalink
Journal of the South African Institution of Civil Engineering
On-line version ISSN 2309-8775
Print version ISSN 1021-2019
J. S. Afr. Inst. Civ. Eng. vol.57 n.3 Midrand Sep. 2015
http://dx.doi.org/10.17159/2309-8775/2015/V57N3A5
TECHNICAL PAPER
Comparison of travel time between private car and public transport in Cape Town
G Hitge; M Vanderschuren
ABSTRACT
The objective of urban transportation planning is, or should be, to optimise the access to opportunities for all people. One of the factors that defines access is to minimise the travel time between home and both primary and secondary activities. Optimisation refers to the balance between the benefits of reducing travel time with the cost of that reduction. Cost includes operational, infrastructure and environmental costs. However, the reality in many cities is that travel time is often minimised for some users or communities, while it remains relatively high for others.
This paper explores the core components of travel time of an integrated public transport system, and compares that with travel time in the private transport system. This is done by using travel time data for Cape Town to estimate the value of time spent on each component of a typical trip in Cape Town in 2013.
The paper concludes that travelling by public transport takes significantly longer than by private car for the average trip in Cape Town. It then highlights where to focus investment in the public transport system to move towards an integrated, multi-modal system that can compete with the private car, and thereby become attractive to all communities.
Keywords: travel time ratio, competitiveness of public transport, Cape Town
INTRODUCTION
Noise, pollution, global warming and impaired liveability are just a few of the negative impacts of transportation systems around the world. These problems can largely be overcome by transforming car-centric cities into cities where public transport and non-motorised transport are the dominant modes. This paradigm shift, from the previous predict-and-provide for cars approach that has been displayed in the developed world, has also entered the developing world. South Africa confirmed a commitment to the development of a car-competitive public transport system in 2007 (DoT 2007a). How individuals choose between routes, modes, departure times, etc, has always been an important research question in transportation planning and management (Chen & Mahmassani 2004; Emmerink et al 1995). Goodwin (1995) concluded that there is one simple but important proposition for travel behaviour analysis that arises from past research: people differ. Therefore, planning should not just rely on analysis of averages.
Background
The objective of urban transportation planning is, or should be, to optimise access to opportunities for all people in a city. It is the stated policy of the Cape Town metropolitan and South Africa's national governments (CCT 2013a; DoT 2007b) to improve public transport to provide a better service to current public transport users. It simultaneously aims to make public transport competitive with the private car in order to provide a viable alternative mode to traditional car users.
One of the key factors that define accessibility is the travel time between home and activities, or opportunities. Several frameworks have been developed to determine level of service indicators for the effectiveness of public transportation systems (Hassan et al 2013; Cervero 2013). These systems contain a variety of criteria attributes to evaluate, ranging from cost measures, operational performance and utilisation, but virtually always consider travel time as a key indicator.
Travel time was confirmed to be important to the South African travelling public as it was indicated as the most common determinant of transport mode choice (32.5%) in the 2013 National Household Travel Survey (StatsSA 2014). The cost of travel was indicated as the second largest determinant of mode choice (26.2%). In his book The Transit Metropolis, Cervero (1998) states that the central premise is that transit will only become time-competitive with the car by improving the match between how services are configured and cities are designed.
The average travel time in Cape Town was, at about 90 minutes in 2013, at the upper end of the global range, which averages around 70 minutes per person per day (Metz 2010; Schafer & Victor 1998). Of greater significance is the discrepancy between modes in Cape Town, with car users travelling at the global average of 70 minutes, but public transport users averaging around 110 minutes (CCT 2013b). This significant difference resonates with the discrepancy in the levels of spending on infrastructure for the two largely separate sub-systems of private and public transport networks, over the past three decades.
Due to the legacy of apartheid, with spatial planning and economic suppression of non-white citizens, there is still a very strong correlation between race, income level and mode choice. The previously disadvantaged groups of the population are bound to use the much slower public transport modes (CCT 2009). It should follow that one of the key focus areas of the public transport investment strategy should be on the reduction of travel time in public transport, both relative to that of the private car and in real terms moving closer to the global average for metropolitan areas.
The interventions in the public transport system discussed in this paper cannot and should not compensate for the problems created by historic spatial planning. This paper therefore does not elaborate on the spatial and land use planning interventions that contribute to making public transport more competitive with the car.
Objectives and methodology
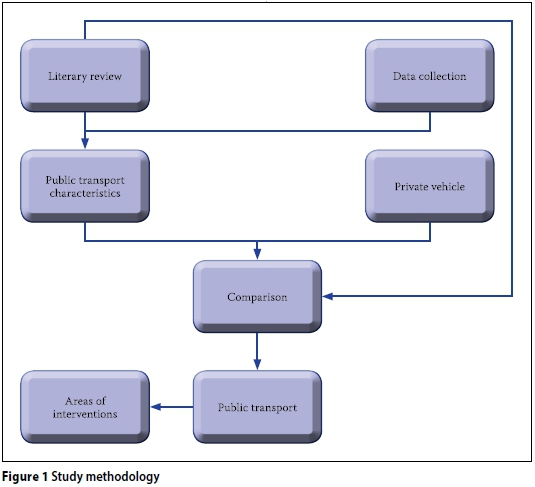
The primary objective of this paper is to show that travel time in public transport is not competitive with that of the private car in Cape Town. The second objective is to highlight three different areas of interventions to reduce public transport travel time.
The methodology followed (summarised in Figure 1) was to identify the main components of a public transport trip that affect the total travel time, through a review of the literature. A survey was designed to collect relevant data for Cape Town. The literature also facilitated a comparison and interpretation of the results from the data analysis, from which the approach to intervene was deducted.
DATA COLLECTION
A survey was designed to collect data on travel times between seven typical origins and four typical destinations in Cape Town. The sample areas were geographically stratified to obtain a random mix of travel times, making use of a variety of transport network elements, as shown in Figure 2, and summarised in Table 1.

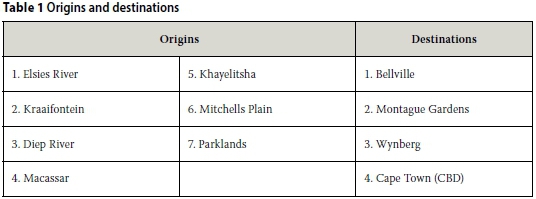
A (single) gathering point was selected, in each of the various districts, as a departure and arrival point. These areas are, on average, less than 2 km from the nearest bus, minibus and train station, and surveyors were required to walk to these stations or pick-up areas. Park-and-Ride was not evaluated as an option due to the relatively low proportion of people using this option at present (Wentley & Hitge 2013). The modes used between the origin and destination (O-D) pairs are as follows: private vehicle, train (Metrorail), bus (GABS), minibus-taxi (informal taxi, MBT) and where possible, a limited number of BRT (MyCiTi) trips. With certain O-D pairs not all modes were surveyed due to their unavailability in connecting these O-D pairs. In other cases the main mode would be used in conjunction with other modes to complete a trip.
The survey included three departures during the AM peak period (i.e. 06h00, 06h15 and 06h30), two during the off-peak (OP) period (i.e. 12h00 and 12h15) and one return trip during the PM peak period (i.e. 16h30). The modes for each AM, OP or PM period were conducted on the same day for each O-D pair.
Surveyors were provided with a detailed route plan for each O-D pair, the travel time survey questionnaire and a GPS device. The questionnaire was created to document the trip information. The GPS device was programmed to record the position / coordinates of the surveyor throughout the survey, and to save the position and time when the surveyor departs, arrives and other points during the journey when congestion is experienced or when the surveyor is waiting at a transfer station (i.e. way points).
The data gathered from the paper-based surveys includes quantitative and qualitative data, whereas the GPS data only includes quantitative data. Two types of GPS devices were used - active and passive trackers. An active tracking GPS device sends a signal containing the longitude and latitude coordinates of the surveyor to a server which then stores this data. This data can then be recovered at a later stage for analysis. Passive trackers store the longitude and latitude coordinates on the device itself, and this data can be recovered after the survey has been completed.
The survey was conducted during November and the first week of December 2012. GPS and questionnaire data were analysed and interpreted to compose the data set used for this analysis.
ANALYSIS OF CAPE TOWN TRAVEL TIME SURVEY DATA
The data was analysed in terms of the three trip components recorded during the trips, including walking time, waiting time and in-vehicle travel time. While data was collected for the BRT mode, the small data set was not used, as (a) the coverage at the time of the survey was very limited, and (b) the service was in an early developmental stage. During the discussion, data obtained from the survey is compared to similar international and local values.
Walking time
Walking time to public transport is a function of walking speed and distance. Walking speed is influenced by personal characteristics (age, fitness level, etc), gradient, ambient conditions like wind speed and surface quality (Hermant 2012). The distance a person has to or is willing to walk, is influenced by the proximity of the nearest public transport, surface quality, lighting, safety and trip purpose.
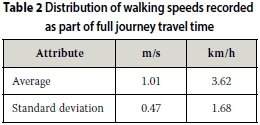
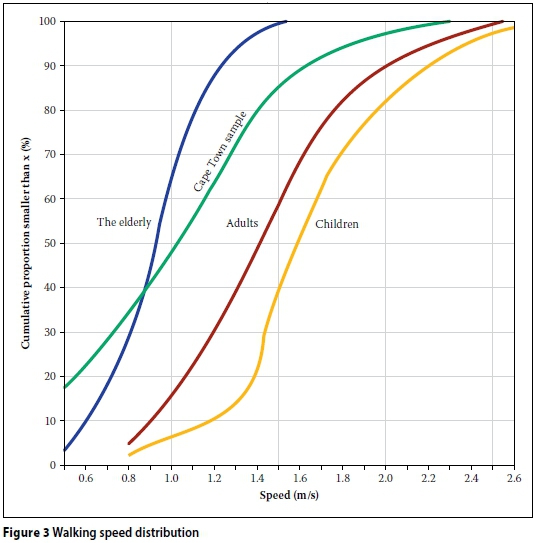
The survey data provides a sample size of 304 walking entries, of which Table 2 provides a summary and Figure 3 illustrates the cumulative distribution relative to typical ranges for various parts of Cape Town (adapted from CROW 1998). The average speed of just over 1.0 m/s is similar to those found by several other studies, including and as described by Hermant (2012).
The range of walking distances to and from main modes gives an indication of the coverage of that mode, and the degree to which it is accessible from random parts of the city. Table 3 shows the average walking distance by passengers using the three traditional main modes of public transport, as well as the theoretical average walking time, using the average speed from Table 2. Perhaps unsurprisingly the walk to rail had the highest minimum, maximum and average distances, while minibus-taxi (MBT) recorded the lowest on all three. While passengers may elect to use a feeder service to reach rail or even bus stations to reduce their travel time, many cost-sensitive public transport users are known to walk these distances.

A household survey of about 2% of all households in Cape Town was conducted during 2012 (CCT 2013b). Its 'stated preference' component found that minibus taxi is the most and rail the least accessible public transport modes in Cape Town. The average total walking time was incidentally also recorded as 22.8 minutes, which includes trips to public transport, as well as about 21% of respondents who make entire trips on foot.
Data from the National Household Travel Survey (NHTS) (StatsSA 2014) confirms this trend, showing that the national walking distance to train and bus is about 65% and 15% more than to minibus taxi services. It further reveals that 52% of people in the Western Cape walk to their first public transport mode in under five minutes, a further 20% reaching it in under ten minutes, and less than 15% of people walk for more than 15 minutes.
Table 3 shows that, while the survey was not meant to be representative of the City's travel patterns, similar walking times were recorded in the three separate surveys.
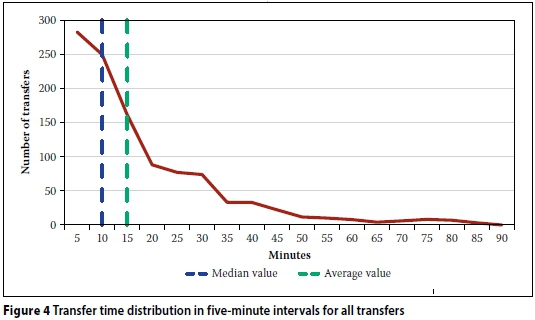
Transfer time
Table 4 shows the transfer time distribution for the sequential transfers in a trip, while Figure 4 shows the distribution of all recorded transfer times graphically. The average transfer time increases notably with subsequent transfers, i.e. those further from home on the journey. Of the 856 transfers, only 15 were recorded as being zero minutes, or being less than one minute from arriving to departing.
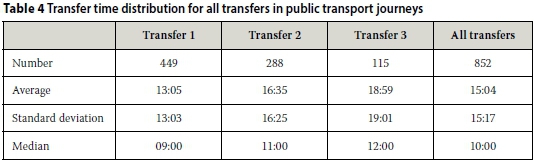
The data was not collected to distinguish between the time taken to walk between arriving and departing modes, or the actual time waiting for the second mode to depart, although this distinction is important when assessing interventions to reduce the transfer time.
Table 4 shows that the median travel time is significantly below the average, and that the standard deviation is very high. An assessment of the factors contributing to this reveals that (a) some transfers are very efficient, especially during the AM peak when headways are low, and (b) during off-peak periods headways can be excessive on all modes. The design of public transport interchanges in Cape Town often results in walking distances between arriving and departing modes that exceed those of other developing cities (Schalekamp 2007).
The NHTS indicates that only about 16% of public transport passengers in the country make any transfers, and that transfers are far more prevalent for rail passengers. Given the greater extent of rail coverage and usage in Cape Town, this number is unsurprisingly higher for Cape Town, at 21% of public transport passengers (CCT 2013b). The survey also indicated that the number of second and third transfers are, at 14% and 6% respectively, significantly higher in Cape Town than in other metropolitan areas.
In an assessment of the bus system in Abu Dhabi in 2009 (Hassan et al 2013), the waiting time for transfer of passengers was recorded as 38% from 5-10 minutes, 34% from 10-20 minutes, and 13% less than five minutes. The median transfer time is therefore well below the ten minutes recorded for Cape Town.
In-vehicle travel time
The in-vehicle travel time depends both on the speed and the distance travelled. Speed is influenced by the speed limit and the prevailing level of service (LOS), which dictate the ability to maintain the desired speed for vehicles in mixed traffic. For vehicles with dedicated or semi-dedicated rights-of-way, the speed is not only determined by the design standards of the way and vehicles, but also by the frequency and duration of stops along the route.
Table 5 shows the average in-vehicle speeds for the four different modes in the three different time periods of the survey. The table shows that the car has the highest average speed during both the AM and off-peak periods, followed by the minibus taxi, with conventional GABS buses consistently travelling slower than rail.

The average peak hour speeds are intuitively expected, with MBTs being marginally slower than cars due to more frequent stops, but despite erratic driving making up speed along the route.
The low speed of train trips is concerning, considering the fact that trains run on a dedicated right of way, and stations are typically not less than 1 km apart. Speeds of 30 to 40 km/h should be expected for this mode (Vuchic 2007). The low speed is ascribed to the fact that substantial speed restrictions exist on many parts of the rail network due to poorly maintained tracks, and station capacity requires arriving trains to sometimes wait for trains that are not ready to depart. In addition, the average age of the rolling stock fleet is about 40 years, and overcrowding results in an inability to collect all waiting passengers, which leads to longer dwell times for trains at many stations.
The data was not collected to distinguish between travelling on local roads, arterial or freeways, for which design speeds vary.
However, the effect of congestion on travel speed is clear when comparing the off-peak speeds for car and MBT to that of the AM peak.
Figure 5 shows the variation of speed with distance travelled for the four modes and for the forward direction (excluding PM peak data). Of interest is that the speed increases slightly with distance for car and train, but that it decreases slightly for both bus and minibus-taxi (MBT) (the distance axis is not to scale, so the gradient of the trend line has no meaning).

The data reveals that, for the 28 O-D pairs, the distance by car is about 10% shorter than the average of the public transport modes, with rail being almost 20% longer than the road-based public transport modes. Given the geographically stratified nature of the O-D pairs, it is believed that the distance per mode gives a fair indication of the extent of the road network relative to the rail network in Cape Town. A significant contribution to the length of rail trips is the fact that the rail network is radially outwards from the CBD, with an absence of north-south links in the eastern part of the city.
Total trip travel time
Table 6 shows the travel time of all three components for the four main modes. The in-vehicle travel time for the public transport modes ranges from 25% to 50% higher than that of the car. However, the waiting and walking time adds substantially to all public transport modes, and even doubles the total trip travel time for rail. The result is that travel time by public transport was recorded in the survey as between two and three times that of the car.
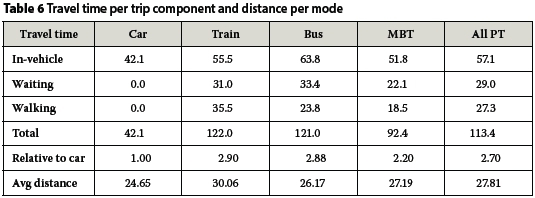
The Household Travel Survey (CCT 2013b) also found that persons travelling by train had the longest travel time at 75 minutes (during the AM peak). This was followed by bus travel at 71 minutes and minibus taxi at 51 minutes. Car drivers travelled an average of 46 minutes during the AM peak. The NHTS found a similar trend with the average travel time by train in the Western Cape, the longest at 81 minutes, followed by bus at 70 minutes, minibus taxi at 49 minutes, car at 40 minutes and walking only, at 29 minutes.
The average trip distance for all modes, including the car, was slightly lower than the average for all public transport modes, at 27.02 km.
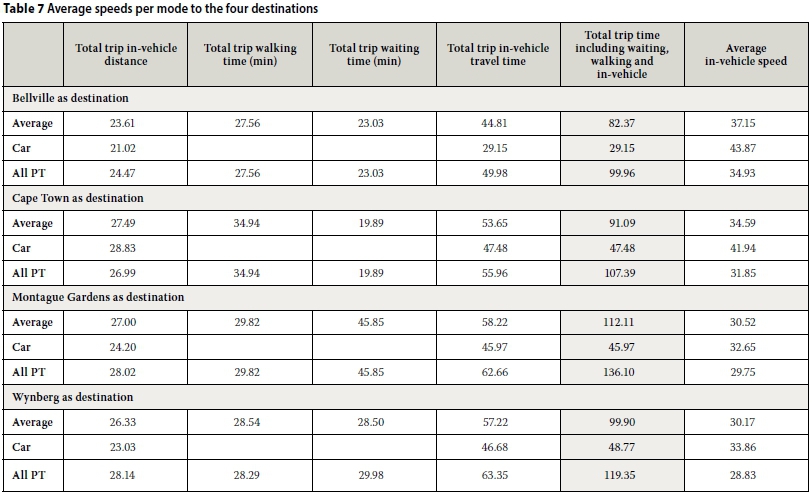
Travel time by mode to four typical destinations
The discrepancy between absolute and relative travel time between car and public transport is further highlighted by analysing the travel time differences between the four destinations. Table 7 shows that both mode choice and destination play a critical role in the competitiveness between car and public transport.
Bellville is the most central destination (shortest trip length) and therefore intuitively requires the shortest overall travel time. While Cape Town CBD is probably the most eccentric destination, the transport system developed radially from there to make it relatively more accessible by both modes. However, because of this radial nature, travel time by public transport is only about twice that of the car for Cape Town compared to the more than three times for Bellville. It is also the only destination where the distance by public transport modes is lower than for the car.
Table 7 also reveals that, while Montague Gardens is only the second longest trip by car, it requires the longest travel time by public transport. The much longer transfer time component also confirms the effect of this destination not being situated along a trunk public transport route, so that a second feeder trip is typically required. As discussed before, this second or third transfer time is longer than the first.
Discussion of findings
The above analysis confirms that, even for the relatively small sample, the analysis and comparison show that the data falls within typical ranges and is therefore considered acceptable for further interpretation.
The data shows clearly that public transport is not competitive with the car on a variety of fronts. Firstly, the distance of public transport trips is currently longer than that for the car. Secondly, the in-vehicle speed of the car is higher than the speed of public transport, and the car trip is not subjected to transfer time.
While cost-sensitive Capetonians are willing to walk long distances as a trade-off to incurring costs, this adds to their total trip length and reduces their accessibility. The use of bicycles to reduce the travel time of this component of the trip is notable, and a clear area of potential operational intervention that requires relatively minor infrastructure provision, at least initially.
While the proportion of people making transfers is relatively low, the length of transfers poses an area for significant improvement in total travel time. In addition, the in-vehicle travel time compares very poorly with international benchmarks, and is certainly also an area that holds significant potential for improvement.
The next step in the process is to interrogate where interventions should be made to reduce the actual travel time of public transport, as well as the travel time relative to the private car. This is done by comparing the impact of different strategies along a typical trip.
IMPROVING THE TRAVEL TIME RATIO IN CAPE TOWN
The competitiveness of public transport relative to the private car is usually calculated by travel time ratios, which are defined as the quotient of the travel time by private car and public transport between the same origins and destinations in the city (Jones Jr 2013). Evidence from the Stockholm region shows that for a travel time ratio of up to 1.5, the share of public transport is 50% to 70%. Therefore, public transport loses most of its competitiveness when the travel time ratio exceeds about 1.5.
In order to analyse this principle, the impact of reducing the travel time ratio for Cape Town from its current level to a desired level of 1.5 will be analysed. Since Cape Town is moving towards a single integrated public transport system (CCT 2013a), the objective is not to improve the travel time on individual modes, but rather for the system as a whole.
Equation to evaluate competitiveness of public transport
Figure 6 illustrates the different speed components of multi-modal public transport and the car between the same origin and destination. An equation is then constructed to test the impact of several variables on different travel time ratios for travel by public transport (TpT and travel by car (TC).

With Time (T) = Distance (L) / Speed (V), the travel time by car and public transport respectively are given by:
TPT = Time walking (w*) + Transfer time (Tr)
+ In-vehicle time mode (m)
+ In-vehicle time Main mode (M)
[* 1 for the first w, Tr or c; and 2 for the second w, Tr or c]
or

TC = Time on local roads (c) + Time on major roads (C) + Time walking to destination

The survey did not distinguish between cars travelling on minor or major roads, or between travelling on trunk or feeder-type services, since the current public transport system is not configured in this way. Table 8 provides the surveyed and estimated 2013 base values for the above equations, based on the following assumed trip distance split, as well as the prevailing travel time ratio:

■ average trip length = 27 km
■ average walking distance = 1.36 km
■ 70% of remaining distance on arterial roads or on trunk services = 18.0 km
■ 30% of remaining distance on minor roads or on feeder services = 7.7 km
In order to achieve a travel time ratio of 1.5, TpT has to be reduced by 16.1 to 77.1 minutes, by reducing one or several of the contributing components. Table 9 shows the proportion that different trip components must be reduced to, relative to the base case, in order to achieve the desired travel time ratio of 1.5. Figure 7 illustrates the impact of these scenarios in graphical format.

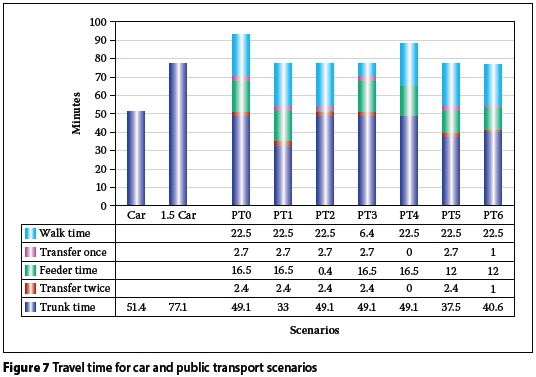
A comparison of the impact of Scenarios pT1, pT2 and pT3 indicates that the reduction in trunk travel time appears to be the single most effective measure to achieve the desired effect. It is evident from both Table 9 and Figure 7 that even removing transfers completely (Scenario PT4) does not, on its own, result in sufficient travel time savings.
The travel time of each component can be reduced by either reducing the distance factor or increasing the speed factor, or both, for each trip component. For example, while keeping the trunk distance at 18 km, the speed of the trunk mode needs to increase from 22 to 32.7 km/h in order to reduce the in-vehicle travel time to 33 minutes. This trunk vehicle speed falls comfortably within the range of 30 to 40 km/h suggested by Vuchic (2007). Increasing the trunk speed towards the upper end of the range would significantly reduce the travel time ratio, thereby increasing the competitiveness of public transport even further.
Each intervention comes at different implementation costs and time frames, as well as environmental and socio-economic drivers. The next section describes the considerations of these factors in context, without attempting to cost typical interventions.
INTERVENTIONS TO REDUCE TIME OF TRIP COMPONENTS
The competitiveness of the public transport system can be improved by considering the following factors that affect various interventions:
In-vehicle travel time
■ Providing dedicated or semi-dedicated right-of-way for trunk services is the most common infrastructure approach to giving a time advantage to public transport vehicles.
■ However, as seen by the very low speeds of the rail system, the quality of the way and protection from not only other vehicles, but also pedestrians, is critical to ensure that operational speeds match the infrastructure design speed.
■ Similarly, a high standard maintenance regime is required to ensure that the quality of the way is conducive to high speed travel.
■ The number of stops along a route plays a substantial role in the overall in-vehicle travel time. It is important that station spacing be optimised between the need to provide access and maintain high travel speeds. Where station spacing is low, operational and scheduling alternatives, such as skip-stop services, could be employed to balance these competing objectives.
Transfer time
■ The first transfer time can be reduced through a decrease in the headway of the departing mode, assuming there is adequate capacity so that passengers do not have to wait for the next vehicle.
■ Time in the feeder vehicle can be reduced through shorter trips to trunk, i.e. higher trunk coverage, or limited priority above general traffic, e.g. queue jump (Chitauka & Vanderschuren 2014) or pre-emptive signal activation.
■ The second transfer time can be reduced through:
■ Reduced walking time between feeder and main modes brought about through infrastructure design, and
■ A decrease in the headway of the departing mode, again assuming there is adequate capacity so that passengers do not have to wait for the next vehicle.
■ In designing an integrated public transport system, there is an opportunity in Cape Town to reduce the walking distance between arrival and departure modes by creating more compact interchange facilities. The footprints of Cape Town's interchanges are typically much larger than interchanges used by similar volumes of people in other developing cities (Schalekamp 2007). An example is that the furthest minibus taxi bay is more than 500 m from the entrance to the Bellville Station, before encountering stairs and access control to reach a rail platform.
■ Vertical integration between modes are virtually non-existent with only some of the most recently constructed stations offering some form of grade separation.
■ Transfer to minibus taxi vehicles has the added disadvantage that vehicles typically only depart when a minimum occupancy rate has been reached. This often leads to inordinately long transfer times on lower frequented routes.
Walking time
■ Walking speed cannot be changed as it is a characteristic of the community. However, walking time would probably improve marginally with increased fitness levels, as well as smooth and clean walkways.
■ Replacing walking with cycling trips would contribute significantly to a saving in current walking time, and could even replace short vehicle trips. At a speed of three to four times that of walking, this could substantially reduce the time to first access public transport. In some cases cycling could even replace the need for a feeder trip, especially where a relatively long walk and short feeder trips are required to access trunk services. Promoting a greater usage of cycling, however, requires the provision of adequate storage facilities at trunk stations, as well as the ability to take bicycles onto trains and buses.
■ Ingress walking distance can be reduced by increasing coverage of the feeder system (short-term strategy), or by increasing the land use density relative to the feeder or trunk access points (longer-term strategy). Not only does the former increase the overall cost of the transport system, but the latter approach also eliminates much of the lower speed components of the trip, hence resulting in a greater proportion of the trip at higher speed.
■ Egress walking distances can be reduced through higher density of end use destinations in closer proximity to the trunk stations.
DISCUSSION
An opportunity presents itself while planning to invest billions of rand on improving public transport systems in South Africa over the next decade or two. The focus of improvement should arguably fall primarily on travel time improvements, as this is affected by the capital programme. Operational quality improvements could be added to the system in a variety of ways in future.
Both the absolute and relative travel time of public transport, when compared to the private car, must be drastically reduced in Cape Town. Reducing the absolute travel time would add social benefits, by giving individuals more time for other priorities like family, leisure and further education. Reducing it relative to the car would positively influence asymmetrical churn (Chatterjee 2001; Del Mistro & Behrens 2006) in favour of public transport, eventually achieving a sustained shift from private car towards more efficient public transport modes.
In the distribution of travel time ratios for individual O-D pairs in a city, with an average of 1.5, there would be values below 1.0 (faster than car) while others could far exceed 2. A particular reduction in the average ratio could be achieved through small improvement for large passenger volumes, or large improvements for small passenger numbers. Strategies to attract choice passengers to public transport would probably focus on improvements at the margin of 1.5, while social objectives could drive a reduction in ratios that exceed 2.0.
Capital improvements must certainly focus on the right of way, and achieving high in-vehicle speeds within the appropriate technology. However, it is as important to reduce the transfer time in a multi-modal system by appropriate design of transfer facilities. At facilities where large volumes of passengers transfer, the vertical separation of modes should always be considered. The higher implementation cost can be offset by the value of both the cumulative time savings, as well as higher land development potential.
ACKNOWLEDGEMENT
This paper was produced under the MISTRA Urban Futures programme which promotes research towards sustainable urban development, under the theme: "Green, Fair and Dense". The time required for the writing process was afforded by the City of Cape Town.
REFERENCES
Cervero, R 1998. The Transit Metropolis - A Global Enquiry. Washington DC: Island Press. [ Links ]
Cervero, R 2013. Bus Rapid Transit (BRT) - An efficient and competitive mode of public transport. Proceedings, 20th ACEA, Scientific Advisory Group Report 20, Belgium. [ Links ]
Chatterjee, K 2001. Asymmetric churn - Academic jargon or a serious issue for transport planning? Bursar y paper presented to the Transport planning Society, UK (unpublished). [ Links ]
Chen, R & Mahmassani, H 2004. Travel time perception and learning mechanisms in traffic networks. Transportation Research Record, 1894(1): 209-221. [ Links ]
Chitauka, F & Vanderschuren, M 2014. An investigation into the performance of full BRT and partial bus priority strategies at intersections by micro-simulation modelling in a South African context. Proceedings, 33rd Southern African Transport Conference (SATC), 7-10 July 2014, Pretoria. [ Links ]
CCT (City of Cape Town) 2009. 2009 General Household Survey Analysis for Cape Town. Cape Town: City of Cape Town. [ Links ]
CCT (City of Cape Town) 2013a. Comprehensive Integrated Transport Plan. Cape Town: City of Cape Town. [ Links ]
CCT (City of Cape Town) 2013b. Household Survey Report - Final Draft. Cape Town: City of Cape Town. [ Links ]
CROW (Centre for Research and Contract Standardisation in Civil Engineering) 1998. Recommendations for traffic provision in built-up areas (ASVV). Ede, Netherlands: CROW. [ Links ]
Del Mistro, R & Behrens, R 2008. How variable is variability in traffic? How can TDM succeed? Proceedings, 27th Southern African Transport Conference (SATC 2008), 7-11 July 2008, Pretoria. [ Links ]
DoT (Department of Transport) 2007a. Public Transport Strategy. Pretoria: Department of Transport. [ Links ]
DoT (Department of Transport) 2007b. Public Transport Action Plan. Pretoria: Department of Transport. [ Links ]
Emmerink, R, Axhausen, K, Nijkamp, P & Rietveld, P 1995. Effects of information in road transport networks with recurrent congestion. Transportation, 22(1): 21-53. [ Links ]
Goodwin, P B 1995. Car dependence. Transportation, 2(3): 151-152. [ Links ]
Hassan, M N, Hawas, Y E & Ahmed, K 2013. A multidimensional framework for evaluating the transit service performance. Transportation Research Part A: Policy and Practice, 50: 47-61. [ Links ]
Hermant, L F L 2012. Video data collection method for pedestrian movement variables and development of pedestrian spatial parameters simulation model for railway station environments. PhD thesis, Stellenbosch: University of Stellenbosch. [ Links ]
Jones, S L Jr (Ed.) 2013. Proceedings, 3rd International Conference on Urban Public Transportation Systems, Paris, 17-20 November 2013. [ Links ]
Metz, D 2010. Saturation of demand for daily travel. Transport Reviews, 30(5): 659-674. [ Links ]
Schalekamp, H V 2007. Towards a user-oriented approach in the design and planning ofpublic transport interchanges. MPhil dissertation, Cape Town: Department of Civil Engineering, University of Cape Town. [ Links ]
Schafer, A & Victor, D G 1998. The future mobility of the world population. Transportation Research Part A: Policy and Practice, 34(3): 171-205. [ Links ]
StatsSA 2014. 2013 National Household Travel Survey. Pretoria: Statistics SA. [ Links ]
Vuchic, V 2007. Urban Transit Systems and Technology. New York: Wiley. [ Links ]
Wentley, O & Hitge, G 2013. Understanding the utilisation of Park and Ride facilities (Cape Town - 2012). Proceedings, Southern African Transport Conference (SATC), 8-11 July 2013, Pretoria. [ Links ]
 Correspondence:
Gerhard Hitge
ELUT
PO Box 2072
Durbanville, 755'
Cape Town
T: +27 (0)82 372 2730
E: gerhardhitge@mweb.co.za
Prof Marianne Vanderschuren
Centre for Transport Studies
University of Cape Town New Engineering Building
Rondebosch, 8000
South Africa
T: +27 (0)21 650 2593
E: marianne.vanderschuren@uct.acza

GERHARD HITGE Pr Eng has been working as a transportation engineer in both the public and private sectors for the past 20 years, and has a Master's Degree in Transportation Engineering (University of Pretoria). He was employed by Transport for Cape Town (TCT) at the time of writing this paper, and now operates as an ndependent consultant. His current focus is or the development of integrated, multi-modal transport systems that are sustained by higher-density, mixed-use urban development.

A/PROF MARIANNE VANDERSCHUREN (who is an Associate Member of SAICE) has a Bachelor's Degree in Transport Planning and Engineering (Tilburg, Netherlands), a Masters Degree in System Engineering, Policy Analysis and Management (Delft, Netherlands) and a PhD in Modelling of Intelligent Transport Systems (Enschede, Netherlands). In 2000 she moved to South Africa. Here she has been researching the transferability of 'developed world' knowledge in sustainable transport to South Africa and surrounding countries.

