


Serviços Personalizados
Artigo
 Inglês (pdf)
 Artigo em XML
 Referências do artigo
Indicadores

Links relacionados
-
 Citado por Google
 -
 Similares em Google
Compartilhar

 Permalink
Journal of the South African Institution of Civil Engineering
versão On-line ISSN 2309-8775
versão impressa ISSN 1021-2019
J. S. Afr. Inst. Civ. Eng. vol.57 no.3 Midrand Set. 2015
http://dx.doi.org/10.17159/2309-8775/2015/V57N3A1
TECHNICAL PAPER
Evaluation of the effect of deteriorating riding quality on bus-pavement interaction
C M W Dreyer; W J vd M Steyn
ABSTRACT
Deteriorating riding quality has a negative impact not only on infrastructure, but on the road user as well. Road users experience higher vehicle operating costs (VOCs), longer travel times, congestion and uncomfortable rides, to name a few. The purpose of this paper is to demonstrate the link between deteriorating riding quality and high vertical accelerations (awz) and VOCs for a bi-articulated bus on an identified bus route with different responsible road authorities in rural Mpumalanga, South Africa. The link, as identified, indicated that the speed the bus travelled played a big role in the generation of awz. Recommendations for future research are also proposed.
Keywords: vertical accelerations, riding quality, bi-articulated bus, vehicle operating costs, road conditions, maintenance
INTRODUCTION AND BACKGROUND
In Mpumalanga, only about 25% of house holds have access to private transport, which makes Mpumalanga one of the provinces with the highest use of public transport (bus or taxi) (DOT 2003). Even though the road network in Mpumalanga is extensive, the maintenance and upgrade of this network is a concern, especially with regard to municipal and provincial roads. Deteriorating roads have a direct impact (such as vehicle operating costs (VOCs)) and an indirect impact (such as high bus fares) on the road user.
Steyn et al (2011) indicated that, in order to maintain the condition of a road to ensure a safe, reliable and smooth trip for road users, as well as protecting the underlying materials, routine road maintenance is required. If the road is not maintained on an ongoing basis, the structural strength of the pavement reduces over time.
A number of factors determine the efficient operation of a country's economy, such as an efficient economical system, efficient logistics system, and an efficient transport system (Steyn et al 2011). Recently, the focus on a country's logistics costs (goods transportation) has become more visible, as these costs have a direct effect on the broader economy. An increase in goods transportation costs leads to an increase in end-product costs to the consumer and that, in turn, leads to a decrease in the global competitiveness of a country, as products become more and more expensive (SOL 2012). Various studies (Chatti & Zaabar 2012; Steyn & Bean 2010; SOL 2010) have proved that deteriorating road quality results in significant increases in repair and vehicle maintenance costs, fuel consumption and tyre wear, which in turn, lead to an increase in company logistics costs.
This paper focuses on a study of the interaction between a bi-articulated bus and the pavement surface of one specific bus route in Mpumalanga, including the associated VOCs generated. The objective of the paper is thus to demonstrate the use of vehicle-pavement interaction data to evaluate the effect of road and operating conditions on ride quality and VOCs in bi-articulated buses on typical routes.
Mpumalanga road network
There is an estimated 5 400 km of paved roads in the Mpumalanga Province, and an estimated 8 500 km of gravel roads (MDPWRT 2013). The provincial roads of the Mpumalanga Province fall under the responsibility of the Mpumalanga Department of Public Works, Roads and Transport (MDPWRT). The establishment and maintenance of the local municipal roads and streets infrastructure is the responsibility of the district and local municipalities.
If road maintenance is delayed for more than five years, the construction cost to repair the pavement increases by six to eighteen times, excluding other indirect and direct costs (SAICE 2011). Indirect costs include costs experienced by the non-driver, for example increases in food prices, as fuel and time are wasted on deteriorating or congested roads. Direct costs include VOCs, as well as fuel and time wasted on deteriorating or congested roads.
Road roughness and riding quality
The definition of road roughness is the une-venness of a pavement surface defined over an interval between two specified points (Sayers & Karamihas 1998). Engineers use road roughness as the primary indicator of the condition of the road (riding quality). By determining the road roughness of a pavement, engineers can estimate what maintenance, if any, is required in order to restore the pavement to acceptable riding quality levels (Steyn et al 2011). The International Roughness Index (IRI) is the most widely used statistic to indicate the riding quality of a pavement.
Riding quality affects VOCs directly, since the tyres and suspension system transfer the unevenness of the road surface as vertical accelerations to the vehicle. These vertical accelerations can lead to damage of vehicle components, as well as to an increase in fuel consumption. Further damage can be caused to the cargo being transported, depending on the suspension and speed of the vehicle (Steyn et al 2011).
The riding quality of a road surface influences the travel experience significantly. An uneven road surface translates the vibrations through the suspension and tyres to the vehicle body, and from there to the occupants, driver and cargo (Von Becker 1992).
The judgement of the road user depends largely on the ride experienced by the user's vehicle (Sayers & Karamihas 1998). In addition, according to Gillespie (1992), vertical acceleration measurement is the most common and meaningful measure of ride vibration. It is very difficult to objectively evaluate the perception of comfort experienced by a road user while driving on a road. Furthermore, there is no standard to determine human discomfort, or comfort expressed in physical terms such as acceleration or amplitudes at a given frequency. Gillespie (1992), however, concluded from various investigations that there is enough proof in the available test data to outline a zone above which vibration is certainly intolerable and below which it is irrelevant.
Logistic costs
Transport costs, storage and port costs, inventory-carrying costs and management costs, administration costs and profit are typically incorporated into the logistics costs. By controlling and managing these costs effectively, a country's logistics costs stay in balance with the cost of general goods (SOL 2012).
Extensive information is available on the effects of riding quality on VOCs, including the models used to determine these effects. NCHRP (National Cooperative Highway Research Program) Project 1-45 developed a VOC model that reflects relevant and up to date vehicle technology. Most models relate VOCs with oil and fuel consumption, tyre wear, maintenance, and repair and depreciation (Chatti & Zaabar 2012).
Research methodology
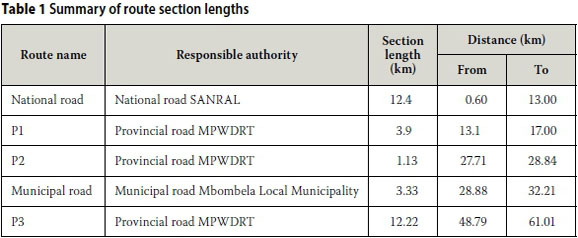
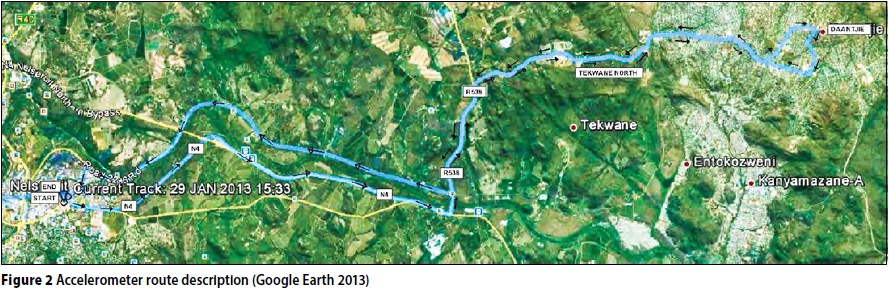
The identified bus route, as indicated in Figure 2 and Table 1, consisted of roads with different roughness levels and different responsible authorities. This research should provide an objective indication of the level of increased costs down the line due to the perceived savings by not maintaining a road regularly. It is envisaged that the results of the study upon which this paper is based can be used to motivate for more emphasis on regular maintenance, and resultant lower VOCs on the South African road network (specifically at provincial and municipal level).
The case study included a route surveyed with a profiler and a bus fitted with acceler-ometers at the locations where the vertical accelerations were expected to be the highest (Figure 1). The accelerometers with the highest accelerations were sensors 11 and 12, located on the driver side in the rear of the bus and the rear of the trailer. The outputs received from the surveys were vertical accelerations, bus speed, roughness of the road, and GPS coordinates.
The road roughness data for each road authority (municipal, provincial and national) was categorised in three riding quality categories. The road roughness anomalies for each section were identified with a box plot, and the cause of these anomalies were determined. Some were speed humps, potholes, stop-controlled and/or robot-controlled intersections, or differences in surfacing. These values were not discarded, but were analysed with the data, as the anomalies formed part of the route.
The impact of road roughness on fuel consumption, tyre wear, and repair and maintenance costs was analysed. The calibrated HDM4 model (Chatti & Zaabar, 2012) was used to predict the fuel consumption, tyre wear, and repair and maintenance cost per km of each section of the bus route under consideration.
The methodology followed included the following steps:
■ Determine riding quality
■ Determine the VOC
■ Simulate the impact of an increase in roughness
■ Simulate the impact of a decrease in roughness
■ Measure the vertical accelerations generated by the bus
■ Link the deteriorating riding quality to the cost impact of the user/passenger/bus company, etc.
Different scenarios were sketched by simulating improvements in the road roughness of each section of the bus route and evaluating the projected costs (HDM4) if only certain sections of the bus route could be upgraded.
Survey location
The route was selected so that it consisted of roads representing different responsible authorities. The accelerometers were mounted on the bus at the Nelspruit bus terminal, where commuters board the bus to travel to Nkomeni (route indicated in Figure 2). Five sections were identified (see Table 1). The road sections were a national road, three provincial roads (P1, P2 and P3) and a municipal road.
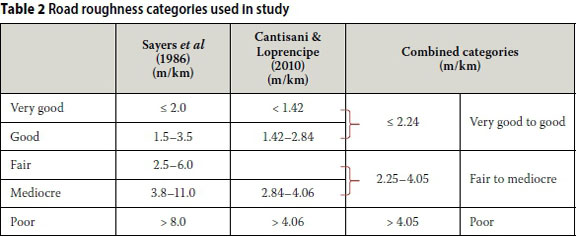
Threshold values
The road roughness categories used in this paper were developed from Sayers et al (1986) and Cantisani and Loprencipe (2010) (Table 2). The categories from Cantisani and Loprencipe (2010) were combined into three, i.e. very good to good as the first category, fair to mediocre as the second, and poor as the third category. The anomalies of each section were identified with a box plot. These values fall in the poor category, however, because of the high IRI values at specific locations, as singled out by the data.
The roughness of each road section was categorised with the limits from Table 2, and the results are indicated in Table 3. The results of the national road section were as expected, with most of the section in the very good to good category and with very little of the road section in the poor category. However, a third of the section under consideration was in the fair to mediocre category, which was higher than expected.

The results of the provincial road sections, however, indicated that the provincial roads were in a worse condition than expected. According to the data, P2 and the municipal road were in the worst condition, with 31.6% and 41.3% respectively of the roads in the poor and anomaly category. Section P3, however, was in a better condition than expected, even better than the tested section of the national road, as the roughness measured was lower.
Vehicle operating cost model
The calibrated HDM 4 model (Chatti & Zaabar 2012) was used to determine fuel consumption, tyre wear, and repair and maintenance cost per km. The calculations were based on the data generated from the profiler on the bus route. The costs are indicated in Tables 8, 9 and 10 for one bus on each section measured per km.
RESULTS
Comfort is difficult to evaluate objectively, as user perception of dynamic effects plays a major role. The evaluation of the root mean square (RMS) acceleration (awz) is required to determine the comfort of a road. ISO 2631 (1997) was applied to calculate the vertical acceleration (awz). The speed-related awzthresholds proposed by Cantisani and Loprencipe (2010) were adopted for the analysis of the data (Table 4). The road roughness versus speed versus vertical acceleration was plotted on three-dimensional graphs to indicate the impact of speed on the vertical acceleration data.

Anomalies
The road roughness on the national road section was generally very good, and the anomalies were analysed in the poor category. The anomalies identified on the P1 section were due to bridge construction joints, uneven patching and surface failures. Consecutive surface failures (potholes) were the cause of the anomalies on section P2. The municipal road section was in a deteriorating state, and the highest roughness was measured on this section. The reasons for the anomalies on this section were due to the fact that this road had quite a number of speed humps, as the road section was in a residential area. The community tried to curb speeding by requesting speed humps that were higher than design standards. The speed humps have a negative effect on the riding quality, bus suspension, VOCs and fuel consumption. The remaining identified anomalies on the municipal road section were uneven patching and surface failures, such as potholes. The measured data of section P3 indicated that this section was in an average state. The reasons for the anomalies were indicated as bridge joints and consecutive potholes. The last anomaly was the result of the surface changing to concrete paving blocks, with higher roughness and also a sharp horizontal curve.
vertical acceleration (awz)versus roughness versus speed
Three-dimensional graphs were plotted to indicate the effect speed has on vertical acceleration, and therefore on users' perception of ride comfort.
National road section
The data recorded over the length of the national road section on sensors 11 and 12 was analysed. Uniform sections that fell into one category were identified over the route, and from these sections the weighted averages over the length of the section were calculated for each road authority. The national road section results are shown in Table 5.

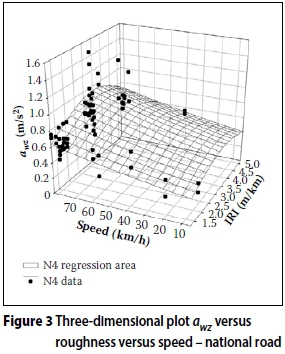
The awzvalues and road roughness were expected to be quite low on this road section. It was also expected that the higher the road roughness, the higher the vertical accelerations would be. The weighted averages, however, indicated lower accelerations at a higher road roughness. Another parameter that should be included in the discussion is speed. The vertical accelerations were influenced by the road roughness, as well as by the speed of the vehicle. Cantisani and Loprencipe (2010) indicated that a section of surface failure will register a high road roughness, but depending on the speed the vehicle travels over that surface failure, the accelerations could be high and low. Therefore, Cantisani and Loprencipe (2010) indicated that if the vehicle speed was reduced, a higher level of roughness could be tolerated.
Figure 3 indicates a three-dimensional plot of the vertical accelerations and average speed of the bus at the corresponding road roughness. The vertical accelerations were calculated from the accelerometers mounted on the bus, while the speed was calculated from the GPS points recorded during the survey, and the road roughness was obtained from the profiler data. Google Earth (2013) was used to correlate the GPS points with the isolated sections and road roughness.
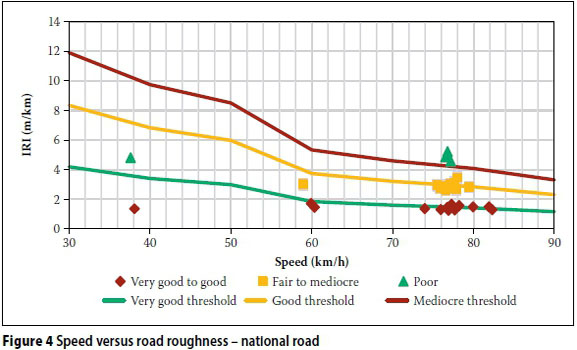
In Figure 4 the speed versus road roughness is presented. The thresholds, indicated in green, orange and red, were deduced from the research done by Cantisani and Loprencipe (2010).
Provincial road sections
The data collected on the provincial road sections was analysed in a similar manner as for the data collected on the national road. P2 was in the worst state, and therefore will be discussed in this paper. Table 6 indicates the weighted average values of the isolated data for P2.
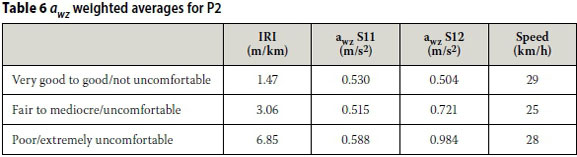
Compared to the national road data, the road roughness recorded on this section was higher, which was expected. The accelerations, however, were recorded as lower, even though this section was visibly in a worse condition than the national road. The difference in values could be due to variation in speed. On this section it was not possible to drive at the posted speed of 60 km/h, as the road was in a deteriorated state, and there were too many potholes and speed humps. Therefore, in order to prevent further damage to the bus, the driver had to drive slowly. Hence the speeds indicated in Table 6 were significantly lower than those recorded on the national road section. This is not ideal, as the state of the road, congestion, speed humps and consecutive bus stops result in longer travel time. The impact of poor riding quality on travel time and congestion was deemed outside the scope of this case study.
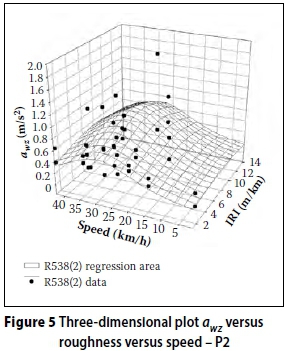
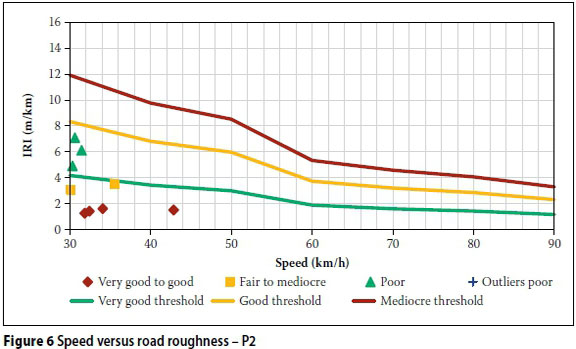
Figure 5 shows a three-dimensional plot of the accelerations versus speed versus road roughness. The recorded speeds on these sections were very low. This section, however, was also very short (approximately 1 km) relative to the other sections. After the data analysis (which included isolating uniform sections) it seemed that the length of the section may be too short to make relevant conclusions with this data. The speed versus road roughness (Figure 6) correlates with the findings that this section might be too short to make relevant conclusions.
Municipal road section
The data collected on the municipal road section was analysed as shown in Table 7. Similar to the data recorded on the P2, the average speeds on this section of the route were very low. The roughness values were also very high on this route. The awzvalues, however, for the not uncomfortable and extremely uncomfortable ranges were higher than those recorded on the national road. Furthermore, the values indicated that the road was in such a deteriorated state that it was not possible to drive faster.

The three-dimensional plot in Figure 7 indicates high roughness and awzvalues for low speeds, and high awzvalues and low roughness values at high speeds. This is consistent with the data on the national and provincial road sections. Speed also played a significant role in users' perception of how the bus travelled on the road.
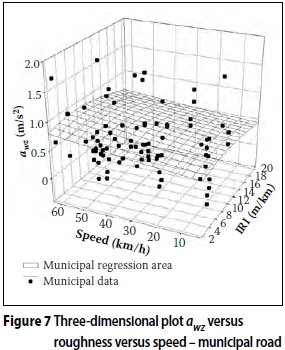
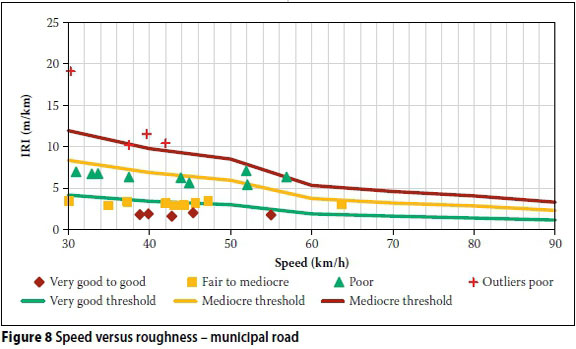
Figure 8 shows the data of the municipal road section sorted into the thresholds as proposed by Cantisani and Loprencipe (2010). The very good to good, and fair to mediocre values fell in the range as proposed by Cantisani and Loprencipe (2010). The poor values, however, according to this graph, actually still fall in the good to very good category.
The principal results of this case study were that speed played a determining role in the generation of vertical accelerations, and therefore user comfort and VOCs. The anomalies indicated that high roughness values were generated by driving over a surface failure (such as a pothole), change in surfacing (from asphalt to concrete block paving), uneven patching, speed humps or bridge construction joints.
As road roughness indicates the state of the road surface, the national road section was mostly in a good state, with about 60% in the very good to good riding quality category. Section P1 was in a good state, with 55% in the very good to good riding quality category. The two sections with the highest roughness values were sections P2, with 30% in the poor category, and the municipal road section, with 40% in the poor category. These values were as expected; however, section P3 was in a better state than expected, with only 14% in the fair to mediocre category and 9% in the poor category.
The vertical accelerations measured by the accelerometers indicated the comfort of the ride. However, the speed the bus travelled played the largest role in evaluating user comfort. P2 and the municipal road were the two sections with the highest roughness values, and on these sections the bus travelled at the lowest speeds.
Costs associated with public transport
In order to demonstrate the potential effect of road conditions on fuel, tyre, and repair and maintenance costs, an analysis was done on each section encountered on this specific bus route. The current projected average cost of an articulated truck (bus) travelling on this route was calculated with the HDM4 model (Chatti & Zaabar 2012). Thereafter, the following scenarios were analysed:
1. Impact on VOCs if the road roughness decreases
2. Impact on VOCs if the worst sections were upgraded
3. Impact on VOCs if the road roughness increases.
The first scenario was to determine the associated costs of a bus route with an average road roughness that falls below the good to very good threshold. The roughness values that were worse than 2.24 m/km (worse roughness than the good to very good threshold) was changed to 2.24 m/km in the analysis. Costs were projected with the HDM4 model developed by Chatti and Zaabar (2012).
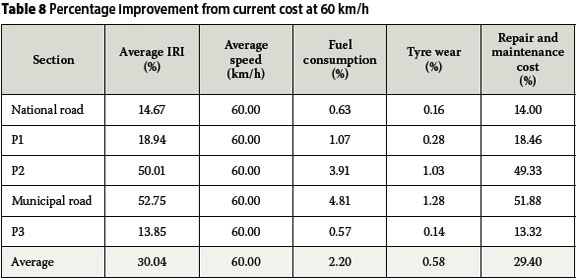
The fuel consumption and tyre wear values did not change significantly, but the repair and maintenance costs decreased significantly. The percentage decrease in costs is indicated in Table 8. The speed shown in Tables 8 and 9 is 60 km/h so that it is the same for each road in order to make relevant conclusions. The fuel consumption decreased with an average of about 2% over the whole route. The improved roughness impacted section P2 and the municipal road section the most, with a decrease in fuel consumption of about 4% and 5% respectively. The tyre wear decreased with an average of about 0.6% over the whole route. The repair and maintenance costs decreased with about 30% over the whole length of the bus route, with the municipal road section at a decrease of 50% and section P2 at a decrease of about 52%.
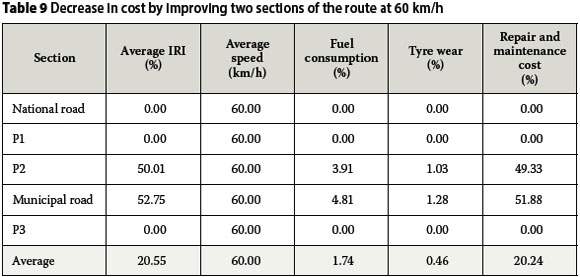
It could be costly to upgrade the whole bus route to an acceptable roughness (below the very good to good roughness threshold of 2.24 m/km), and therefore the impact of upgrading the two worst sections (P2 and the municipal road) was determined. Indicated in Table 9 is the potential decrease in costs, determined by the HDM4 model (Chatti & Zaabar 2012) if the roughness of section P2 and the municipal road section was decreased to an average roughness below 2.24 m/km.
Data in Table 9 indicates that, by upgrading the two worst sections of the road, a saving of about 2% in fuel consumption, 0.5% in tyre wear and about 20% on repair and maintenance cost could be possible for the bus travelling on this bus route.
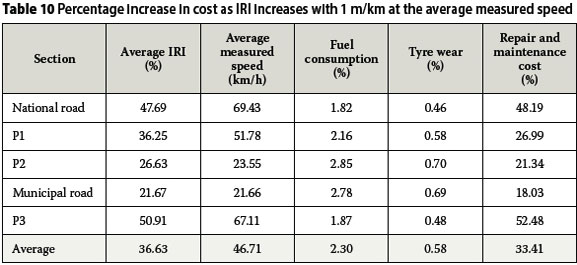
In order to demonstrate the impact of no maintenance, the roughness on the sections was increased with 1 m/km. Table 10 shows the percentage increase in fuel consumption, tyre wear, and repair and maintenance cost if the roughness increased by 1 m/km from the current values. The speed indicated in Table 10 is the average speed the bus travelled on each road for the case study.
CONCLUSIONS
Even though it is very difficult to quantify the level of comfort on a section of road for the road user, it is possible to give an indication. The riding comfort on the bus route depends on more factors than the road surface, the suspension, type of vehicle and interior of a vehicle. Even though the road surface does play a large role, the speed the vehicle travels plays the most significant role and has the biggest impact on VOCs.
The three-dimensional plots indicated that high roughness and awzvalues were recorded at low speeds, with high awzvalues and low roughness values at high speed. Therefore, it can be concluded that, due to an uneven road surface, road users tend to drive slower for a more comfortable ride, as it decreases the vertical accelerations.
The scenario was analysed to improve the riding quality of the two worst sections of the bus route, and by improving the road surface of these two sections the VOCs reduced, with 2% in fuel consumption, 0.5% in tyre wear and about 20% on repair and maintenance costs. Lack of maintenance is often the cause of deteriorating roads, and the impact was simulated by increasing the surveyed roughness values with 1 m/km. The increases in VOCs were 2% in fuel consumption, 0.6% in tyre wear and about 33% on repair and maintenance costs.
There are various research opportunities around this topic, which should be investigated further. The bus company can determine the cost of maintaining the bus route, versus the current VOCs for the buses.
Recommendations
This paper focused on a case study that did not include the impact of the bus mass, suspension system or bus interior. Therefore, recommendations for further research would be to include these factors as they may influence the outcome. Furthermore, driver fatigue, trip duration and congestion caused by deteriorating riding quality could also be included in further studies.
REFERENCES
Cantisani, G & Loprencipe, G 2010. Road roughness and whole body vibration: Evaluation tools and comfort limits. ASCE Journal of Transportation Engineering, 136(9): 818-826. [ Links ]
Chatti, K & Zaabar, I 2012. Estimating the effects of pavement conditions on vehicle operating costs. National Cooperative Highway Research Program (NCHRP) Report 720, Transportation Research Board (TRB), Washington D.C. [ Links ]
DOT (Department of Transport) 2003. Key Results of the National Households Travel Survey. Available at: www.arrivealive.co.za [accessed on 13 July 2012]. [ Links ]
Gillespie, T D 1992. Fundamentals of vehicle dynamics. Warrendale, PA, US: SAE International. [ Links ]
Google Earth 2013. Available at: www.google.com [accessed on 16 November 2012 and 30 March 2013]. [ Links ]
ISO 2631-1 1997 Mechanical Vibration and Shock -Evaluation of Human Exposure to Whole-Body Vibration. Part 1: General Requirements. Geneva: International Standards Organization. [ Links ]
MDPWRT (Mpumalanga Department of Public Works, Roads and Transport) 2013. Annual Report 2012/13. Available at: www.dpwrt.mpg.gov.za [accessed on 28 January 2014]. [ Links ]
SAICE (South African Institution of Civil Engineering) 2011. SAICE Infrastructure Report Card. Midrand: SAICE. Available at: www.saice.co.za [accessed on 3 February 2012]. [ Links ]
Sayers, M W, Gillespie, T D & Paterson, W D O 1986. Guidelines for conducting and calibrating road roughness measurements. World Bank Technical Paper number 46, Washington D.C.: The World Bank. [ Links ]
Sayers, M W & Karamihas, S M 1998. Little Book of Profiling. Michigan, US: The Regent of the University of Michigan. [ Links ]
SOL (State of Logistics) 2010. Seventh Annual State of Logistics Survey for South Africa. Pretoria: CSIR. [ Links ]
SOL (State of Logistics) 2012. Ninth Annual State of Logistics Survey for South Africa. Pretoria: CSIR. [ Links ]
Steyn, W J v d M & Bean, W L 2010. The potential effects of deteriorating road quality and maintenance in South Africa: Exploring benefit-cost analysis. In: Seventh Annual State of Logistics Survey for South Africa, Pretoria: CSIR. [ Links ]
Steyn, W J v d M, Bean, W, King, D & Komba, J 2011. Evaluation of selected effects of pavement riding quality on logistics costs in South Africa. Transportation Research Record, No. 2227. [ Links ]
Von Becker, P J 1992. Impacts on the road and their effects on road construction and road preservation costs. In: Cebon, D (Ed.), Heavy vehicles and Roads: Technology, Safety and Policy. London: Institution of Civil Engineers. [ Links ]
 Correspondence:
Willemien Dreyer
Lidwala Consulting Engineers
PO Box 2930
Nelspruit 1201
South Africa
T: +27 (0)861 543 9252
E: wdreyer@lidwala.com
Prof Wynand Steyn
Department of Civil Engineering University of Pretoria
Private Bag X20 Hatfield 0028
South Africa
T: +27 (0)12 420 2171
E: wynand.steyn@up.ac.za

WILLEMIEN DREYER Pr Eng, an Associate Member of SAICE (South African Institution of Civil Engineering), works for Lidwala Consulting Engineers in Nelspruit, in the Mpumalanga Province of South Africa. She obtained a BEng (Civil Engineering) degree in 2009, a BEng (Hons) in Geotechnical Engineering in 2012, and an MEng in Transportation Engineering in 2014, all at the University of Pretoria. Her areas of interest are geometric and pavement engineering.

PROF WYNAND STEYN Pr Eng, a member of SAICE (South African Institution of Civil Engineering), is a pavement engineer with a research interest in vehicle-pavement interaction, accelerated pavement testing, and pavement materials and instrumentation. He obtained a PhD in Civil Engineering at the University of Pretoria in 2001. He spent 19 years with the CSIR (Council for Scientific and Industrial Research) in various positions, and is currently professor of civil engineering (focusing on road pavement related subjects) at the University of Pretoria. His professional activities include academic and industry research in the areas of pavement engineering, vehicle-pavement interaction, and pavement materials. He has authored and co-authored 19 journal papers, 14 book chapters and 68 conference papers.

