


Services on Demand
Article
 English (pdf)
 Article in xml format
 Article references
Indicators

Related links
-
 Cited by Google
 -
 Similars in Google
Share

 Permalink
Journal of the South African Institution of Civil Engineering
On-line version ISSN 2309-8775
Print version ISSN 1021-2019
J. S. Afr. Inst. Civ. Eng. vol.57 n.2 Midrand Apr./Jun. 2015
http://dx.doi.org/10.17159/2309-8775/2015/v57n2a5
TECHNICAL PAPER
Some shortcomings in the standard South African testing procedures for assessing heaving clay
P R Stott; E Theron
ABSTRACT
Design of foundations for most light structures in South Africa, and in particular for low-cost housing, relies heavily on particle size analysis and the determination of Atterberg Limits. The tests for these properties are currently performed in commercial materials testing laboratories using the procedures of the CSIR's Technical Methods for Highways Part 1 (TMH1) (CSIR 1986). SANS 3001 (SANS 2011) is being phased in to replace TMH1. Both are primarily concerned with road construction. Investigations at the Central University of Technology indicate serious shortcomings in both of these norms in the context of foundation design for light structures. Highly plastic material is not usually used as road construction material, and these methods may be adequate to simply identify material so plastic that they should not be used in road construction. Structural foundations, particularly for low-cost housing, do not usually have this option; it is essential to estimate the actual heave potential. This investigation suggests that some of the changes proposed in SANS 3001 may be beneficial for heave assessment, but the most likely application of SANS 3001 could be unsatisfactory in many cases.
Keywords: expansive clay, TMH methods, SANS 3001, liquid limit, plasticity index, linear shrinkage
INTRODUCTION
Semi-arid and dry sub-humid areas in South Africa and many other parts of the world are noted for heaving foundation problems. Intense seasonal rainfall and lengthy intervals of drought lead to soils alternating between desiccation and saturation. Some types of clay minerals, particularly the smectite group, change volume powerfully with change in moisture content.
The behaviour of clay depends on its physical and chemical make-up. Detailed analysis of the structure and composition of clay is time-consuming and requires sophisticated apparatus and highly skilled personnel. Experience has shown, however, that valuable insights can usually be gained by simple tests performed with inexpensive equipment. The tests on which most engineers in South Africa make their assessments are detailed in the CSIR's Technical Methods for Highways Part 1 (TMH1) (CSIR 1986). SANS 3001 Civil Engineering Test Methods (SABS 2011) is being phased in to replace the TMH1 methods. The SANS 3001 procedures are similar to the TMH1 methods with a number of modifications. There is considerable resistance to the introduction of SANS 3001, since some of its procedures are commercially unattractive.
The methods examined here are:
■ Liquid Limit - TMH1 Method A2 (SANS 3001 GR10, GR11, GR12)
■ Plastic Limit and Plasticity Index - TMH1 Method A3 (SANS 3001 GR 10, GR11, GR12)
■ Linear Shrinkage - TMH1 Method A4 (SANS 3001 GR 10).
Note: Linear Shrinkage determination was removed from TMH1 in the latest edition, but it has remained as one of the "foundation indicators" (TMH1 (1986) A1 - A6) offered by commercial laboratories. Its re-introduction in SANS 3001 GR10 is stated to be for assessing the shrinkage product of wearing course gravels.
The methods of preparing samples on which these tests are performed (TMH1 A1(a), SANS 3001 GR1, GR2) play a vital role in the effectiveness of the tests, and some aspects of their influence are considered in the section below titled "PREPARATION OF MATERIAL".
It appears possible that the above methods (in TMH1 form), if strictly followed, may give acceptable results in highway applications. Highly plastic clay is usually rejected as a construction material in highway construction. The TMH1 and SANS 3001 tests may be adequate for simply identifying materials so plastic that they must be rejected or given special treatment.
Light structures in general, and low-cost houses in particular, have limited prospects for removal of problem material. Removal is too expensive and the engineer usually has to design foundations which can cope with heaving clays, rather than avoid them. To make matters worse, very little of the budget is dedicated to soils testing and the most economical procedures are favoured.
These considerations are particularly relevant to housing subsidy scheme projects, where many houses have suffered severe distress due to the activity of heaving clays. One of the reasons for this may be poor assessment of heave potential due to shortcomings of current testing procedures. It should be noted that it is possible to have soils tests performed by academic institutions and specialised geotechnical laboratories. These services appear to be rarely, if ever, used on economic housing projects since they come at a premium and the budget for geotechnical investigation is extremely small. Only commercial materials testing laboratory services are considered in this paper.
REASONS FOR THE CURRENT INVESTIGATION
Concern over the large number of failures in subsidy houses led to a series of tests being carried out on clay soils from a housing development project at Botshabelo in the Free State. Samples of raw, undried, unsieved soil (extracted from a test pit in a very moist condition) consistently gave a Liquid Limit (LL) of 67 and a Plasticity Index (PI) of 43 with scatter in results of ± 1.5. The same soil, tested in an accredited materials laboratory using their normal preparation method (stated to be TMH1 A1(a)) gave an LL of 50 and a PI of 25. When the commercial values were used in the heave prediction methods of Van der Merwe (1964) and Savage (2007) the estimated heave was approximately half that given by the "raw sample" values.
Reasons for the apparent anomaly were sought. One possible source of error is the Casagrande apparatus specified by both TMH1 and SANS 3001 for the determination of the Liquid Limit. It is widely considered to be susceptible to operator bias, and has been replaced by falling cone apparatus in the standards of many countries. The possibility of using this apparatus in South Africa was examined by Sampson and Netterberg (1984). However, correlations with TMH1 and other standards were not always straightforward, preparation of samples for testing had certain disadvantages and the proposed methods were not preferred by testers. The fall cone was not adopted in SANS 3001. Its suitability for South African use is currently being reinvestigated at the Central University of Technology (CUT) in Bloemfontein.
To gain an approximate measure of operator bias and other possible sources of error in the current procedures a team of six testers tested a range of clay soils at the geotechnical laboratory of CUT. The number of testers were reduced to four after the general magnitude of operator influence had been established. These tests suggest that there are, indeed, deficiencies in the usual implementation of the TMH1 procedures, but operator error cannot account for their magnitude. Some of the deficiencies have been addressed in the SANS 3001 methods, but others not.
It is proposed here to examine the more familiar TMH1 methods first and then consider the implications of the SANS 3001 modifications.
PREPARATION OF MATERIAL
Preparation of material for grading and indicator tests is specified in TMH1 Method A1(a) and SANS 3001 GR1, GR2, and GR5. Since the commercial "foundation indicator tests" employ Method A4 from TMH1 (CSIR 1986) this is the version considered here. Method A1(a) includes steps 3.4 (Boiling and washing) and 3.5 (Drying and disintegration of fines). Personal discussions with laboratory personnel, and comparison of results from commercial laboratories with those obtained at CUT and at the Soil Science Department of the University of the Free State suggest that these two steps may be omitted in many cases. These steps take time, laboratory space and energy. This investigation found that in many cases this will lead to only small differences in the Atterberg Limits. In other cases, however, the omission of these steps may lead to under-estimation of the Atterberg Limits, as well as under-estimation of the clay fraction (see the section below titled "INFLUENCE OF PREPARATION PROCEDURES".
Jacobsz and Day (2008) raised concerns about the reliability of results from commercial laboratories, and noted at least one laboratory estimating Linear Shrinkage by dividing the PI by two. If shortcuts are being taken in the preparation of samples and the execution of tests, then other properties could also be unreliable.
SANS 3001 describes three different methods of preparation - GR1 for wet preparation, GR2 for dry preparation and GR5 for wet preparation at low temperature. GR5 is a recognition that the normal preparation procedures may be unsatisfactory, but its implementation is optional "when it is expected that heating of the fines will significantly alter their properties". No mention is made of who is responsible for the decision to employ this procedure. While one would expect the engineer to take this responsibility, it is common practice for engineers to rely on the laboratory staff to make this decision.
The GR5 procedure is very time-consuming. In the case of high-plasticity clays, the procedure typically requires three days in the oven at 45°, or one week or more out of the oven. While the oven is set at 45° it cannot be used for its normal purposes, and basins of suspended fines take up a large amount of space. This method of preparation would therefore involve higher costs than GR1 or GR2, leading to the following considerations:
1. It is unlikely that the testing technician would be allowed to decide to do such a protracted test.
2. The laboratory manager could incur the displeasure of his client if he presented a bill more expensive than expected.
3. To prove that the procedure was necessary, it would be necessary also to prepare and test samples using method GR1 and demonstrate a significant difference.
4. Few clients are able to assess heat sensitivity and actually specify the procedure.
5. Most clients are very concerned about keeping costs low.
Such considerations suggest that method GR5 will not be performed by the majority of South African commercial laboratories, certainly not for low-cost housing projects.
ATTERBERG LIMITS
Liquid Limit
The LL is determined by TMH1 Method A2, Determination of the Liquid Limit of soils by means of the flow curve method. This method describes the determination of the flow curve by three tests with the Casagrande apparatus.
The following note appears at the end of the method: "It has been found that the Liquid Limit of certain materials is influenced by the mixing time. ... Hence it was considered necessary to stipulate a mixing time, and a period of ten minutes was decided upon."
This key point will be addressed in the section below titled "Testing of samples".
Following the specification of the flow curve method is clause 5.2 (One-point method), in which it is noted that the Liquid Limit may also be determined using only one test. There is the proviso in clause 5.6 which reads: "In the case of dispute the flow curve method shall be the referee method."
Commercial laboratories strive to make their services competitive and affordable to their clients; they therefore almost exclusively opt for the one-point procedure. They also interpret the note concerning the mixing time of ten minutes to mean that this is the total time, from adding the first drop of water to the fines powder until testing in the Casagrande cup.
SANS 3001 details three different tests for Liquid Limit determination - a one-point method (GR10), a two-point method (GR11) and the three-point flow curve method (GR12). There is close similarity to the TMH1 procedures and there is even stronger emphasis on the mixing time limit of ten minutes. It is recommended in the introductions to both GR10 and GR11 that the three-point flow curve should be used where a PI greater than 20 is expected, but it is not specified who makes this decision, nor is it specified as the referee method. Similar considerations to those which make the use of GR5 very unlikely apply to GR12. Most laboratories will probably continue to perform the one-point method in all cases. The most common method of estimating heave is that due to Van der Merwe (1964). This method relies on the PI, which at the time the method was devised was always deduced from the three-point flow curve, and there was no ten-minute time limit.
Plastic Limit and Plasticity Index
TMH1 Method A3 and SANS 3001 GR10 specify similar procedures for determining the PL. Both specify the use of wet material remaining after LL determination and after filling of the shrinkage trough. This makes it likely that for expansive material the PL will be determined at least thirty minutes after saturation. This has important consequences as presented in the sections below titled "RESULTS AND OBSERVATIONS" and "Testing of samples".
Linear Shrinkage
TMH1 Method A4 and SANS 3001 GR10 both specify placing the trough in the oven after filling. GR10 specifies that this should be done immediately after filling (section 6.2.2.1) and it emphasises that there should be no air drying before placing in the oven. This is addressed in the sections below titled "RESULTS AND OBSERVATIONS" and "DISCUSSION AND COMMENTS".
TESTS PERFORMED TO ASSESS THE RELIABILITY AND CONSISTENCY OF SPECIFIED PROCEDURES
Samples were prepared according to TMH1 Methods A1(a) with and without steps 3.4 and 3.5, i.e. with and without boiling, washing, drying and disintegration (corresponding to SANS 3001 GR1 and GR2).The samples were prepared from oven-dried (105°C-110°C) material passing the 0.425 mm sieve. Comparison of commercial results with results of tests performed at both CUT and the soil science department of the Free State University, suggested that steps 3.4 and 3.5 were probably omitted in the commercial procedures. Comparisons with commercial values shown here are from tests on samples where these two steps were omitted unless specifically noted. Tests performed on samples of which the preparation included these two steps usually showed only small differences in Atterberg Limits, but sometimes large differences in clay fraction. A range of soils, mostly from the central Free State, were used. These samples were drawn from one major geotechnical investigation and several smaller investigations in the central Free State and a handful of samples from the Western and Northern Cape and Gauteng. Screening tests on about sixty of the samples showed acceptable agreement with commercial laboratory Atterberg Limits for predominantly sandy soils, while clayey soils gave less good agreement. From approximately 200 available samples, thirty predominantly clay samples covering a wide range of plasticity, location and sampling depth were selected for detailed testing.
Five samples were used for comparison of the one-point and the flow curve methods. In the case of very plastic clays the discrepancy was considerable.
It was suspected that at least part of this difference could be due to time dependence. The flow curve method provides more time for the sample to absorb water than the one-point method does. Tests were therefore performed to monitor this time dependence for a range of 22 clayey soils - 20 from the central Free State, one from the Northern Cape, and one from the Western Cape.
The procedure involved rapidly adding an amount of water commensurate with the commercial value of LL at the start of the test. This ensured that all of the dry fines came into contact with water at the start of the mixing process. In the commercial procedure water is added slowly and, in the case of very plastic material, some of the fines remain dry far into the mixing process. Mixing was performed (with the addition of more water as needed) until the slurry was suitable for testing in the Casagrande apparatus. The time of adding the first water and the times of testing were recorded. Each tester determined the Liquid Limit four, five or six times. The first result was obtained as quickly as possible, the remainder were spaced over about one hour.
In the case of highly plastic material it was noted that water was quickly absorbed by the fines. In transferring material from the mixing bowl to the Casagrande cup for the first test of each series it was not uncommon for the slurry to have stiffened beyond the point where a successful test could be made. It needed considerable practice to achieve a result in less than five minutes.
After Liquid Limit tests the remainder of the paste was used for Linear Shrinkage and Plastic Limit tests.
RESULTS AND OBSERVATIONS
Figure 1 shows results of three-point tests for a firm, grey-olive, residual clay from the central Free State compared to one-point results from a commercial laboratory. The three-point results give an LL of 71 ± 2 and a PI of 42 ± 1 as against the commercial laboratory value of an LL of 50 and a PI of 24.

Table 1 summarises the results for the five clays tested.

Figure 2 shows typical plots of PI against time for four clays from the central Free State. Trend lines and upper and lower envelopes have been added. The trends of the envelopes and the best-fit (logarithmic) curves suggest an initial rapid increase in PI slowing noticeably after about 20 minutes. Rapidly changing PI appears to be accompanied by increased scatter. Results from individual testers suggest that values may not change smoothly with time.
Less plastic clays were found to give generally less time dependence, and also less scatter in results. Results from a non-expansive, low CEC, low suction-potential clay from the Western Cape can be seen in Figure 3.

The small scatter allows the possibility of insight into operator bias. No attempt was made to rigorously assess this factor, but it appears to be too small to account for the observed discrepancies.
For the 22 samples tested the apparent increase in PI above the commercial value by the end of the test was less than 5 in eight cases, between 5 and 10 in nine cases and greater than 10 in five cases.
Plastic Limits were found to correspond quite well with those from commercial laboratories. Saturated material remaining after completion of the LL procedure is used for PL determination; the time involved is probably sufficient to approach a stable moisture condition in most cases. No time dependence was noted.
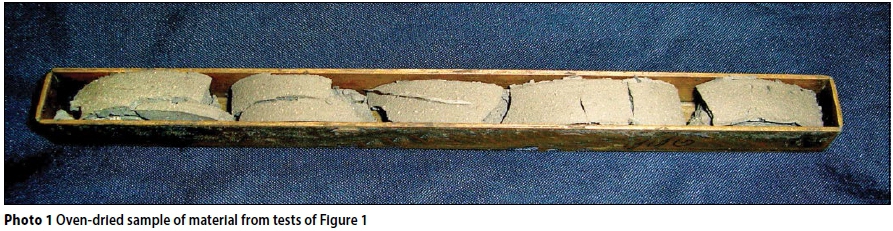
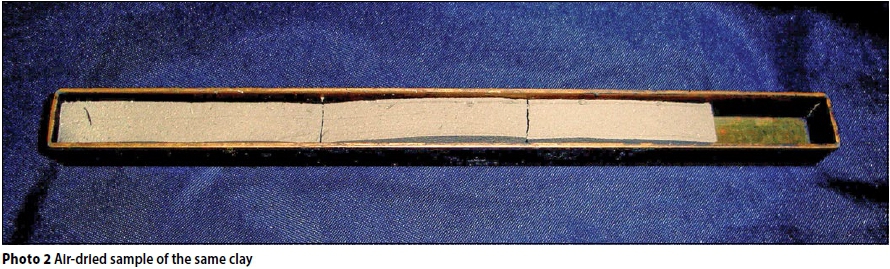
It was found that Linear Shrinkage of highly plastic clays was poorly assessed using the stated procedure of placing the trough in the oven immediately after filling. Plastic clays tend to shatter and arch to such an extent that reconstructing the sample for final measurement is difficult.
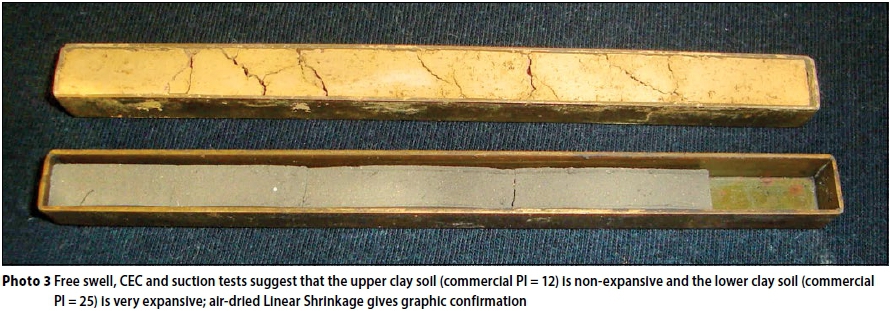
Widely different values were obtained for different specimens of the same clay (see Photos 1, 2 and 3).
When samples were left to air-dry for a period these problems reduced significantly.
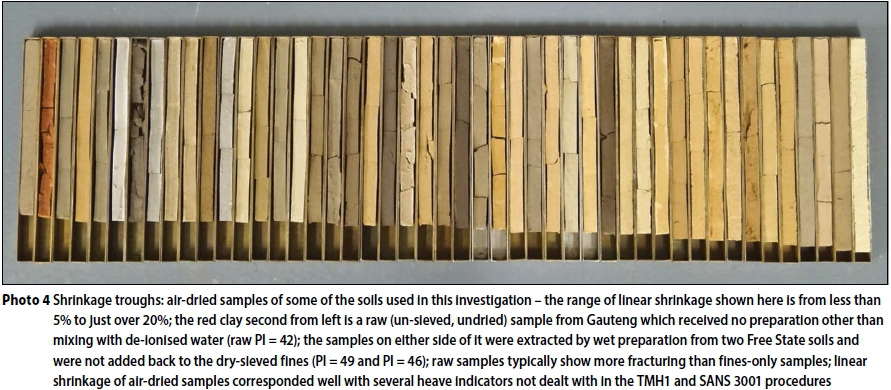
Samples of the same soil left for 24 hours, 48 hours and 76 hours before oven-drying showed that the Linear Shrinkage value and the consistency of results increase with time of air-drying. Samples left to air-dry until shrinkage stopped rarely showed pronounced arching and sometimes reached Linear Shrinkage almost double the value of immediately oven-dried specimens. Air-drying probably models shrinkage in the field far better than oven-drying. Less plastic soils were less seriously affected by immediate oven-drying. While the current LS procedures may be satisfactory for assessing the shrinkage product of wearing course gravels, they are not at all suitable for the foundation indicator tests offered by commercial laboratories (see Photo 4).
INFLUENCE OF PREPARATION PROCEDURES
In many cases, particularly for granular soils, it was found that omitting steps 3.4 (Boiling and Washing) and 3.5 (Drying and disintegration of fines) from the TMH1 A1(a) procedure (equivalent to using SANS 3001 GR2 instead of GR1) made little difference to the Atterberg Limits. In the cases where it did make a difference, the effect on both Atterberg Limits and clay fraction could be very significant. Investigation of these cases usually revealed a fraction of extremely active clays, having very high suction potential and being able to bind fine material to form grains of high strength (tensile strengths greater than 7 MPa were measured in some cases). Grinding of these grains with a rubber-tipped pestle failed to reduce them from gravel to powder in a reasonable time (see Photo 5).

Up to 70% of some soils appeared to be gravel, but with wet preparation much of this material passed the 0.425 mm sieve. One such sample was shown to a commercial laboratory manager.
He assessed it as mudstone gravel not suitable for PI testing. In some cases clay thathad been separated out during wet preparation was found to have very high LL and PI (LL > 80, PI > 40). This may be significant in view of the warning by Rogers et al (2013) that the behaviour of any type of soil may be controlled by swelling clay if it contains more than 5% clay by weight.
It was found that plastic materials which show time dependence after oven-drying at 105°C-110°C showed little time dependence after GR5 preparation. This appears to confirm that the time dependence may be due to removal of water from the structure of the clay during oven-drying. Procedure GR5 may be essential to obtain realistic LL and PI for highly plastic clay when the current ten-minute testing time is used, but allowing adequate time for water re-absorption may make GR5 unnecessary. The possibility that oven-drying may permanently alter properties of some clays is currently being investigated.
DISCUSSION AND COMMENTS
Commercial laboratories need to deliver competitive services. Their clients are oftenunder both time and economic pressures. Commercial procedures must therefore be as simple, quick and economical as possible. This investigation suggests that in many cases - particularly for sandy soils - the procedures currently being used by commercial laboratories may give acceptable results. However, in the case of highlyplastic material they do not. The SANS 3001 procedures, if followed strictly, would possibly give satisfactory results in most cases. Discussions with commercial laboratory personnel suggest that it is unlikely that these procedures will be followed strictly because of time and cost implications and the discretionary nature of some procedures.
Preparation of samples
Certain materials will only give meaningful Atterberg Limits when wet preparation is performed. Wet preparation is time-, space-and energy-consuming, and it appears that it is not commonly performed by commercial laboratories. In some cases omitting wet preparation may have minor consequences for the Atterberg Limits, and it may only be necessary for high-plasticity materials. Its omission can have a significant influence on the clay fraction determination.
Whether samples are prepared accordingto TMH1 A1(a), SANS 3001 GR1 or GR2,the specified one-point LL procedures give poor results for highly plastic clays. The use of GR5 (wet preparation at low temperature) appears to have the potential to solve this problem. The economic consequences of the method are such that it is unlikely that GR5 will be used commercially. However, small changes to the normal testing procedure may render GR5 unnecessary.
Testing of samples
Liquid Limit
Some deficiencies in the tests for Atterberg Limits seem to be specifically dependent on the ten-minute mixing time.
This limit may be linked to the findings of Kleyn et al (2009) pertaining to the assessment of decomposed dolerite gravel for use in road construction. Their paper deals with materials of very low plasticity. An increase in PI from 2 to 7 was observed with extended mixing, which was attributed to breaking down of the gravel and exposure of more of the dolerite's montmorilonite component to water, thus allowing the mineral to exert its swelling potential. The graph of measured PI against mixing time shows great similarity (though in a much lower range) to some of the curves found in this investigation for active clays (see Figure 4).

The mechanism proposed by Kleyn et al is unlikely to explain the time dependence investigated in the CUT tests. Raw, un-sieved wet clay samples which required the addition of little water and little mixing time, gave values of LL and PI much higher than those given by a commercial laboratory which observes the ten-minute mixing time. In the timed tests LL and PI values were usually above the commercial laboratory's values, even when the mixing time was less than five minutes (Figure 2). This investigation suggests that the problem is not that of breaking down soil particles, but of not allowing sufficient time for reintegration of water into the structure of the dried clay before performing the test.
The similarity of the Kleyn et al (2009) curve to some of those in this investigation suggests that the change in PI of their samples could be at least partly due to the montmorilonite fraction being given time to absorb water, and that such material might be less suitable for road construction without treatment than the ten-minute test suggests. Even if Klein et al are correct that longer mixing breaks some of the particles, tests at CUT have found decomposed dolerite to be porous. The montmorilonite fraction will therefore eventually gain access to water and swell, even if the particles remain unbroken.
Plastic Limit
The PI is the difference between the LL and the PL. The PL is determined using material left over from the LL test after the filling of the shrinkage trough. The procedure makes it almost certain that the sample will have been fully saturated for a considerable time before the PL is determined. This investigation found acceptable agreement with commercial laboratory PL values, whether LL-time-dependence was present or not. As a consequence the differences in numerical values of PI and LL are comparable, but the percentage differences are far greater. For the clay mentioned in the sectiontitled "REASONS FOR THE CURRENT INVESTIGATION" above, the commerciallaboratory values were LL 50, PL 25 and PI 25, whereas the values for the undriedsample were LL 67, PL 24 and PI 43. ThePL differs by only 1, the LL differs by 17 (i.e. 34% above the commercial lab value)and the PI differs by 18 (i.e. 72% above thecommercial lab value). As the PI is the most commonly used indicator of potential heave, this discrepancy is very significant.
Proposed amendment to Liquid Limit procedure
A simple amendment to the procedure which meets the ten-minute mixing requirement of TMH1 and SANS 3001 is proposed to address this problem. It is suggested that this could be used until an alternative can be standardised.
It is very easy for an experienced tester to recognise a sample which will have a high LL - it is usually obvious with the first addition of water to the oven-dry fines. While not all soils with high LL show time dependence, all of the clayey soils which this investigation found to be markedly time-dependent do have a high LL. It is proposed that, as soon as a tester suspects a high LL, sufficient water to bring the sample close to the LL should be added in the first five minutes of mixing. The sample should then be covered and set aside for at least 30 minutes (allowing the testing of another sample), after which time the mixing procedure should be resumed for a further five minutes and the remainder of the test continued as normal. Section 6.1.10 of SANS 3001 GR10 should be ignored. The 30-minute waiting period is unlikely to bring the sample to final equilibrium, but it should bring the PI close to the value given by the procedures in use when common heave prediction methods were devised. The economic implications of this proposal would be small, as probably only a small percentage of samples would need this treatment, which in itself is minor. It is far more likely to be embraced by commercial laboratories than the application of SANS 3001 GR5. Simple procedures for identifying soils which need special treatment, and inexpensive procedures for dealing with them reliably and effectively, are being sought. It is hoped that they can be incorporated in an economically viablerevision to SANS 3001.
Linear Shrinkage
Soils containing highly expansive clays contract so much under oven-drying conditions that they often bend, shatter and produce very unreliable results in the Linear Shrinkage trough. A trough without a base is specified for the case of materials expected to have PI greater than 20. This type of trough reduces bending and shattering and may give better results for highly plastic soils. But even where such a trough is used, placing a freshly prepared sample of highly plastic clay in the oven at 105° will result in a poor indication of shrinkage potential.
To be of value for the assessment of clays the trough should not be put into the oven until the shrinkage limit has been almost reached. With this procedure the LS gives a consistent, useful indication of shrinkage from Liquid Limit to Shrinkage Limit, which probably models field conditions reasonably well. Linear Shrinkage appears to have potentially more value for heave prediction than is currently being utilised. Paige-Green and Ventura (1999) reported that the Linear Shrinkage test can give valuable insights for low-plasticity road-building materials. Cerato and Lutenegger (2006) demonstrated that it can give a good estimate of the Shrinkage Limit. Investigations at CUT suggest that it can indicate cases where current methods fail to show true heave potential, and give confirmation when they do.
COMPARISONS WITH STANDARDS FROM ELSEWHERE AND PREVIOUS SOUTH AFRICAN FINDINGS
The New York State Department of Transportation's specification for liquid limit determination (Geotechnical Engineering Bureau 2007) recommends that, where possible, clays should be tested in their natural, undried state (Section 4, Preparation of test samples). Where this is not possible, Note 1 in Section 6.2 states: "Allow ample time for mixing and curing since variation can cause erroneous test results. Some soils are slow to absorb water. Therefore it is possible to add the increments of water so fast that a false liquid limit value is obtained. This is particularly true when the liquid limit of clay soil is obtained from one determination as in the one-point method."
While this note recognises the effect of time-dependence, it does not point out that it is precisely the most problematic clays which are at issue. There is also no warning that the "false liquid limits" are always underestimates, and that they may be very severe underestimates. There is no guidance on how much time might be "ample time", but there certainly is a clear warning about the inadequacy of the one-point method for clays. Rather than suggesting that extended mixing time affects the result by breaking down soil particles, the suggestion is that the time required for absorbing water into the clay is the important factor.
Professor J E Jennings, one of South Africa's most notable soils experts, habitually advised his students to allow "ample time" for mixing and curing - also without specifying just how much time is "ample".
Indian Standard (IS 2720, Part 5,Reaffirmed 1995) (IS 1985) does give specific guidance. Clause 3.4.1 states: "In the case of clayey soils, the soil paste shall be left to stand for a sufficient time (24 hours) so as to ensure uniform distribution of moisture throughout the soil mass."
Again this suggests that the time for which the sample is left in contact with water is important, rather than that mixing may break down soil particles. While this specification recognises the possibility of time-dependence and may be a safe way to proceed, it may not be popular with commercial laboratories. Storage of slurried samples for 24 hours needs additional containers, labelling, record-keeping and storage space. The temptation towards shortcuts might be appreciable.
South African standards frequently follow British standards quite closely. BS 1377: Part 2 1990 specifies, in Note 3 of Clause 4.3, a 24-hour period between mixing the soil with water and carrying out the Liquid Limit test.
Blight et al (2012) noted that it is wellknown that drying (even air-drying) of some soils affects their properties and can lead to underestimation of LL and PI. They recommend that Atterberg Limits should therefore be determined without any drying wherever practicable. This requires testing soil in a state as close as possible to its natural condition, with only minimal processing for removal of large particles. They point out that extended mixing (of soil in its natural condition) can lead to increased LL and PI because of breaking down of cemented bonds between clay clusters. This is a well-known feature of tropical and volcanic soils.
The CUT tests found that, where clay samples can be tested in the raw state (with only removal of large particles where necessary), PI for the whole sample could be considerably greater than that for the fines alone as determined using the TMH1 A2 or SANS 3001 GR10 procedures. Current practice reduces the PI for the whole sample by factoring with the percentage of fines.
SOME THEORETICAL CONSIDERATIONS
Non-expansive clays, typically kaolinite, consist of alternating silicon-based tet-rahedral sheets and aluminium-based octahedral sheets. They form a structure in which hydrogen bonds hold the pairs of sheets in stacks of the order of 1 000 layers thick. When a soil containing such clay absorbs moisture, the water fills the spaces between the individual soil particles, but does not penetrate between the individual sheets of the clay structure itself. The clay does expand somewhat (despite being called "non-expansive") since water, when available, is drawn into the sample by capillary action. This capillary suction is, however, not usually strong enough to cause expansion against the pressure under the foundation of a building.
Expansive clays (e.g. smectites), on the other hand, consist of silicon-based tetrahedral sheets and aluminium-based octahedral sheets which have suffered so much corruption to the ideal structure (e.g. by substitution of aluminium3+ for silicon4+ in the tetrahedral sheets, and magnesium2+ for aluminium3+ in the octahedral sheets) that the pattern of hydrogen bonds is disrupted and layers become attached largely by electrostatic forces. The number of layers in the stacks of these sheets may be very small, giving a thin, plate-like structure to the clay particles.
When such clay is allowed to take in moisture, not only the pores between individual grains are filled, but water is drawn in between the individual layers, which move apart to admit water-borne cations attracted by the unbalanced electrostatic forces on the sheets. The spacing of layers is of molecular dimensions. The suction is extremely high, so the expansion can take place against a considerable pressure, but the spacing is so small that an appreciable amount of time may be needed for water to be drawn in.
Such considerations lead to the question of how long it takes for water to be drawn into the structure of expansive clays, and whether the procedures of TMH1 and SANS 3001 allow sufficient time for this hydration to take place.
CONCLUSIONS
The TMH1 methods have long been standard in commercial laboratories throughout South Africa. The way these methods are currently being applied is convenient and economical, but unsatisfactory for assessing clays under foundations of light structures.
The introduction of SANS 3001 to replace the TMH methods might address shortcomings in this regard if all of its procedures were strictly employed. The discretionary nature of critical procedures and their cost implications, however, make their employment unlikely.
Introduction of procedures to address the cases where the TMH methods are not satisfactory is suggested as an alternative, at least for the "foundation indicator" tests. It appears that relatively small modifications to the current methods may be sufficient to provide more reliable values for these indicators for active clays. These small changes would have relatively minor economic implications and would be more attractive to commercial laboratories and their clients than SANS 3001 in its current form.
Subsidy-housing is currently allocated approximately R104 per house for geotechnical investigation. The cost of heave damage at one 500-unit housing project visited by the CUT Soil Mechanics Research Group in 2013 was more than R14 000 000. A realistic allocation of funds for geotechnical investigations is required if the investigations are to be carried out by engineers or engineering geologists with sufficient skill and experience to make proper assessment of the tests to be performed and the procedures to be followed, and then to draw valid conclusions from the results.
REFERENCES
Blight, G E 2012. Microstructure, mineralogy and classification of residual soils. In: Blight, G E & Leong, E C (Eds), Mechanics of Residual Soils. Boca Raton, FL, US: CRC Press, pp 50-54. [ Links ]
Cerato, A B & Lutenegger, A J 2006. Shrinkage of clays. Proceedings, 4th International Conference on Unsaturated Soils, Carefree, AZ, US (Geo-Institute of ASCE), pp 1097-1108. [ Links ]
CSIR (Council for Scientific and Industrial Research) 1986. Standard Methods of Testing Road Construction Materials, Technical Methods for Highways, TMH1, Pretoria: CSIR. [ Links ]
Geotechnica l Engineering Bureau 2007. Geotechnical Test Method GTM7, Revision No 1. New York: New York State Department of Transportation. [ Links ]
IS (Indian Standard) 1985. IS 2720 Determination of Liquid and Plastic Limits, Part 5, Reaffirmed 1995. New Delhi: Bureau of Indian Standards. [ Links ]
Jacobsz, S W & Day, P 2008. Are we getting what we pay for from geotechnical laboratories? Civil Engineering, 16(4): 8-11. [ Links ]
Kleyn, E, Bergh, A & Botha, P 2009. Practical implications of the relation between the clay mineral content and the Plasticity Index of dolerite road construction material. Journal of the South African Institution of Civil Engineering, 51(1): 2-5. [ Links ]
Paige-Green, P & Ventura, D 1999. The bar linear shrinkage test - More useful than we think! Proceedings, 12th Regional Conference for Africa on Soil Mechanics and Geotechnical Engineering, Durban, pp 379-387. [ Links ]
Rogers, J D, Olshansky, R & Rogers, R B 2013. Damage to foundations from expansive soil. Missouri University of Science and Technology. Available at: http://www.web.mst.edu [accessed on 4 October2013]. [ Links ]
Sampson, L R & Netterberg, F 1984. A cone penetration method for measuring the liquid limits of South African soils. Proceedings, 8th Regional Conference for Africa on Soil Mechanics and Foundation Engineering, Harare, Vol 1, pp 105-114. [ Links ]
SANS (South African National Standards) 2011. SANS 3001: Civil Engineering Test Methods. Parts GR1, GR2, GR3, GR5, GR10, GR11, GR12. Pretoria: South African Bureau of Standards. [ Links ]
Savage, P F 2007. Evaluation of possible swelling potential of soil. Proceedings, 26th South African Transport Conference (SATC 2007), Pretoria, 9-12 July. [ Links ]
Van der Merwe, D H 1964. The prediction of heave from the Plasticity Index and the percentage clay fraction. The Civil Engineer in South Africa, 6(6): 103-107. [ Links ]
 Correspondence:
Philip Stott
Department of Civil Engineering
Central University of Technology
Private Bag X20539
Bloemfontein 9300
South Africa
T: +27 (0)82 253 4001
E: philip@Y10.co.za
Dr Elizabeth Theron
Department of Civil Engineering
Central University of Technology
Private Bag X20539
Bloemfontein 9300
South Africa
T: +27 (0)51 507 3646
E: etheron@cut.ac.za

PHILIP STOTT (Pr Eng, MSAICE) received BSc (Hons) and MSc degrees from Manchester University. He lectured at Ahmadu Bello University in Nigeria, and at the University of the Witwatersrand in Johannesburg, and has been a consulting engineer since 1984. He received the Henry Adams Award from the Institute of Structural Engineers, London. He is currently a consulting engineer, a DTech candidate, a member of the Soil Mechanics Research Group at the Central University of Technology (CUT), Bloemfontein, and a member of the Structural and Geotechnical Divisions of SAICE.

DR ELIZABETH THERON (Pr Tech Eng) received an NHDip and MTech in Civil Engineering from the then Technikon Free State, South Africa (renamed since to the Central University of Technology, or CUT for short). She also has a PhD in Geography from the University of the Free State, Bloemfontein. She has lectured in Civil Engineering at the forerunner of the CUT since 1987, and has received the Prestige Award of the Vice-Chancellor (Academic: Class Gold). She is currently a senior lecturer at the CUT, and project manager of, and researcher in, CUT's Soil Mechanics Research Group.

