


Serviços Personalizados
Artigo
 Inglês (pdf)
 Artigo em XML
 Referências do artigo
Indicadores

Links relacionados
-
 Citado por Google
 -
 Similares em Google
Compartilhar

 Permalink
Journal of the South African Institution of Civil Engineering
versão On-line ISSN 2309-8775
versão impressa ISSN 1021-2019
J. S. Afr. Inst. Civ. Eng. vol.57 no.2 Midrand Abr./Jun. 2015
http://dx.doi.org/10.17159/2309-8775/2015/v57n2a2
TECHNICAL PAPER
Development of a saturation and stress-dependent chord modulus model for unbound granular material
E van Aswegen; W J vd M Steyn; H L Theyse
ABSTRACT
Unbound granular material is used in the pavement structure and usually comprises the bulk of the structural and foundation layers of a typical South African pavement. The term unbound granular material refers to the classification of natural material, which has not been modified in any way. Unbound granular material is classified from a G1 to G10 quality according to its fundamental behaviour and strength characteristics.
Young's modulus and Poisson's ratio are theoretical concepts of linear elasticity that can at best approximate experimental results of actual material elastic response. In their basic linear elastic form, Young's modulus and Poisson's ratio are rather poor approximations of actual unbound granular material behaviour. The non-linear, stress-dependent behaviour of unbound granular material can, however, be simulated using the linear elastic model as a basis, but with a proper constitutive material model that adheres to the observed material behaviour.
The objective of this paper is to utilise a chord modulus model and calibrate it for a range of unbound granular material classifications. The model was calibrated for five bulk material samples, ranging from G2 to G8. The calibration process included linking variables of the model to mathematical functions that approximate the trends observed when variables were considered against degree of saturation. A parametric analysis indicated that the saturation-and stress-dependent chord modulus model realistically predict material behaviour. The trends depict the stress-dependent behaviour of unbound granular material, where an increase in initial modulus is observed for increasing confinement pressure, as well as initial stress softening with increasing stress ratio followed by stress stiffening.
It can be concluded from the results presented in this paper that a saturation- and stress-dependent chord modulus model could be refined and calibrated for crushed and natural unbound granular material. This refinement did not negatively influence the accuracy or ability to realistically predict the material behaviour. The preliminary conclusions reported in this paper indicate that the chord model formulation yield satisfactory predictions, especially when the model is calibrated for each individual material type.
Keywords: resilient behaviour, model, unbound granular material, degree of saturation
INTRODUCTION
Unbound granular material is used in the pavement structure and usually comprises the bulk of the structural and foundation layers of a typical South African pavement. The term unbound granular material refers to the classification of natural material, which has not been modified in any way. Unbound granular material is classified from a G1 to G10 quality according to its fundamental behaviour and strength characteristics (DoT 1996; DoT 1985; Theyse et al 1996).
A G1 quality material is defined as a graded crushed stone, usually obtained from crushing solid un-weathered quarried or mined rock or boulders. G2 and G3 quality material are obtained by the same process as a G1 quality material, but may contain natural fines not derived from crushing the parent rock. Medium quality materials (G4, G5 and G6) are defined by the TRH 14 (DoT 1985) as natural gravel or a mixture of natural gravel and boulders which may require crushing. Any of these materials may be modified using cement, lime, bitumen or polymers to enhance certain strength characteristics of the material. Lower quality materials (G7, G8, G9 and G10) are defined as gravel-soil in TRH 14 (DoT 1985).
In this paper the term crushed stone or crushed aggregate will be used to refer to G1 to G3 quality material and natural material will refer to G4 to G10 quality material. Unbound granular material will refer to both crushed stone and natural material (i.e. G1 to G10).
Pavement structural layers (wearing course, base and sub-base) are generally subjected to higher traffic-induced shear stresses than the pavement foundation layers, and also larger plastic strains. When the wearing course is compromised, it leads to strength and bearing capacity deterioration of the structural pavement layers as moisture ingress takes place.
The type and volume of traffic the pavement structure must carry during its design life dictate which material behaviour and strengths are required. The accurate modelling of the response of pavement layers is therefore of utmost importance when engineers design a pavement structure.
BACKGROUND
Often pavement response models are based on the integral transformation solution of a Multi-Layer Linear Elastic (MLLE) system. However, with increasing computing capacity, Finite-Element (FE) analysis may become a viable analysis tool for routine pavement design in the near future. Even though FE analysis allows for the introduction of material non-linearity in terms of plasticity, some information on the resilient response characteristics of pavement materials is still required (Theyse 2012). Given that both the MLLE and FE solutions are based on continuum mechanics, Hooke's law in terms of either an isotropic or anisotropic formulation governs the elastic material response, with the elastic properties of the material expressed by a pair of constants such as Young's modulus and Poisson's ratio, bulk and shear moduli or Lame's constants (Brown & Pappin 1981; Uzan 1985; Lekarp et al 2000). Theyse (2012) focused on Young's modulus and Poisson's ratio, since these elastic constants are more familiar to most pavement engineers.
Young's modulus and Poisson's ratio are theoretical concepts of linear elasticity that can at best approximate experimental results of actual material elastic response. In their basic linear elastic form, Young's modulus and Poisson's ratio are rather poor approximations of actual material behaviour, as the behaviour of unbound granular material is:
■ Stress-dependent, i.e. the stiffness or modulus of the material depends on the level of confinement of the material and the shear stress imposed on the material;
■ Non-linear, i.e. there is not a linear relationship between the imposed stress and strain response of the material; and
■ Inelastic (plastic), i.e. the material does not completely return to its original un-deformed shape when the imposed stress is removed (Theyse 2012) (see Figure 1).
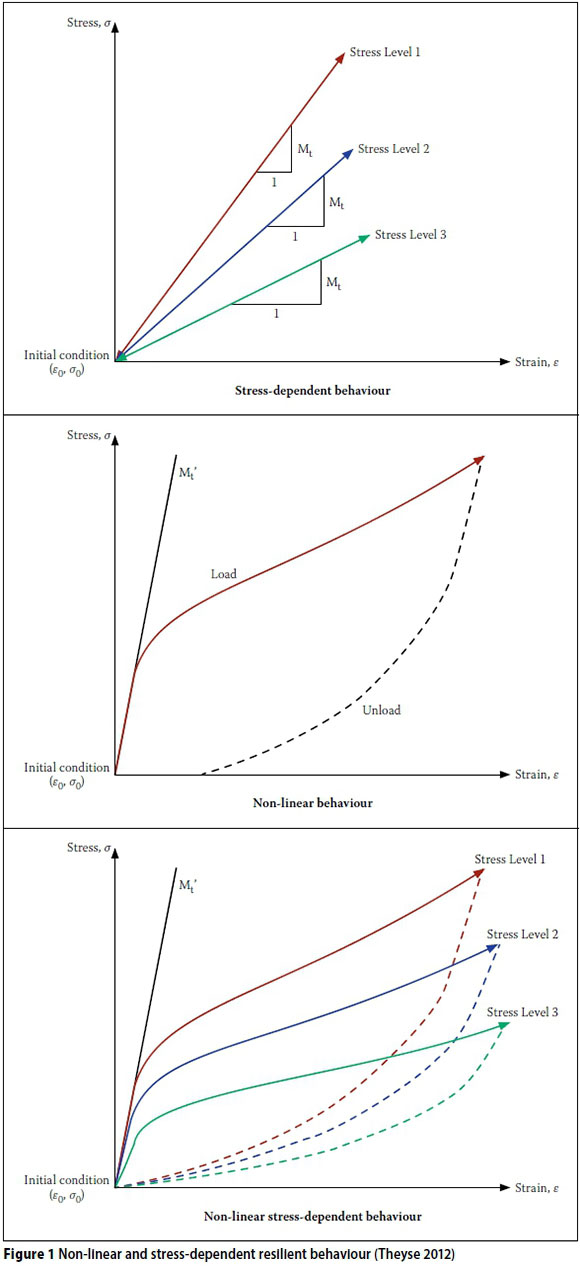
The non-linear, stress-dependent behaviour of unbound granular material can, however, be simulated using the linear elastic model as a basis, but with a proper constitutive material model that adheres to the observed material behaviour (Theyse 2012).
MODEL DEVELOPMENT
Theyse (2008) reiterates that the departure point for any model formulation should be a detailed study of the data, and specifically patterns in the data. The characteristics observed were used to formulate a model from resilient tri-axial test data, using the test protocol described by Anochie-Boateng et al (2009). This protocol is a resilient modulus-, chord modulus- and tangent modulus model based on Hooke's law, calibrated using base layer material from road N2-33 (near Piet Retief) and the crushed stone base layer of road N4 west of Pretoria. These models are each formulated as a function of stress ratio, and confinement pressure or minor principal stress is considered in the model coefficients.
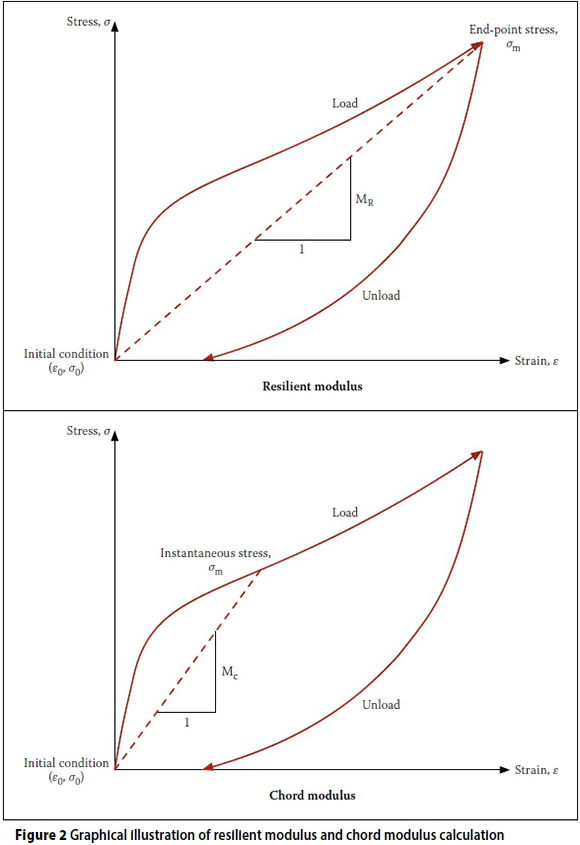
Theyse (2012) explained that the formulation of a chord modulus was considered better, in terms of data analysis, than the formulation of a resilient modulus model, the latter being the most commonly used theory to model resilient behaviour. When the resilient modulus is calculated, only the end point of the stress-strain hysteresis loop is considered, discarding the majority of the information contained in the rest of the loop. The chord modulus represents the instantaneous stiffness of the material at any point on the stress-strain hysteresis loop (Theyse 2012). This is illustrated in Figure 2.
Theyse (2012) listed the following benefits when using the chord modulus approach, compared to the resilient modulus approach:
■ The full hysteresis loop provides a comprehensive trace of the material stiffness or modulus over a wide stress ratio range, facilitating model formulation and calibration.
■ The chord modulus shows consistent material behaviour at all levels of confinement pressure when using the test protocol described by Anochie-Boateng et al (2009).
■ The number of stress levels at which the tri-axial test is done can be reduced by 75% in terms of the current test protocol (Anochie-Boateng et al 2009).
■ In terms of application of the chord modulus in modelling the response of a pavement layer or tri-axial specimen, the chord modulus describes the evolution of the stiffness or modulus of the material from an initial condition at rest through the full stress-strain cycle including the load and unload phases.
VERIFICATION OF RESILIENT RESPONSE MODEL
Routine test results
The aim was to sample a sufficient variety of material types, specifically including moisture-sensitive materials. Table 1 summarises the average of three repeat tests per bulk material sampled on selected tests. The results appear reasonable and within the expected limits as described in COLTO (1998) for each class of material.
Resilient modulus tri-axial results
Van Aswegen and Steyn (2013) reported on processing and modelling, which were applied on the N4 Extension and N2-33 base layer material that was used to refine the process for application on the test results from material reported on in this paper. The same processing and modelling was followed as described by Van Aswegen and Steyn (2013).
Calibration of chord modulus model variables
Formulation of the chord modulus model
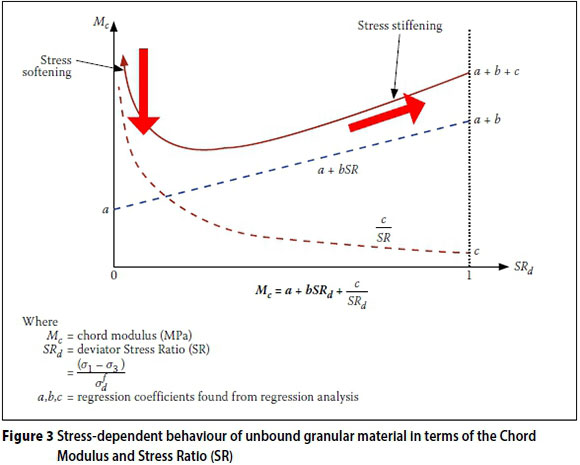
The chord modulus model consists of a hyperbolic function in combination with a linear function, where the linear function has a nonzero intercept (Figure 3), when the behaviour is described in terms of increasing stress ratio.
Considering the formulation of the chord modulus model, it is apparent that none of the variables a, b or c can be allowed to be negative values. Negative variable values would result in the following:
1. A negative a value will force c to be a negative value.
2. A negative c value results in the hyperbolic portion of the model switching and having a negative asymptote, which will result in negative predicted stiffness, or modulus values that are counter-intuitive.
3. Although the line formed by a and b is allowed to have a negative slope, a negative b value is not allowed, as it might force c to be negative when a is not large enough, resulting in negative predicted stiffness or modulus values.
As illustrated by Figure 3, the model successfully predicts the stress dependency of material with regard to stiffness or modulus, where the initial modulus value increases with increasing confinement pressure, as well as the initial stress softening with increasing stress ratio, followed by stress stiffening.
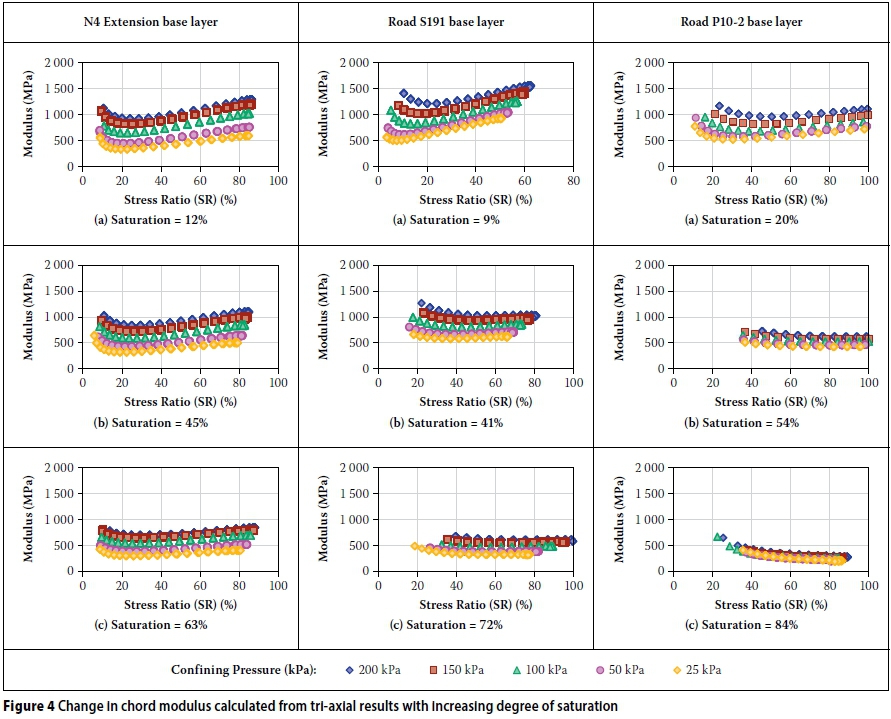
From literature it is evident that moisture has a significant influence on the stiffness or modulus and shear strength of unbound granular material (e.g. Hicks & Monismith 1971; Seed et al 1962; Thom & Brown 1987; Lekarp et al 2000). Therefore the chord modulus model formulation had to be extended to include the effect of moisture content or degree of saturation (S) on the stiffness or modulus of the material. Figure 4 illustrates three different material responses to the increasing effect of degree of saturation (from top to bottom in each of the three columns).
The following observations can be made regarding the behaviour depicted in Figure 4:
■ There is a general reduction in the magnitude of the chord modulus with increasing degree of saturation for the materials depicted.
■ Stress-stiffening behaviour with increasing confinement pressure, but also with increasing stress ratio above 20%, is observed for the N4 Extension base layer material (crushed norite) at all degrees of saturation.
■ Road S191 base layer material (crushed dolerite) indicated stress-stiffening behaviour with increasing confinement pressure at three degrees of saturation, but the effect of increasing confinement pressure reduced with increasing degree of saturation. Stress stiffening occurred with increasing stress ratio at low and intermediate degrees of saturation, but not at the highest degree of saturation where the chord modulus remained almost constant with increasing stress ratio.
■ Stress-stiffening behaviour with increasing confinement pressure at three degrees of saturation was observed for Road P10-2 base layer material (weathered shale). However, the effect of increasing confinement pressure became negligible at the highest degree of saturation. Stress stiffening occurred with increasing stress ratio only at the low degree of saturation. The chord modulus showed stress softening with increasing stress ratio at the intermediate and high degrees of saturation, with the chord modulus reducing consistently with increasing stress ratio.
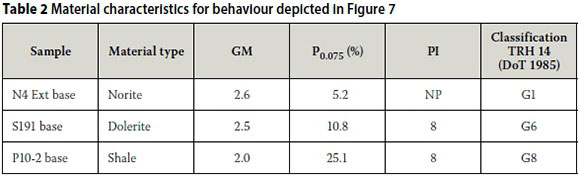
These observations appear sensible when the material characteristics are considered, as given in Table 2, with Road P10-2 base layer material (weathered shale) having been classified as a weaker, lower quality material compared with the N4 Extension base layer material (crushed norite).
Selection of mathematical functions approximating variables
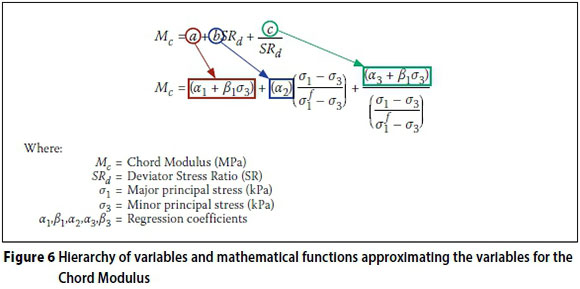
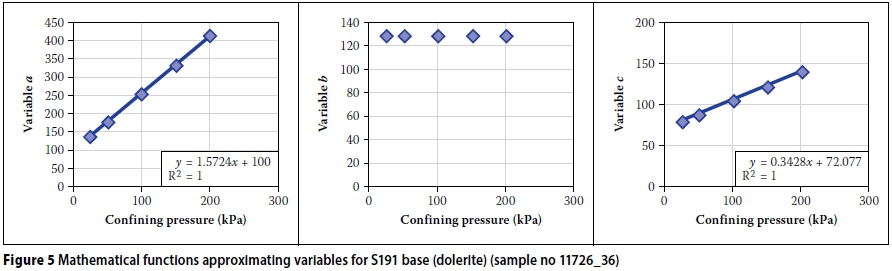
After the processing of the test data had been completed, the data was copied to a template where the chord modulus values a, b and c were calibrated for each specimen tested for each of the bulk sampled materials, i.e. eighteen specimens per bulk sample. Calibration of the model was done in Microsoft Office Excel 2013, using the solver function after identifying a mathematical function that best fitted the data. Various combinations of mathematical functions were tested, expressed as accuracy of the complete model using Root Mean Square Error (RMSE), with RMSE an estimate of the standard deviation of the random component in the data, before a function was assigned to a variable (Draper & Smith 1998; Everitt 2002). Variables a and c are approximated by a linear equation fitted to data for all the specimens. However, the constants of the linear approximation may differ from sample to sample. The same method was followed for variable b, which is approximated by a constant value that may differ from sample to sample (Figure 5).
Figure 6 illustrates how the mathematical functions are linked to the chord modulus model variables.
Identification of sub-variable relationships within variables
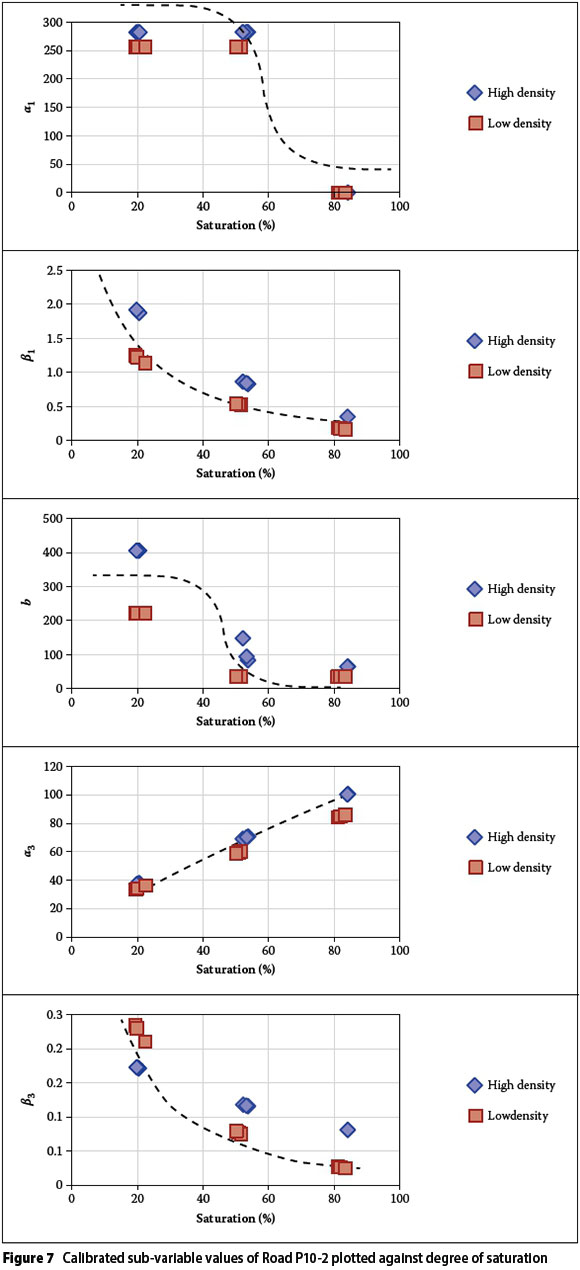
After the calibration process for variables a, b and c, the sub-variables (α1, βν(α2, (β2= 0) α 3and β3 were evaluated against saturation, distinguishing between 'high volumetric density (HD)' and 'low volumetric density (LD)' samples. Figure 7 depicts the associated data for Road P10-2 (weathered shale). The limitation that none of the variables is allowed to be a negative value was kept in mind during the identification of mathematical equations describing the observed trends.
The following mathematical equations were linked to the observed trends:
■ Sub-variable α1
The sub-variable appears to reach a plateau for degree of saturation below 40% and then rapidly decreases to a lower level plateau at degree of saturation above 60% saturation. Theyse (2009) reported that the stiffness or modulus of partially saturated unbound granular material reaches a ceiling value below a certain threshold value of saturation. Theyse (2009) used a sigmoidal curve, which was also identified to predict the trend of sub-variable αν
■ Sub-variable β1
A logarithmic curve was selected as it best predicts the trend in data.
■ Variable b or sub-variable α2
The sub-variable appears to reach a plateau for degree of saturation below 40% and then rapidly decreases to a lower level plateau at a degree of saturation above 60%. Therefore a sigmoidal curve was selected to predict the trend in the data.
■ Sub-variable α3
No obvious trend could be identified for α3 and linear, exponential and power curves were evaluated. The accuracy of the complete model using RMSE was used to evaluate which trend to link to α3. A linear curve was selected to predict α3 values, as in combination with β3 it yielded acceptable accuracy for the complete model.
■ Sub-variable β3
No obvious trend could be identified for β3, and linear, exponential, logarithmic and power curves were evaluated. The accuracy of the complete model using RMSE was used to evaluate which trend to link to β3. An exponential curve was selected to predict β3 values, as in combination with α3 it yielded acceptable accuracy for the complete model.
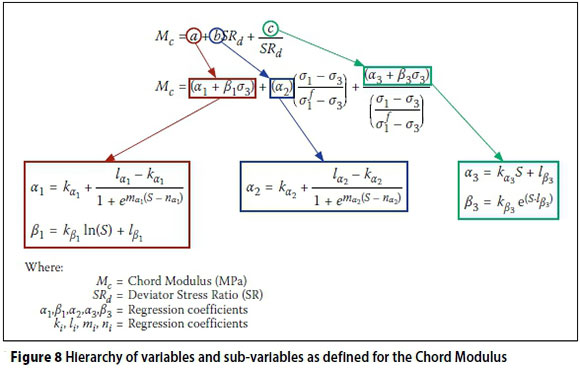
Based on the aforementioned evaluations, mathematical relationships in terms of saturation were used to describe each sub-variable, which in turn is used to describe variables a, b and c, as depicted in Figure 8. This combination results in a saturation- and stress-dependent chord modulus model formulation.
Model calibration per bulk material sample
The saturation- and stress-dependent chord modulus model was calibrated using the model formulation depicted in Figure 8 for all the material samples listed in Table 1.
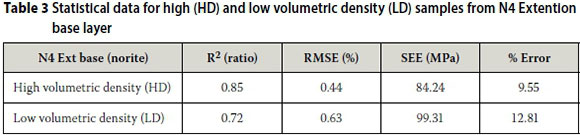
N4 Extension base layer (crushed norite)
The model appears to have good prediction accuracy for the material from N4 Extension base layer on material and individual test result level. This is indicated by the statistical parameters listed in Table 3 for the high (HD) and low volumetric density (LD) samples.
Two high volumetric density test results appear to have slightly lower prediction accuracy than the rest of the high volumetric density samples (Table 4 and Figure 9).
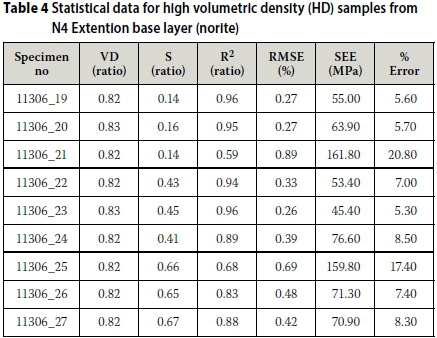
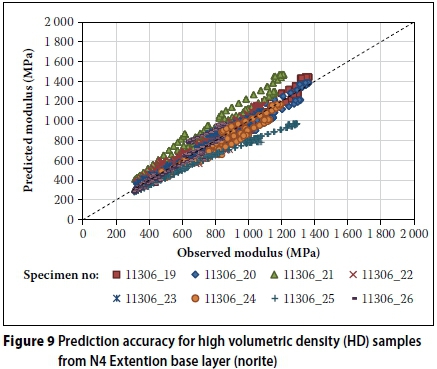
Sample 11306 21 deviate from the perfect fit line, due to slight over-prediction of the resilient response at 200, 50 and 25 kPa confining pressure. The Standard Error of Estimate (SEE), a measure of the accuracy of the predicted values (Draper & Smith 1998; Everitt 2002), for the results from this sample is 162 MPa (R2 = 0.59), while the results for the remaining two repeat samples are 55 MPa (R2 = 0. 96) and 64 MPa (R2 = 0.95) respectively. Sample 11306 25 also slightly deviates from the perfect fit line due to under-estimation of the model for resilient response at 200 kPa confining pressure. The SEE for the results from this sample is 160 MPa (R2 = 0.68), while the results from the remaining two repeat samples are 71 MPa (R2 = 0.88) and 71 MPa (R2 = 0.97) respectively. Since three repeat tests at a specific degree of saturation were conducted, and two of the three samples at the low and high degree of saturation indicate accurate prediction by the model, the individual test results with lower accuracy can be discarded.
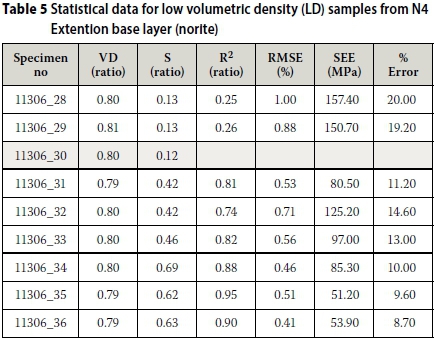
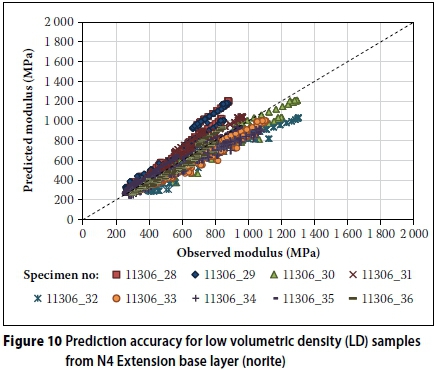
Three results of the low volumetric density samples appear to have lower prediction accuracy than the other samples (Table 5 and Figure 10). The predicted modulus for samples 11306_28, 29, 32 and 33 is slightly lower than the observed modulus. The remaining individual results of the set of three indicate a good fit. These results can be discarded, as the remaining individual results from the set at the specific degree of saturation indicate accurate prediction by the model. The results from sample 11306 30 were discarded due to an error during testing.
Road D804 base layer (weathered calcrete)
The model appears to have relatively good prediction accuracy for the material from Road D804 base layer on material level. This is indicated by the statistical parameters listed in Table 6 for the high (HD) and low volumetric density (LD) samples.
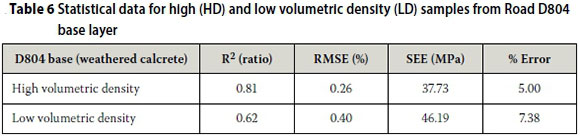
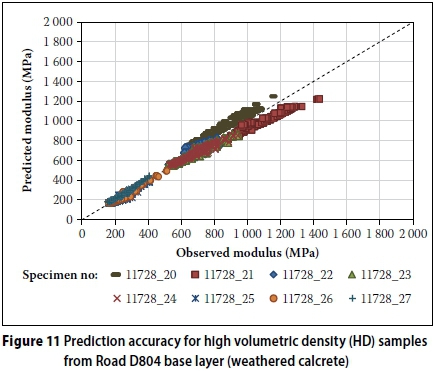
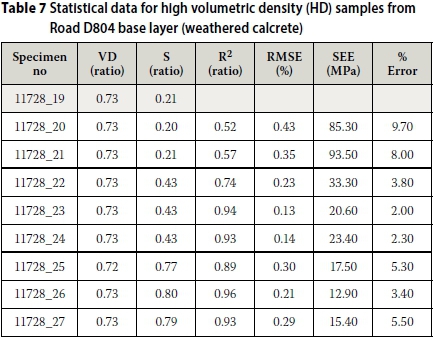
However, some of the individual test results are not modelled accurately by the combined model. Based on SEE only individual test results from two samples (11728_20 and 21) with SEE 85 MPa and 94 MPa can be regarded as poor, as depicted in Figure 11 and Table 7. The SEE for the remaining individual results varies between 15 MPa and 33 MPa with R2 between 0.74 and 0.96, which is acceptable considering that these results are obtained at material level. The result for sample 11728 19 was discarded due to an error during testing.
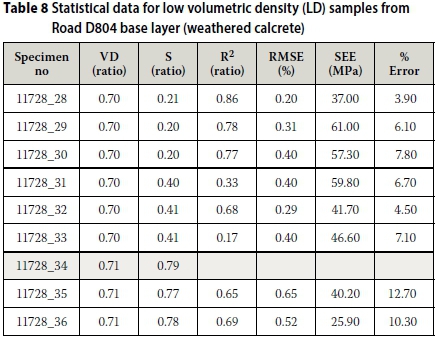
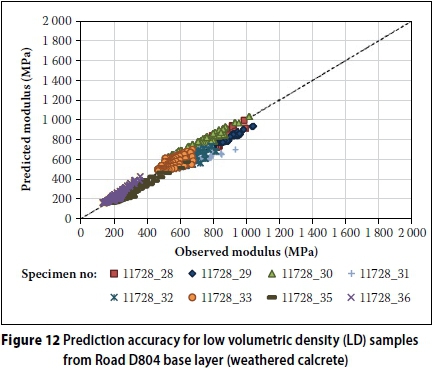
The model appears to have relatively good prediction accuracy for the low volumetric density material from Road D804 base layer on material level (Table 8 and Figure 12). Individual test results for sample 11728 31, 32 and 33 indicate poor prediction accuracy with the SEE 60 MPa, 42 MPa and 47 MPa respectively. R2 is 0.33, 0.68 and 0.17 respectively. The observed trend in modulus results for these samples all appear to lack a stress-stiffening component, and the observed modulus decreases rapidly at all confining pressure levels without reaching a constant modulus at higher degree of saturation. Therefore the model cannot model the behaviour accurately, as it differs from the general trends identified in Figure 4, and can be discarded. The remaining samples yield SEEs of between 26 MPa and 61 MPa, with R2 ranging from 0.65 to 0.86, which is acceptable considering that these results are obtained at material level. The result for sample 11728 34 was discarded due to an error during testing.
Parametric analysis per bulk material sample
The model was further assessed by investigating parametric plots of the model. The high and low volumetric density scenarios were assessed individually. The difference between relatively high and relatively low volumetric densities is between 1% and 3%. The stress dependency of the model reflects the trends observed in the data. In terms of the parametric plot for degree of saturation, the model realistically reflects trends observed in the data as extrapolated from the three degrees of saturation tests conducted in this study.
N4 Extension base layer (crushed norite)
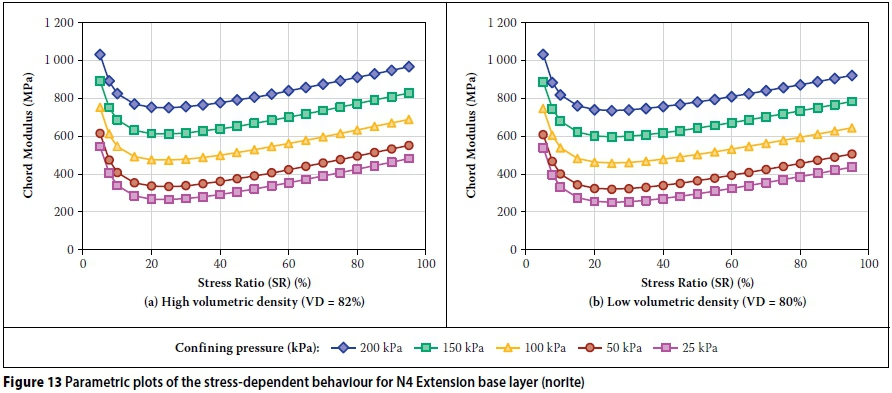
The stress-dependent behaviour of the material is realistically reflected in the parametric plots for both the high and low volumetric density resilient modulus samples tested. At 80% saturation, the predicted modulus does not differ significantly between high and low volumetric densities, as can be observed in Figure 13.
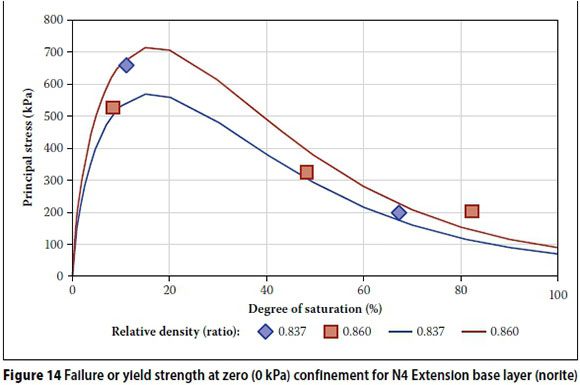
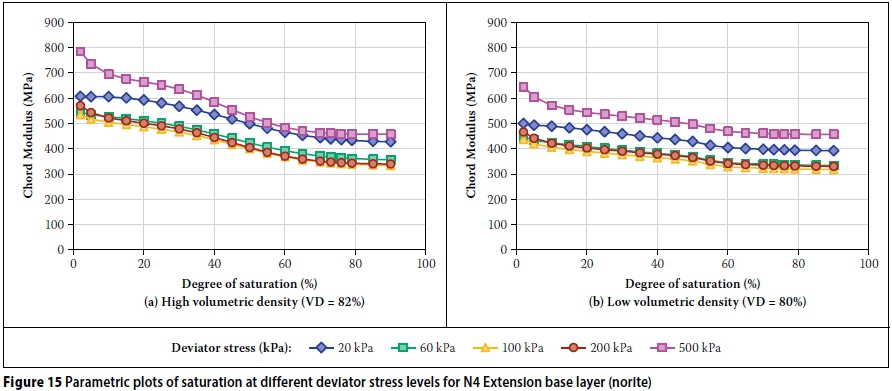
The parametric plots for saturation realistically reflect the decrease of modulus with increasing degree of saturation at 50 kPa confining pressure (Figure 14). The low deviator stress of 20 kPa appears to reflect the influence of suction pressure on the material strength, before the increasing deviator stress overshadows the influence of suction pressure. The failure or yield strength at 0 kPa confinement predicted by using Theyse's suction model (2009), in essence depicts the influence of suction pressure. Figure 5 illustrates the failure or yield strength at 0 kPa, i.e. influence of suction pressure for this material.
D804 base layer (weathered calcrete)
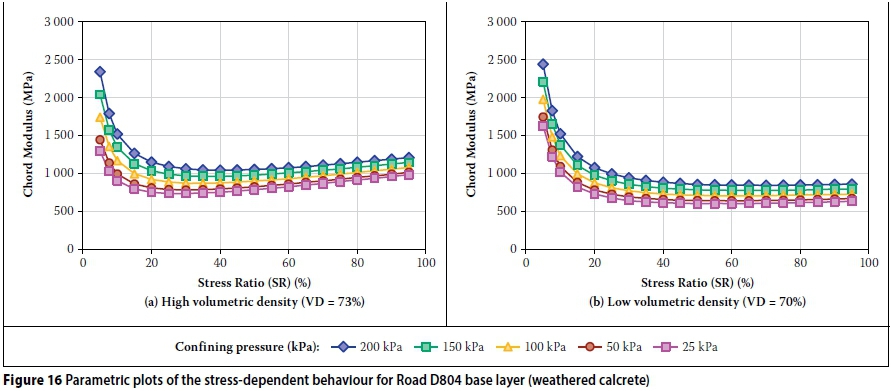
Figure 16 illustrates the stress-dependent model parametric plots for high and low volumetric density at 20% saturation. The parametric plots realistically models the behaviour observed in the data trends. Similar to the modulus behaviour of Road P10-2 base layer material, Road D804 base layer material does not have a distinct stress-stiffening component with increasing stress ratio. Both the aforementioned materials have low Grading Modulus (DoT 1985) values of 1.96 and 1.71 respectively.
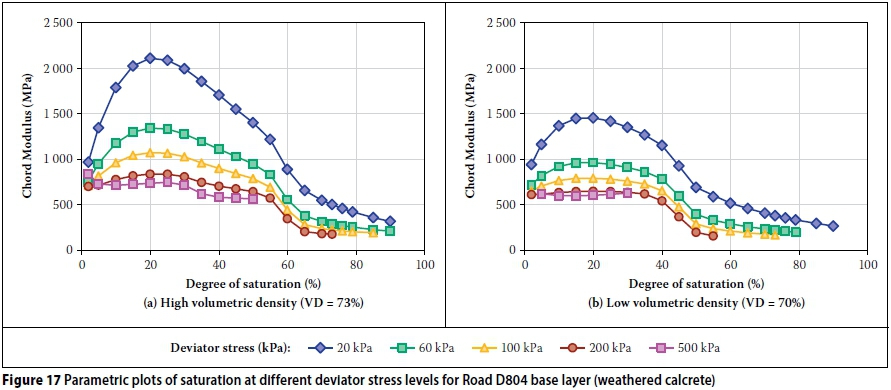
As for N4 Extension upper selected layer material, the influence of high fines content and Plasticity Index (PI) (DoT 1986) can also be seen in the parametric plots for saturation (Figure 17). The influence of suction pressure on the material strength can be seen up to 100 kPa deviator stress at 25 kPa confining pressure. This trend of high predicted modulus values was also observed at 0 kPa confinement where values of between 2 000 kPa and 1 800 kPa were observed.
CALIBRATION OF CHORD MODULUS MODEL VARIABLES FOR CRUSHED AND NATURAL UNBOUND MATERIAL
Distinction between crushed and natural unbound material
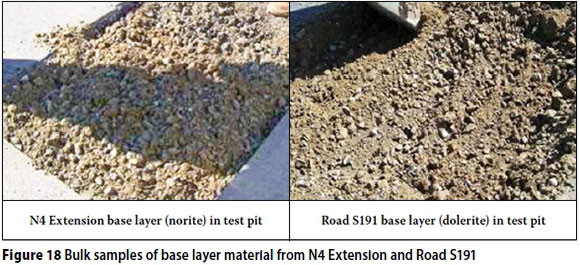
When the bulk samples in this paper are considered, the N4 Extension base layer (norite) and the Road S191 base layer (doler-ite) appear to consist of a crushed unbound material. Figure 18 depicts the bulk samples during sampling in which the crushed material can be seen. Grading analysis indicated that the Grading Modulus (GM) values of the two bulk samples are 2.60 and 2.50 respectively. No crushed material was visible in the remainder of the bulk material samples. This is also reflected in lower GM values ranging between 1.70 and 1.96.
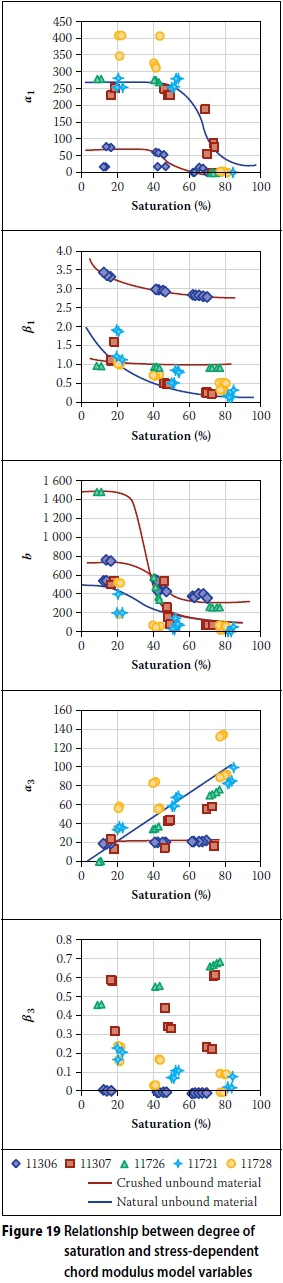
When the variables calibrated for each bulk material sample are compared with degree of saturation, it appears as if the crushed material and natural material group together. This is illustrated by the lines in Figure 19, which indicate the possible groupings. However, such a grouping could not be clearly identified for variable β3'.
The bulk material sample results were divided into two groups based on the appearance during sampling and the difference in GM of the samples. The crushed unbound material group consisted of N4 Extension base layer (norite) and Road S191 base layer material (dolerite). When the specified grading envelopes for G1 to G4 materials (COLTO 1998) are used to calculate the GM, GM values between 2.70 and 2.05 are calculated. The natural unbound material group consisted of N4 Extension upper selected (weathered chert), Road P10-2 base (weathered shale) and Road D804 base layer material (weathered calcrete). COLTO (1998) provides broad envelope values for GM for natural unbound materials (G5 to G9). Although the two material groups only consist of two and three bulk material samples respectively, the basic material properties (Table 1) indicate that the materials comprising the two groups are not similar and include a range of variability.
Model calibration for crushed unbound material
The model appears to have relatively good prediction accuracy for crushed unbound material considering that two different materials are now combined. This is indicated by the statistical parameters listed in Table 9 for the relatively high volumetric density (HD) and relatively low volumetric density (LD) samples. The error values observed are acceptable when variability inherent in materials is considered.
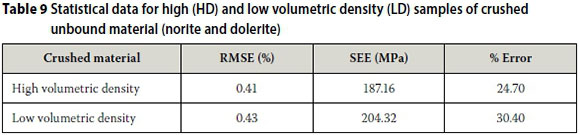
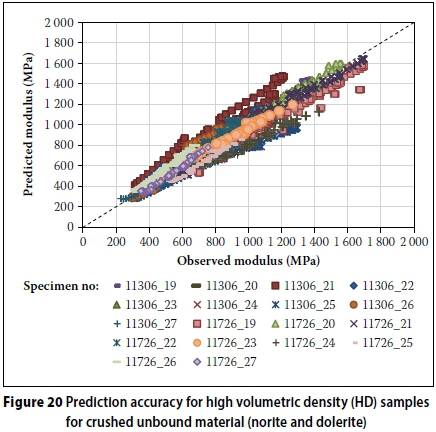
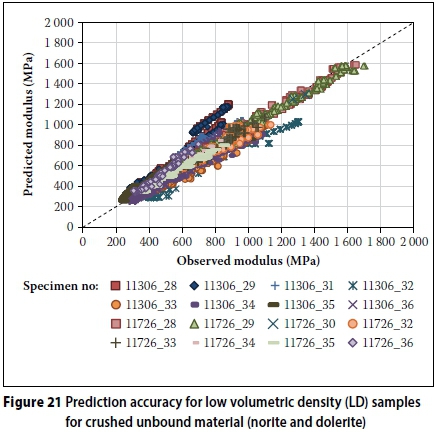
However, some of the individual test results appeared to not predict the material behaviour as accurately. Figures 20 and 21 depict the relationship between predicted and observed modulus values.
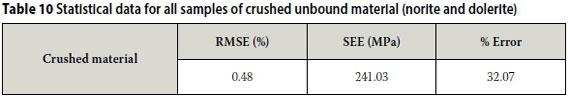
When the average of the model variables calibrated for HD and LD are calculated and used in the saturation and stress-dependent chord modulus model, the model retains relatively good prediction accuracy as indicated by the statistical parameters listed in Table 10. This was done, since the HD and LD designations were arbitrarily determined for this paper and it does not constitute universally accepted high or low volumetric density values. The statistical parameters per individual specimen did not improve or worsen significantly and is therefore not listed again.
Model calibration for natural unbound material
The model appears to have relatively good prediction accuracy for natural unbound material considering that three different materials are now combined. This is indicated by the statistical parameters listed in Table 11 for the high (HD) and low volumetric density (LD) samples. The error values observed are excellent when variability inherent in materials is considered.
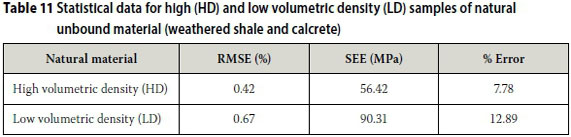
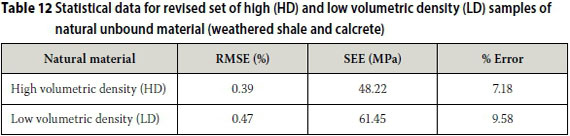
However, some of the individual test results appeared to not predict the material behaviour as accurately. Unlike for the crushed unbound material, the calibrated values generally fitted all three of the materials equally well. The same individual samples that were identified previously to have a worse fit generally also yielded higher SEE and error results. When all these individual samples are removed from the data set, the statistical data for high and low volumetric density samples improve, especially for the low volumetric density samples (Table 12).
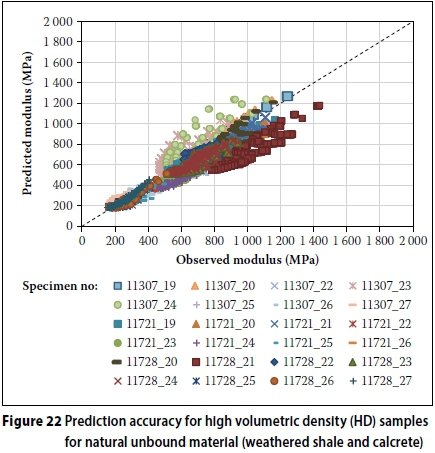
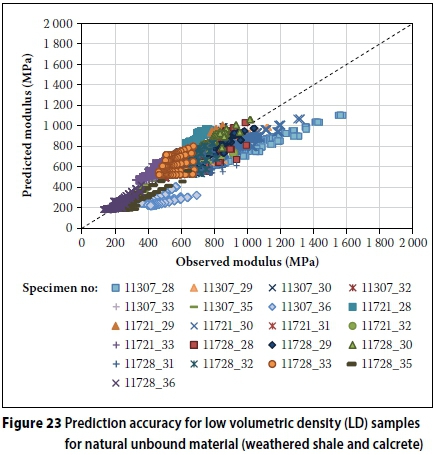
Figures 22 and 23 depict the relationship between predicted and observed modulus values. The accuracy depicted in Figure 22 does not appear to be as good, but when the SEE and error are considered, it appears acceptable.
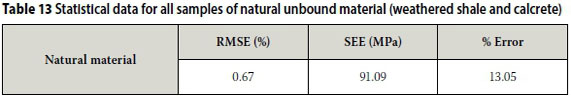
When the average of the model variables calibrated for HD and LD are calculated and used in the saturation- and stress-dependent chord modulus model, the model retains relatively good prediction accuracy, as indicated by the statistical parameters listed in Table 13. This was done since the HD and LD were arbitrarily determined for this paper and these do not constitute universally accepted high or low volumetric density values. The statistical parameters per individual sample did not improve or worsen significantly and were therefore not listed again.
PARAMETRIC ANALYSIS OF CALIBRATED CRUSHED AND NATURAL UNBOUND MATERIAL CHORD MODULUS MODELS
Crushed unbound material
The stress-dependent behaviour of the material is realistically reflected in the parametric plots, even when the two materials are combined. The parametric plots for saturation appear distorted. Stress and saturation parametric plots are depicted in Figure 24. The apparent distortion from parametric plots for the individual materials might be explainedwhen the Atterberg Limits (COLTO 1998) ofthe two materials are considered. Road S191 base layer material has a high fines content and PI, whereas the N4 Extension base layer material has low fines content and was classified as non-plastic. The influence of fines content and PI is distinguishable at low deviator stress levels and degree of saturation below 20%, where suction pressure appears to provide material strength. For deviator stress levels higher than 100 kPa and degree of saturation between 20% and 60%, the modulus decreases and or remains constant, where after it decreases for degree of saturation higher than 60%.
Natural unbound material
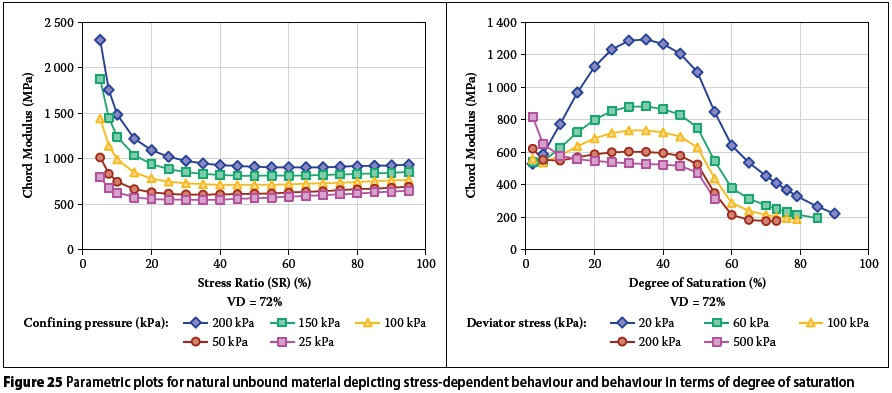
The stress-dependent behaviour of the material is realistically reflected in the parametric plots, even with the combination of three materials. The parametric plots for saturation appear consistent with plots of the individual materials. Stress and saturation parametric plots are depicted in Figure 25. The influence of high fines contents and PI is clear at low deviator stress levels (up to 100 kPa), where suction pressure appears to provide material strength. At deviator stress levels above 100 kPa the influence of suction pressure is overshadowed by the influence of confinement and the degree of saturation.
CONCLUSIONS
The chord modulus calculated from tri-axial test data (Anochie-Boateng et al 2009) for five different unbound granular materials illustrated the complex interaction between moisture in terms of degree of saturation and stress condition. The chord modulus model formulation consistently captured the complex stress-dependent behaviour of the selection of materials, but for the model to simulate the dependency of materials on the degree of saturation, multiple model components had to be introduced based on trends that could be observed from the data. A saturation- and stress-dependent chord modulus model was formulated and calibrated for all five bulk unbound granular material samples. The model generally showed a good prediction accuracy.
The model formulation was further tested when the materials were grouped into two groups - crushed and natural unbound materials. Calibration of the two groups yielded satisfactory prediction accuracy, but requires data for a wider selection of materials to boost confidence in the formulation and calibration of the model.
Preliminary conclusions reported in this paper indicate that the chord model formulation yields satisfactory predictions, especially when the model is calibrated for each individual material type.
ACKNOWLEDGEMENTS
This research project was executed as part of the revision of the South African Pavement Design Method, a project sponsored by the South African National Roads Agency SOCLtd (SANRAL) and the Council for Scientificand Industrial Research (CSIR). The authors would like to thank the sponsors for the funding made available to execute this research project.
DISCLAIMER
This paper reflects the views of the authors, who are responsible for the facts and the accuracy of the data presented herein. The contents do not necessarily reflect the official views or policies of SANRAL and the CSIR, nor the final models or data as incorporated into the revised South African Road Design System.
REFERENCES
Anochie-Boateng, J, Paige-Green, P & Mgangira, M B 2009. valuation of test methods for estimating resilient modulus of modules of pavement geomaterials. Paper presented at the 28th Annual Southern African Transport Conference 6-9 July 2009, CSIR International Convention Centre, Pretoria. [ Links ]
Brown, S F & Pappin, J W 1981. Analysis of pavements with granular bases. Transportation Research Record 810, Washington DC: Transportation Research Board. [ Links ]
COLTO (Committee of Land Transport Officials) 1998. Standard Specifications for Road and Bridge Works for State Authorities. South Africa: Department of Transport & SAICE. [ Links ]
DoT (Department of Transport) 1985. TRH 14: Technical Recommendations for Highways 14: Guidelines for road construction materials. Pretoria: Department of Transport. [ Links ]
DoT (Department of Transport) 1986. TMH 1: Technical Methods for Highways 1: Standard methods for testing of construction material, 2nd ed. Pretoria: Department of Transport. [ Links ]
DoT (Department of Transport) 1996. TRH 4: Draft Technical Recommendations for Highways 4: Structural design of flexible pavements for interurban and rural roads. Pretoria: Department of Transport. [ Links ]
Draper, N R & Smith, H 1998. Applied Regression Analysis, 3rd ed. New York: Wiley-Interscience. [ Links ]
Everitt, B S 2002. Cambridge Dictionary of Statistics, 2nd ed. Cambridge, UK: Cambridge University Press. [ Links ]
Hicks, R G & Monismith, C L 1971. Factors influencing the resilient properties of granular materials. Transportation Research Record 345, Washington DC: Transportation Research Board. [ Links ]
Lekarp, F, Isacsson, U & Dawson, A 2000. State of the art. I: Resilient response of unbound aggregates. Journal of Transportation Engineering, 126(1): 66-75. [ Links ]
Seed, H C, Chan, C K & Lee, C E 1962. Resilient characteristics of subgrade soils and their relation to fatigue failures in asphalt pavements. Proceedings, International Conference on the Structural Design of Asphalt Pavements, University of Michigan, US. [ Links ]
Theyse, H L 2008. A mechanistic-empirical design model for unbound granular pavement layers. PhD thesis, Johannesburg: University of Johannesburg. [ Links ]
Theyse, H L 2009. Resilient modulus models for partially saturated unbound granular material. Report No SANRAL/SAPDM/B1A-2009-01, Pretoria: Pavement Modelling Corporation. [ Links ]
Theyse, H L 2012. Stress-dependent resilient response model formulation for unbound granular material based on repeated load tri-axial test results. Report No SANRAL/SAPDM/B1A-2012-01, Pretoria: Pavement Modelling Corporation. [ Links ]
Theyse, H L, De Beer, M & Rust, F C 1996. Overview of the South African Mechanistic Pavement Design Analysis Method. Transportation Research Record 1539, Washington DC: Transportation Research Board, pp 6-17. [ Links ]
Thom, N H & Brown, S F 1987. Effect of moisture on the structural performance of a crushed-limestone road base. Transportation Research Record 1121, Washington DC: Transportation Research Board. [ Links ]
Uzan, J 1985. Characterisation of granular material. Transportation Research Record 1022, Washington DC: Transportation Research Board. [ Links ]
Van Aswegen, E & Steyn, W J vd M 2013. Statistical modelling of the resilient behaviour of unbound granular material. Slovak Journal of Civil Engineering, XXI(1): 9-16. [ Links ]
Van Aswegen, E & Theyse, H L 2011. Resilient response testing - Unbound material. Report No SANRAL/ SAPDM/B1A-2011-04, Pretoria: Ndodana Consulting Engineers and Pavement Modelling Corporation. [ Links ]
 Correspondence:
Dr Elsabé Van Aswegen
Jeffares & Green Consulting
PO Box 1109, Sunninghill
Johannesburg, 2157
South Africa
T: +27 (0)11 231 2200
E: vanaswegene@jgi.co.za
Prof Wynand Steyn
Department of Civil Engineering
University of Pretoria
Private Bag X20, Hatfield, 0028
South Africa
T: +27 (0)82 219 9704
E: wynand.steyn@up.ac.za
Dr Hechter Theyse
Pavement Modelling Corporation
1397 Starkey Avenue
Waverley, Pretoria, 0186
South Africa
T: +27 (0)12 332 5507
E: htheyse@telkomsa.net

DR ELSABÉ VAN ASWEGEN Pr Eng, MSAICE, is a professional pavement engineer currently with Jeffares & Green Consulting. She obtained a PhD in Civil Engineering from the University of Pretoria in 2013. She has spent 10 years in the pavement engineering field and has gained experience in pavement design, construction management, pavement management systems and specialist studies.

PROF WYNAND STEYN Pr Eng, MSAICE, is a professional pavement engineer with a research interest in vehicle-pavement interaction, accelerated pavement testing, and pavement materials and instrumentation. He obtained a PhD in Civil Engineering from the University of Pretoria in 2001. He spent 19 years with the CSIR (Council for Scientific and Industrial Research) in various positions and is currently professor of civil engineering (focusing on road pavement related subjects) at the University of Pretoria. His professional activities include academic and industry research in the areas of pavement engineering, vehicle-pavement interaction and pavement materials. He has authored and co-authored 20 journal papers, 17 book chapters and 74 conference papers.

DR HECHTER THEYSE Pr Eng started his career in 1987 at the CSIR (Council for Scientific and Industrial Research) doing research on pavement performance and design. He has been actively involved in pavement engineering in South Africa and California, and has contributed to pavement design methods locally and abroad. He completed his PhD in 2008 on the modelling and design of partially saturated unbound granular material. His recent focus has been on the revision of the South African mechanistic-empirical design method for flexible pavements, including new and rehabilitation design.

