


Serviços Personalizados
Artigo
 Inglês (pdf)
 Artigo em XML
 Referências do artigo
Indicadores

Links relacionados
-
 Citado por Google
 -
 Similares em Google
Compartilhar

 Permalink
Journal of the South African Institution of Civil Engineering
versão On-line ISSN 2309-8775
versão impressa ISSN 1021-2019
J. S. Afr. Inst. Civ. Eng. vol.57 no.1 Midrand Jan./Mar. 2015
http://dx.doi.org/10.17159/2309-8775/2015/v57n1a7
TECHNICAL PAPER
The effect of bedding errors on the accuracy of plate load tests
H F T Barnard; G Heymann
ABSTRACT
During conventional plate load tests the stiffness of the ground is determined by measuring the settlement of a plate placed on the ground surface. If the contact between the plate and the ground is rough, bedding errors may occur during the test when plastic deformation occurs at the contacts between the plate and the ground. This paper addresses the effect of bedding errors on the accuracy of plate load tests. Three different surface preparation methods were investigated. In addition, a modified plate load test was designed to eliminate the effect of bedding errors that occur during these tests. Telescopic probes were used to measure the relative displacement at two points below the centre of the plate. The stiffness values, determined from the vertical displacement of the plate, were compared with the internal stiffness values determined by means of the telescopic probes. All stiffness values were compared with Continuous Surface Wave (CSW) measurements performed on the same material. The test apparatus, methods and results are discussed in this paper.
Keywords: plate load test, bedding errors, surface roughness, surface preparation methods, telescopic probes, soil stiffness
INTRODUCTION
Plate load tests have been used extensively in the past to determine the bearing capacity and the stiffness of soil. Terzaghi and Peck (1948) used plate load tests to develop their settlement charts for footings on sand. Most geotechnical problems are governed by allowable settlement requirements, and therefore geotechnical engineers are continuously searching for improved test methods and new techniques to determine soil stiffness more accurately and cost-effectively. Two of the main advantages of plate load tests are the cost-effectiveness of the test and the relative straightforward test procedure. However, bedding errors affect the soil stiffness measurements during plate load tests and therefore they should be kept to a minimum.
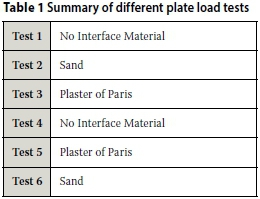
A series of plate load tests were conducted at the experimental farm of the University of Pretoria. Three different surface preparation methods were used before each test. These were (1) the use of only hand tools to level the test area, (2) a thin layer of well-graded sand, and (3) a thin layer of Plaster of Paris. For each surface preparation method, two plate load tests were performed as summarised in Table 1.
The surface roughness was measured by means of a high-precision laser measuring system. The test area was scanned with the laser measuring system before and after each test in order to evaluate the change in surface roughness during the test.
In addition, a modified plate load test was designed to eliminate the effect of bedding errors that occur during these tests by using telescopic probes to measure the relative displacement at two points below the centre of the plate. The stiffness values, determined from the vertical displacement of the plate, were compared with the internal stiffness values determined by means of the telescopic probes, as well as with the stiffness from Continuous Surface Wave (CSW) measurements.
METHODOLOGY
Figure 1 shows the plate load test setup that has been designed for the experimental work. The tests were conducted on residual Andesite, which was described as reddish brown, firm, clayey silt. The main components of the plate load test included a 1.3 ton steel reaction beam together with four grouted anchors, a hollow hydraulic jack with 200 kN load capacity, a hollow load cell with 100 kN load capacity, loading plates with central holes and three Direct Current Differential Transformers (DCDT's) connected to two 3.0 m long wooden reference beams.

Figure 2 shows a photo of the plate load setup. The 300 mm steel plate was placed on top of the 450 mm plate, and the vertical displacement of the bottom 450 mm plate was measured with three DCDTs placed 120 degrees apart and approximately 25 mm from the plate perimeter to monitor any tilt that might occur during testing.

One of the main objectives of this research project was to evaluate the effect of the surface preparation method on the accuracy of a plate load test. The three most popular surface preparation methods in South Africa were investigated which were (1) the use of only hand tools to level the test area, (2) a thin layer of well-graded sand, and (3) a thin layer of Plaster of Paris. When considering the use of a particular interface material it is important to consider the strength and stiffness of the interface material relative to the strength and stiffness of the in situ material. The interface material must have higher strength and stiffness than the in situ material in order to minimise compression and avoid yield of the interface material. This will result in strains occurring in the interface material, which will erroneously be taken as strain occurring in the in situ material. For instance, Plaster of Paris may be a suitable interface material when conducting a plate load test on soil, but may not be suitable for rock or rock masses.
For the first surface preparation method, the surface was levelled as smoothly as possible using only hand tools. Occasional gravel particles in some of the test holes made it difficult to level the test surface in this manner. For the second method, the test surface was first levelled with hand tools and after that a thin layer of well-graded silica sand, less than 20 mm in thickness, was spread across the testing area. The third method was to prepare the surface with a thin layer of Plaster of Paris prior to testing.
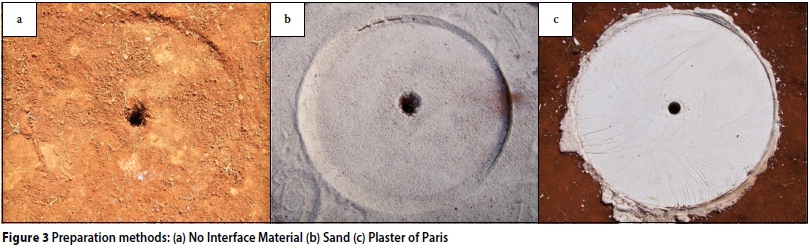
The 'Plaster of Paris' method required skilled personnel due to the quick setting time of Plaster of Paris in approximately 15 minutes. First, a thin plastic film sheet was placed over the plate to prevent the plaster from adhering to the plate. The Plaster of Paris was mixed with water to achieve a soft-to-firm consistency, then quickly applied to the test area and spread evenly using hand tools. The plate was placed on top of the wet plaster, and allowed to dry completely. Figure 3 shows the three surface preparation methods.
The laser measuring system used to measure the surface roughness before and after each test is shown in Figure 4. The main components of the system included a steel frame with a tripod stand, a two-directional scan unit mounted on the steel frame, a Cable-Extension Position Transducer (CEPT) with a maximum range of 762 mm, a laser distance gauge with a resolution of 10 µrn and a data acquisition system to record the measurements electronically. Both the laser distance gauge and the CEPT were attached to the movable scan unit to measure the distances in the Z and Y directions, respectively. The scan unit was fixed in the X direction at twelve positions while it was manually moved in the Y direction to create twelve consecutive scanning lines across the test area. The laser distance gauge attached to the scan unit measured the elevation in the Z direction, and at the same time the horizontal distance in the Y direction was recorded with the CEPT.

The telescopic probes were constructed from an 8 mm solid aluminium inner rod, an aluminium tube with an inner diameter of 13 mm and a probe head that consisted of three bent spring steel strips welded onto a stainless steel nut as shown in Figure 5. The aluminium rod was designed to slide freely inside the aluminium tube.

A 25 mm hole was drilled vertically into the soil by means of a hand bore at the centre of the 2 m x 2 m test area to a depth of one plate diameter (450 mm) below ground surface. Poulos and Davis (1974) concluded that a central hole with a radius equal to 30% of the plate radius will only have a 5% effect on the measured stiffness. Therefore, the 25 mm hole with a radius of approximately 5% of the plate radius (225 mm) should not have a significant effect on the measured soil stiffness. The solid aluminium rod was grouted at the bottom of the hole, with quick-set grout and the spring steel probe head fixed at a depth of half the plate diameter (225 mm) below the ground surface. An LVDT was used to measure the relative displacement of the two positions below the centre of the plate.
A load sequence was applied which comprised three cycles of 0 to 8 kN, 0 to 24 kNand 0 to 100 kN. For the 450 mm platediameter, these loads resulted in 50 kPa, 150 kPa and 628 kPa contact pressures respectively. Load application from 0 kN to the full load for a particular cycle varied between approximately 10 and 20 minutes. However, the rest period at the end of each load cycle, to allow the creep to subside to less than 0.030 mm per minute for three consecutive minutes, varied between approximately 30 minutes and 2 hours. All instruments were continuously recorded at 10 Hz throughout the tests.
After all the load cycles had been applied, all equipment items were removed carefully without disturbing the test area, and the test surface was again scanned with the laser measuring system at the same position as before the test.
DATA INTERPRETATION
Surface roughness
The surface roughness, before and after each test, was described by the calculation of a number of surface roughness parameters for each test. Surface roughness is a measure of the texture of a surface and is quantified by the perpendicular deviation (yi) of a real surface from its ideal form (Sahoo 2005). Several standard parameters summarised in Table 2 were used to describe the surface roughness for each surface preparation method.

In addition to the surface roughness parameters shown in Table 2, the Bearing Area Curve (Abbott & Firestone 1933) was used to quantify the surface roughness. The Bearing Area Curve (BAC) is a concise means of describing a surface and is by definition the integral of the probability distribution related to the Amplitude Distribution Function (ADF) as shown in Equation (1) (Stewart 1990).
BAC = ∫aDF = ∫P(y) • dy (1)
Where:
y = height deviation from the mean line
Since the BAC is the cumulative distribution curve of the ADF, the BACs can be calculated for each data set by sorting all height deviations in descending order and plotting the sorted data from 0 to 100%, where 100% = n (the total number of scanned points). The roughness of different surfaces can be compared by comparing their BACs. The maximum valley depth and maximum peak height of a surface are immediately apparent from the curve. In addition, a smooth surface will result in a steep curve and a rough surface in a flat curve.
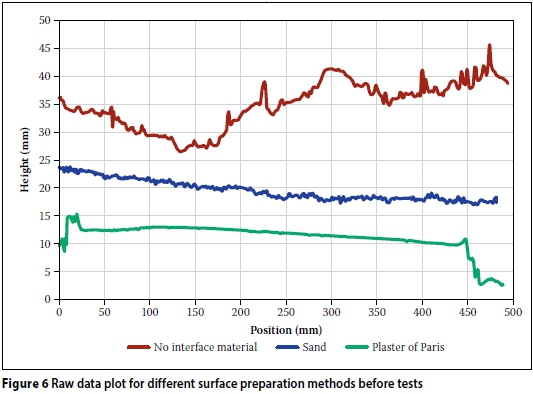
The surface areas were scanned before and after each test using twelve parallel lines. Figure 6 shows a typical plot of the raw data taken from the three surface preparation methods before each test. For the analysis, only data from inside the plate area was used. A least-squares linear regression line was calculated and the surface roughness was quantified as the perpendicular deviation (yi) of the measured surface from the linear equation. The seven surface roughness parameters, described in Table 2 were calculated for each scanned line. Average values for Ra, Rq, Rsk and Rku were calculated from all twelve lines to represent the total scanned area of the plate. In addition, the total range (Rt) was calculated as the difference between the deepest valley (Rv) and highest peak (Rp) for the entire data set. All roughness parameters and bearing area curves from the different surface preparation methods were compared to evaluate the surface roughness for each test.
Determination of stiffness from external measurements
Equation (2) was used to calculate the secant stiffness (Eext) at different plate settlements (e.g. Timoshenko & Goodier 1951). The contact stress (q) was taken as the applied load divided by the plate area, which assumed a uniform pressure distribution across the plate with diameter (D). The average vertical displacement of the plate (p) was obtained from the three DCDTs and Poisson's ratio (v) was taken as 0.35:

Determination of stiffness from internal measurements
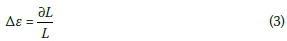
The measured relative displacement of the telescopic probes (ƏL) was used in Equation (3), together with the distance between the two probe points (L = 225 mm), to determine the axial strain (∆ε) at any time during the test.
Boussinesq's theory was used to calculate the vertical stress at depth z below the centre of the circular plate with diameter D = 2R, subject to a uniform pressure (q), as shown in Equation (4). Values of the influence factor (Ic) are always between zero and unity (Boussinesq 1885).

The radial stress (σr) at depth z below the centre of the circular plate was calculated using Equation (5) (Boussinesq 1885).

The internal stiffness (EInt) was calculated using Equation (6) which assumes axis symmetrical conditions (Handy 2007). The vertical stress increment (∆σz) and radial stress increment (∆σr) were taken as the average for the two measurement points beneath the plate, for the corresponding axial strain increment (∆ε).
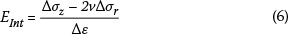
Plate load tests without telescopic probes measure only plate settlement and not soil strain. Therefore, in order to compare the external stiffness with the internal stiffness values at various strain levels during the test, an assumption was required to calculate the average strain of the soil beneath the plate. The average soil strain was taken as the plate settlement (p) divided by 1.5 times the plate diameter. This was based on the influence depth for circular foundations proposed by Boussinesq (1885), where less than 20% of the applied stress occurs below 1.5 times the plate diameter.
In addition, the external stiffness and internal stiffness values were also compared with the small strain stiffness values obtained from Continuous Surface Wave tests conducted on the same material. The stiffness degradation envelope developed by Clayton and Heymann (2001) were used to allow comparison of the external stiffness and internal stiffness values at various strain levels.
RESULTS AND DISCUSSION
Initial surface preparation
The initial surface roughness was measured and quantified for all six tests prior to any additional treatment with sand or Plaster of Paris. The surface roughness parameters determined before the tests are shown in Table 3. The results showed that the maximum average roughness value (Ra) calculated for the scans were 2.133 mm in Test 1 and the minimum average roughness value was 0.711 mm in Test 5. Table 3 also shows a wide range of the maximum valley depth value (Rv) that differed between -3.278 mm and -10.844 mm, and the maximum peak value (Rp) between 3.390 mm and 10.368 mm. These high values indicate the difficulty in levelling the test area by the use of only hand tools, even though there appeared to be an improvement as the testing programme progressed. The root mean square roughness values (Rq) presented in Table 3 represent the standard deviation of the height distribution. The skewness values (Rsk) for Tests 2, 3 and 5 indicate that the height distribution will fit a Gaussian (normal) distribution well, because of the close-to-zero values.

Sand as interface material
The initial surface roughness for the 'Sand' case was quantified for Test 2 and Test 6 after a thin layer of well-graded sand had been placed on the test surface. These values were measured after the plate had been placed, levelled and then removed. The surface roughness parameters are shown in Table 4. The results show total range values (Rt) of 2.808 mm and 2.992 mm, which indicate a small difference between the maximum valley depth values (Rv) and the maximum peak values (Rp). The surfaces had average roughness values (Ra) of 0.333 mm and 0.272 mm, which are less than the values achieved for any of the surfaces prepared by hand tools, indicating a much smoother surface finish when using sand as interface material.

The skewness values (Rsk) was close to zero for both tests, and kurtosis values of the order of 3.0 mm. This implies that the height distribution will follow a Gaussian (normal) distribution.
Plaster of Paris as interface material
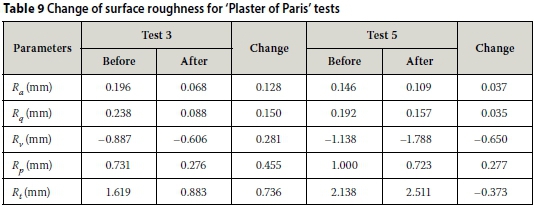
The initial surface roughness for the 'Plaster of Paris' cases was quantified for Test 3 and Test 5 as per Table 5. The surface roughness was measured again after the plate had been placed on top of a thin layer of Plaster of Paris, allowed to dry completely and then removed. The results show significantly lower average roughness values (Ra) of 0.196 mm and 0.146 mm than both the hand tool prepared surfaces and sand interface material. This indicates that on average the surface is much smoother when using Plaster of Paris. In addition, the Plaster of Paris ranged between 1.618 mm and 2.138 mm, whereas it was of the order of 3.0 mm for the sand interface material, and ranged between 6.668 mm and 21.212 mm for the surfaces prepared by hand tools.

The maximum valley depth values (Rv) were calculated as -0.887 mm and -1.138 mm, and the maximum peak values (Rp) as 0.731 mm and 1.0 mm. The skewness value (Rsk) for both tests showed negative values, which indicate that the surface is composed of mainly one plateau with shallow valleys. This is evident on close inspection of Figure 3(c). The valleys were probably created by folds of the plastic film used to cover the plate before placing it on the wet Plaster of Paris.
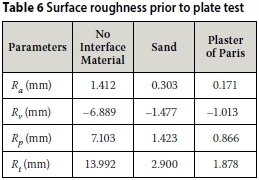
The average values for Ra, Rv, Rpand Rtare compared for the three surface preparation methods in Table 6. The results show that using sand or Plaster of Paris as interface material results in a significantly smoother surface than when no interface material is used. It also shows that Plaster of Paris is superior to sand. Depending on which parameter is used, the surface roughness of the Plaster of Paris was between 30% and 40% better than that of the 'Sand' test, and approximately 88% better than that of the 'No Interface Material' test.
Bearing Area Curves were calculated for all data sets. As discussed earlier the BAC is the cumulative distribution of the surface roughness of the complete test surface. Typical BACs for the 'Plaster of Paris' and 'Sand' tests are shown in Figure 7, together with a lower and upper boundary for the 'No Interface Material' tests. It is evident from the curves that even the smoothest surface achieved for the 'No Interface Material' preparation method resulted in a much rougher surface compared to the other two preparation methods. In addition, it confirms that the 'Plaster of Paris' preparation method resulted in the smoothest surface with the flattest surface topography.

Change in surface roughness
The surface roughness was quantified after each test and compared with the initial surface roughness. This comparison was important to determine whether a change in surface roughness occurred during each test, as it would allow judgement to be made on the bedding errors that occurred during the test.
Tables 7, 8 and 9 show the surface roughness for the three surface preparation techniques before and after the plate load test, as well as the change in surface roughness that occurred as a result of the test.


The results shown in Table 7 show that for the two tests where no interface material was used the surfaces were smoother after the tests. For Test 1 there was a marginal improvement and, depending which roughness parameter is used, the improvement ranged between approximately 20% and 50%. Test 1 showed a reduction in average roughness of about 1 mm during the tests. However, it should be noted that the average roughness value after Test 1 (Ra= 1.054) is still approximately three times larger when compared with the Ravalues of 0.303 and 0.171 measured before the 'Sand' and 'Plaster of Paris' tests respectively. Figure 8(a) shows the surface roughness profiles before and after Test 1. These graphs present all twelve lines that were scanned for each test surface. Figure 8(a) confirms the marginal improvement in surface roughness for Test 1.


For Test 4 the surface was also prepared using hand tools only. The surface roughness after the test was significantly less than for Test 1. This is due to two reasons. Firstly, the surface was better prepared than for Test 1. This may be seen by comparing the surface roughness parameters before both tests. It can be seen that the surface roughness of Test 4 prior to load application was less than the surface roughness of Test 1 after load application. Secondly, Test 4 had to be temporarily halted between cycles 2 and 3 due to rain.
Approximately one week was allowed for the soil to return to its initial moisture conditions before continuing with the test, but it is believed to have contributed to the smooth surface after load application.
Some testing standards on plate load testing suggest that small initial load cycles may be used to eliminate the effect of bedding errors on the accuracy of plate load tests. This may be true for soft soil, but the results shown in Table 7 show that, for the firm residual Andesite tested during this investigation, small initial cycles would not have eliminated bedding errors. It is evident that some level of surface roughness was still present after the full 628 kPa load had been applied to the surface.
The strength and stiffness of sand depends on its effective stress. This implies that the behaviour of the sand will be different during load application than when scanning the surface with the plate removed. The data from Tests 2 and 6 for the sand interface material shows mixed results. Some parameters were lower after the test, suggesting a smoother surface, whilst others were higher. Table 8 shows an average roughness value (Ra) after the test of 0.23 mm compared with 0.33 mm measured before the tests. However, the Ravalue for Test 6 actually increased by 4.5%. It is evident that the surface roughness does not change significantly during the test if sand is used as the interface material. The Rv, Rp and Rtvalues also did not change in a constant manner, with positive and negative changes being evident from Table 8.
Figure 8(b) shows the surface roughness profiles before and after Test 2. The imprint of the 450 mm plate is clearly visible. The question arises whether the imprint indicates plastic deformation of the sand material contributing to bedding errors or whether the plastic deformation occurred in the residual Andesite. This question may be answered by comparing the internal and external stiffness values, which will be discussed in the following section.
Tests 3 and 5 were the tests using Plaster of Paris as interface material, and the results are shown in Table 9. The results indicate that the surfaces were smooth before the test and in general even smoother afterwards. It may be concluded that a small amount of plastic deformation occurred in the cured Plaster of Paris during load application.
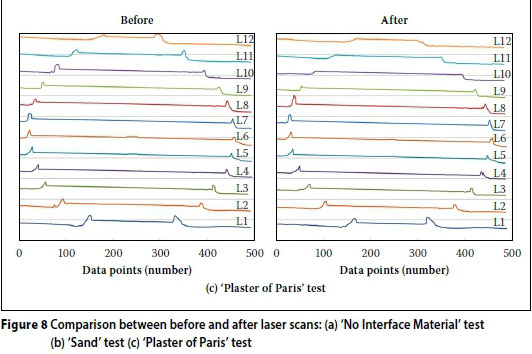
Figure 8(c) presents the surface roughness profiles before and after Test 3 and it is evident that the surface was very smooth prior to the test. The imprint of the 450 mm plate is visible in the Plaster of Paris before and after the test. The imprint before the test was due to the procedure of first placing the plate on the wet Plaster of Paris, removing it, scanning the surface and then replacing it. The results further support the conclusion that Plaster of Paris is the most effective surface preparation method for creating the smoothest surface for plate load tests on soils.
Stiffness measurements from plate load tests
For conventional plate load tests, the applied load and plate settlement are measured using measurement instrumentation above the ground surface, and the external stiffness is calculated using Equation 2 (Eext). In contrast, internal stiffness is determined from the telescopic probes located in the soil below the plate and calculated from Equations 4 to 6 (Eint).
External and internal stiffness values were compared with the stiffness degradation curve proposed by Clayton and Heymann (2001). Continuous Surface Wave (CSW) tests were performed in order to determine the small strain stiffness (E0), required to generate a Clayton-Heymann stiffness degradation curve. The CSW test results showed small strain stiffness (E0) values of about 250 MPa.
External stiffness measurements
Tests 2, 3 and 4 were used as the representative tests for each preparation method, to compare the results obtained from the three surface preparation techniques. The external stiffnesses for the three cycles at different strain levels are shown in Figures 9(a) to (c).
Figure 9(a) shows the external stiffness values for all three preparation methods recorded during the first 50 kPa cycle. The results show that the 'Plaster of Paris' and 'Sand' tests provided higher values compared to the values where the surface was levelled by hand and no interface material was used. Although the 'Plaster of Paris' test shows the highest stiffness values, it was 50% less than the small strain stiffness from the CSW test.
The external stiffness values for the second cycle (150 kPa) are presented in Figure 9(b). These results show that the 'Plaster of Paris' and 'Sand' tests again produced higher values compared to the test using no interface material. Figure 9(c) shows the results for the last load cycle. An interesting observation here is that the 'Sand' and the 'No Interface Material' tests had similar stiffness values, while the 'Plaster of Paris' test stiffnesses were about 20% higher in comparison. The results further show that the 'Plaster of Paris' test corresponded well with the lower boundary of the Clayton-Heymann degradation envelope above 0.080% axial strain.
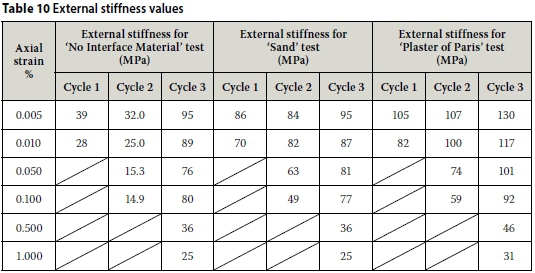
All external stiffness values at different axial strain levels are shown in Table 10. It may be seen from these results that the 'Plaster of Paris' test produced significantly higher stiffness values for all three cycles. It is also important to note that the stiffness values for the last cycle were higher compared to the first two cycles for all tests.
Internal stiffness measurements
The stiffnesses determined from the measurements made by the telescopic probes are presented in Figure 9(d) to (f) for the three load cycles and summarised in Table 11.

Figure 9(d) shows the internal stiffness values for all three surface preparation methods for the first load cycle. The sand test produced the highest stiffness values, which compared reasonably well with the Clayton-Heymann degradation envelope.
The internal stiffness values for the second load cycle are shown in Figure 9(e). The results show very similar stiffness values between 0.005% and 0.100% strain for all tests, but were slightly lower than the stiffness degradation envelope.
Figure 9(f) shows that all three tests produced similar internal stiffness values for the entire strain range and corresponded well with the Clayton-Heymann stiffness degradation envelope for most strain levels. The CSW test measures the stiffness of soil at very small strains (< 0.002%). The internal stiffness for the third cycle at strains less than 0.002% compared reasonably well with the CSW results for all three tests, as shown in Figure 9(f).
For the last two cycles, similar internal stiffness values were recorded regardless of the surface preparation technique. This was anticipated as it was expected that strains measured by the telescopic probes would be independent of bedding errors that may occur between the plate and the soil. Interestingly this was not the case for the first cycles (Figure 9(d)) where the stiffness values were different for each of the three preparation methods. The reason for this is not clear, but may have been due to bedding of the spring steel strips into the sides of the bored hole during the first load cycle.
It is important to note that the stiffness values determined in the last cycle were always higher compared to the first two cycles, except for the internal stiffness values at strain levels smaller than 0.01% for the 'Sand' test (see Table 11). It is evident that strain hardening of the soil took place for all tests during the first two load cycles.
Comparison of stiffness from external and internal measurements
Comparison of the stiffnesses determined from external and internal measurement should give insight into the effect of bedding errors on plate load tests. This is based on the assumption that stiffness measurements from internal measurements will be independent of any bedding errors between the plate and soil, whereas stiffness from external measurements will include the effects of bedding errors. Table 12 shows the ratio of external and internal stiffnesses measurements for the different surface preparation methods and load cycles.
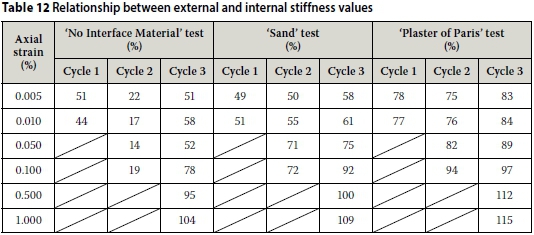
Figures 10, 11 and 12 compare the internal and external stiffness for the third load cycle for the three surface preparation techniques at all strain levels. The results show that the stiffnesses from the internal measurements were consistently higher for all tests except for strain levels in excess of 1%.


For the 'Sand' test (Figure 11), the internal stiffness was between 30% and 40% higher, up to 0.05% strain. Both these stiffness curves compare reasonably well with the lower boundary of the Clayton-Heymann envelope at strains greater than 0.1%.
Table 12 and Figure 12 show that the external stiffness values measured in the 'Plaster of Paris' test is closer to the internal stiffness values and it may be concluded that the Plaster of Paris performed the best of the three surface preparation techniques.
It is evident from Figures 9(a) to (c) and Table 10 that the external stiffness values for all tests were higher during the last cycle compared with the first two cycles. This raises the question whether this increase in stiffness was caused by a decrease in bedding errors during the first two cycles. However, this is not the case, since the same trend was observed in most of the internal stiffness values (see Table 11) where the telescopic probes were not influenced by bedding errors. In addition, the test surface scanned after load application showed that after more than 600 kPa pressure had been applied to the soil without interface material, significant surface roughness was still present. It is believed that the increased stiffness for the third load cycle was caused by strain hardening that occurred during the first two load cycles.
The data indicates that measurements made using telescopic probes are superior to those from external measurements used in routine plate load tests, especially at small and intermediate strain levels.
CONCLUSIONS AND RECOMMENDATIONS
Plate load tests have an important role in geotechnical engineering in the determination of soil stiffness. Results from this study demonstrate that bedding errors can have a significant effect on soil stiffness values when external measurements are used to measure the settlement of the plate. Such plate load tests can result in stiffness values of up to 50% lower than stiffness values inferred from seismic tests. In addition, measurements made using telescopic probes are superior to those from external measurements, especially at small and intermediate strain levels. This method is therefore recommended for use when accurate stiffness values are required.
Well-graded sand may be the most practical material to use as interface material in order to minimise bedding errors, but Plaster of Paris resulted in more accurate stiffness measurements. Plaster of Paris is therefore recommended as interface material when conducting plate load tests on soils.
REFERENCES
Abbott, E J & Firestone, F A 1933. Specifying surface quality: A method based on accurate measurement and comparison. Mechanical Engineering, 55: 569-572. [ Links ]
Boussinesq, J 1885. Application des pontentiels a laetude de lequilibre et du movement de solides elastiques. Paris: Gauthier-Villard. [ Links ]
Clayton, C R I & Heymann, G 2001. The stiffness of geomaterials at very small strains. Géotechnique, 51(3): 245-256. [ Links ]
Degarmo, E P, Black, J T & Kohser, A 2003. Materials and Processes in Manufacturing, 9th ed. New York: Wiley, p 223. [ Links ]
Handy, R L 2007. Geotechnical Engineering: Soil and Foundation Principles and Practice, 5th ed. New York: McGraw-Hill, pp 385 & 882, Eqs 15-17. [ Links ]
Poulos, H G & Davis, E H 1974. Elastic Solutions for Soil and Rock Mechanics. New York: Wiley, Ch 3, pp 43-49 & Ch 7, pp 165-180. [ Links ]
Sahoo, P 2005. Engineering Tribology. New Delhi: Prentice Hall of India, p 336. [ Links ]
Steward, M 1990. A new approach to the use of Bearing Area Curve. Proceedings, International Honing Technologies and Applications Conference, Society of Manufacturing Engineers, Novi, Michigan, 1-3 May, FC90-229. [ Links ]
Terzaghi, K & Peck, R B 1948. Soil Mechanics in Engineering, 1st ed. New York: Wiley. [ Links ]
Timoshenko, S & Goodier, J N 1951. Theory of Elasticity. New York: McGraw-Hill, pp 368-372. [ Links ]
 Correspondence:
Hennie Barnard
Aurecon Centre
Lynnwood Bridge Office Park
4 Daventry Street
Lynnwood Manor, 0081
South Africa
T: +27 (0)83 785 0852
E: hennie.barnard@aurecongroup.com
Prof Gerhard Heymann
Department of Civil Engineering
University of Pretoria
Pretoria,0002
South Africa
T: +27 (0)12 420 3627
E: gerhard.heymann@up.ac.za

HENNIE BARNARD, who is an associate member of SAICE, graduated with a BEng and BEng (Hons) degrees in Civil Engineering from the University of Pretoria. He started working for Aurecon in their Tshwane office as a geotechnical engineer, gaining experience in the fields of foundation and ground engineering, before being transferred to the Aurecon Polokwane office in early 2012, where he gained further experience in site supervision and project management in the fields of civil and structural engineering. At the end of 2013 he completed his MEng (Geotechnical) degree, also at the University of Pretoria, and is now again working in the Aurecon Tshwane office where he is continuing his development as a geotechnical engineer.

PROF GERHARD HEYMANN, who is a member ofSAICE, graduated with BEng and MEng degrees from the University of Pretoria. In the late 1990s he spent three years in the United Kingdom conducting research on the stiffness behaviour of soils and subsequently obtained a PhD from the University of Surrey. He is currently professor in the Department of Civil Engineering at the University of Pretoria where he lectures and researches soil mechanics.

