


Serviços Personalizados
Artigo
 Inglês (pdf)
 Artigo em XML
 Referências do artigo
Indicadores

Links relacionados
-
 Citado por Google
 -
 Similares em Google
Compartilhar

 Permalink
Journal of the South African Institution of Civil Engineering
versão On-line ISSN 2309-8775
versão impressa ISSN 1021-2019
J. S. Afr. Inst. Civ. Eng. vol.57 no.1 Midrand Jan./Mar. 2015
http://dx.doi.org/10.17159/2309-8775/2015/v57n1a4
TECHNICAL PAPER
Structures subjected to startup and shutdown of rotating machinery
A A Elvin; N G Elvin
ABSTRACT
With the advent of fast computers and easy-to-use software, transient dynamic analysis of structures has apparently become easy to perform. The engineer usually enters the entire structure (even in three dimensions) and produces results and plots that are sophisticated in appearance. The simulation results are most probably accepted without asking the following questions: "Are the results correct?" and "What is the sensitivity of the results to the various parameters?" The approach in this paper is different and more traditional: the salient behaviour of transient machinery during startup and shutdown is presented after studying the response of a structure which has been reduced to a single degree of freedom. The two-dimensional forces generated by rotating machinery during startup/shutdown have been derived analytically. Normalised curves have been computed to show the maximum response of the structure. A wide range of damping ratios has been considered. The maximum structural deflections during startup/shutdown can be significantly greater than the steady-state response and thus cannot be ignored. The normalised curves show that common approaches to limit dynamic deflections by increasing stiffness and/or damping have to be carefully considered during the transient regime. Two examples of an unbraced and a braced portal frame have been presented to demonstrate the practical use of these normalised curves.
Keywords: startup, shutdown, rotating machinery, dynamics, normalised analysis curves
INTRODUCTION
An engineer faced with the analysis of a support structure under vibrating machinery typically needs first to estimate the natural frequency of the structure, either through simplified approaches or through sophisticated computer analysis. When the dynamic loading is harmonic (such as from rotating machinery) these structures are typically designed to have their fundamental natural frequency greater than the loading frequency of the machine (so-called high-tuning the structure) or to have their fundamental frequency less than the loading frequency (so-called low-tuning). Some machinery operates at speeds of greater than 1 000 revolutions per minute (rpm), i.e. 16 Hz. The following list gives an indication of operating frequencies:
■ Large mills: 0.3 to 1 Hz
■ Small mills: 1 to 3 Hz
■ Washing machines: 6 to 14 Hz
■ Electric motors: 10 to 20 Hz
■ Feeders and screens: 12 to 18 Hz
■ Electric turbines: 25, 50 or 100 Hz
Typical structures have their first natural frequency below 10 Hz. Thus, practically speaking some structures must be low-tuned. For such structures the driving frequency of the machine during startup must pass through the natural frequency of the structure before the final operating frequency is reached. Similarly the machine's frequency must also pass through the structure's resonance frequency during shutdown. For low-tuned structures, the design engineer commonly considers the steady-state dynamic response and full resonance dynamic response; the latter being assumed to be the most conservative case. If the design is adequate under these conditions, no further analysis is required. Should this conservative approach suggest problems, then startup or shutdown response is considered.
More sophisticated approaches which include full transient dynamic analyses of the structure are often not carried out in practice, and are not required by current building codes, although many project specifications include this requirement. It must be emphasised that a full transient analysis in reality is complicated to perform and should be accompanied either with a thorough parametric analysis and result verification. With the advent of easy-to-use software, and fast computers, the onus has further been shifted onto the engineer to determine what makes sense and what does not. The whole aim of this paper is to develop reader intuition. The approach undertaken is to model the structure as a one-degree-of-freedom system and study the transient response.
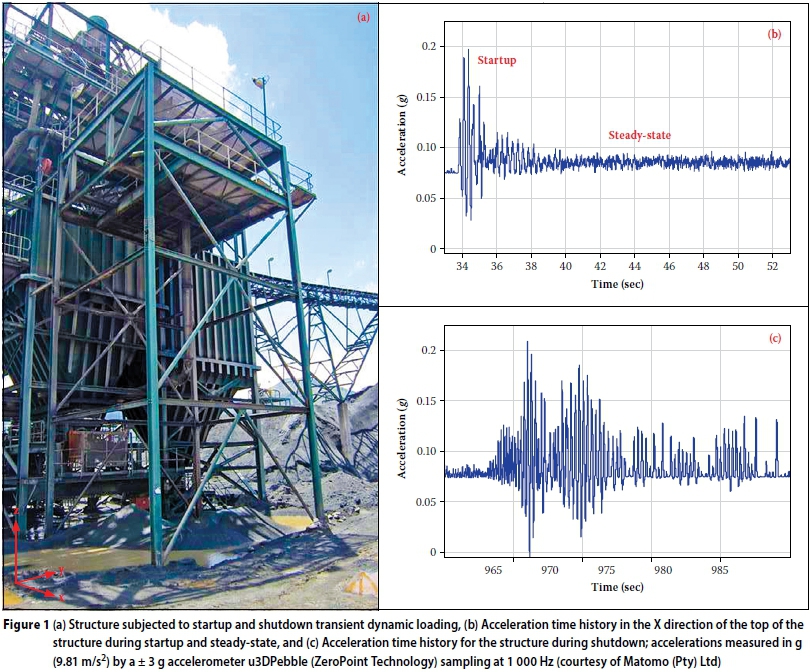
Figure 1(a) shows a commercial structure that supports a vibrating screen. The typical acceleration history response of the structure is shown in Figures 1(b) and 1(c). The former figure shows the machine startup and steady-state operation, while the latter figure captures the shutdown behaviour. As can be seen clearly, the maximum acceleration response of the structure during startup and shutdown is significantly greater than the operating or steady-state response. Furthermore, the peak response of the structure is greater during shutdown than during startup. The focus of the present paper is to characterise fully the response of a single-degree-of-freedom structure subjected to both machine startup and shutdown.
Previous work by Elvin and Elvin (2012) introduced the problem of startup dynamics and presented some preliminary results for the response of simple, typical one-degree-of-freedom structures supporting rotating machinery subjected only to startup conditions. This paper considers the generalised response of any multi-degree-of-freedom structure subjected to startup and shutdown over a range of damping coefficients, and abstracts this information into normalised curves.
The present paper is organised as follows. First the governing equations of structural dynamics are presented. This includes estimating the unbalanced rotating force function and the resulting magnitude of the structure's response. Next the effect of machine startup and shutdown is quantified, and normalised response graphs presented. The slope of the ramp startup and shutdown for various damping ratios is studied. The paper is concluded with two analysis examples that illustrate the importance of considering startup dynamics when designing low-tuned support structures under rotating machinery.
STRUCTURAL DYNAMICS BACKGROUND
[Note: This background section is included for completeness and ease of reading. The advanced reader might want to skip to the end of this section where the machine startup and shutdown characteristics are introduced.] Any structural dynamic analysis requires an estimation of the natural frequencies, the damping of the structure and the loading amplitude and frequency on the structure.
The natural frequencies of the structure can be estimated either through the use of lookup tables (see for example Arya et al 1979 and Blevins 1979) or through the use of more refined computational methods (typically matrix or finite element methods) (Weaver & Johnston 1987). The damping of the structure is estimated either from previously measured results of similar structures or from design databases (Regulatory Guide 2007). The loading amplitude and frequency of the machine on the structure should be provided by the manufacturer of the machine.
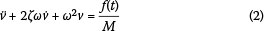
Whichever method is used, the fundamental ordinary differential equations that have to be solved are of the form:

where M is the equivalent mass of the system, C is the damping, K is the equivalent stiffness, f(t) is the applied loading as a function of time t, v is the displacement of the structure and t is time. The over-dots indicate derivatives with respect to time. It should be noted that in this paper we consider only a single-degree-of-freedom approximation to the natural frequency of the structure. This is an adequate approximation provided that the natural frequencies of the structure are not closely spaced. A full explanation of this approximation can be found in any standard structural dynamics text such as Chopra (1995).
Equation (1) can be rewritten in the form:
where ω is the radial resonant frequency of the structure, and ζ is the damping coefficient, given by:
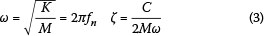
Here fnis the natural frequency of the structure (in Hz).
The displacement of the structure is found from solving either Equation (1) or Equation (2), from which the forces and thus stresses can then be calculated.
Estimating the unbalanced rotating force f(t)
Given a rotating machine schematically shown in Figure 2, the loading due to the rotation is well known (Tse et al (1963) and is given by:
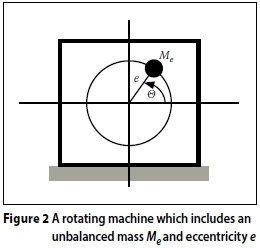

where Me is the unbalanced mass, e is the eccentricity of the mass from the machines rotational center and Ω is the rotating frequency of the machine (in radians/second). The magnitude of the steady-state solution (i.e. long-term solution) to Equation (2) under this harmonic loading can then be calculated using standard techniques (Chopra 1995) and is shown in Figure 2.
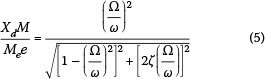
Note here that the steady-state displacement amplitude Xd in Equation (5) has been normalised and can be plotted for various driving frequency ratios  and damping coefficients (ζ) as shown in Figure 3. Resonance can clearly be seen when the natural frequency approximately matches the machine's operating frequency, i.e.
  .
.
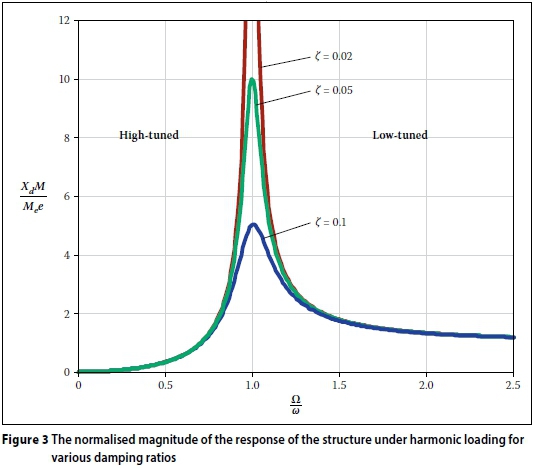
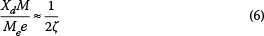
Note that in the case of resonance, i.e.  (Chopra 1995):
For the rotating machine shown in Figure 2, the position [x, y] of the eccentric mass is given by:

Here Θ is the angle of the eccentric mass to the horizontal at any time t and is given by:
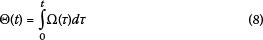
where τ is a dummy time variable.
The unbalanced forces are then given by:

with
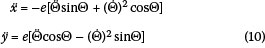
Note that for the constant angular velocity case (Ω = Ω c) Equation (10) reduces tα:
which is equivalent to the loading given in Equation (4).
Let us now consider the linear startup and shutdown angular velocity profiles shown in Figure 4.
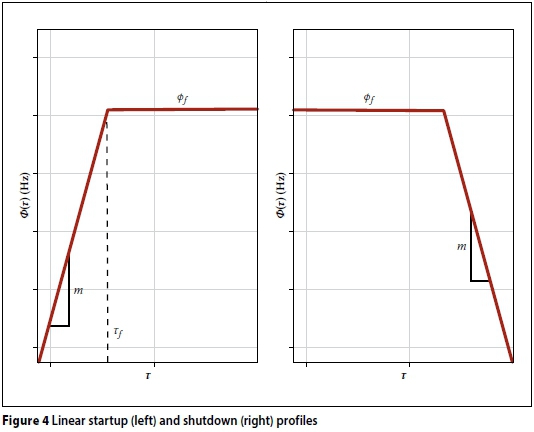
The linear startup and shutdown rotational speed profiles in Hertz, Φ , are approximations of the startup dynamics of typical machinery (Wach 2011). The method derived in this paper, however, can be used for any general startup profile.
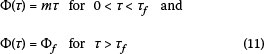
The linear startup profile is analytically given by:
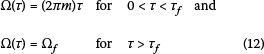
This can also be written in terms of machine radial frequency (Ω) in rads/sec as:
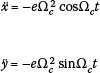
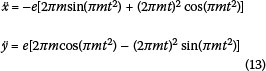
For the sloping portion, the acceleration components of the eccentric mass are given by:
EFFECT OF MACHINE STARTUP AND SHUTDOWN
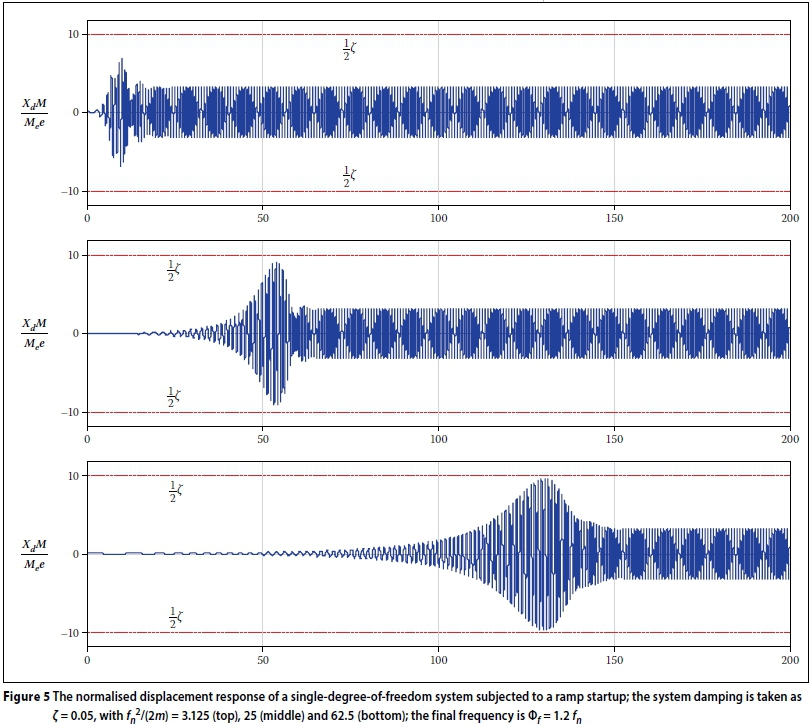
To obtain the response, Equation (2) is solved numerically subjected to the forces from Equation (9) and the accelerations from Equation (13). A Runge-Kutta method (code45 in Matlab®) was used to solve these equations. Figure 5 shows the normalised time history for a single-degree-of-freedom system with three different ramp-up speeds (m) corresponding to slow, medium and fast. The time history is normalised by the natural period Tn of the system; the natural period is given  Note that, as the linear ramp slope decreases (bottom plot in Figure 5), the maximum response of the system approaches the resonant response of the system, i.e.
 .
.
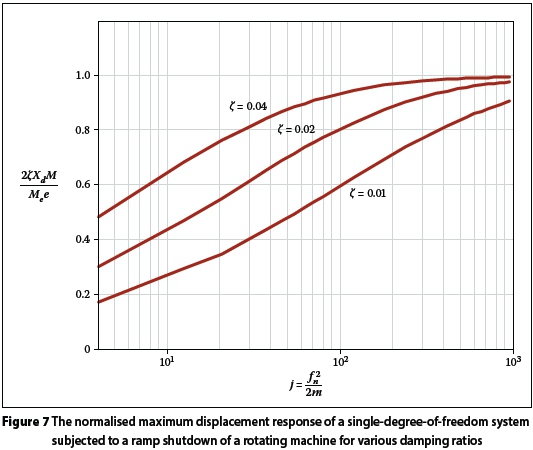
The shutdown case is analogous to the startup case but with modified Equations (11) to (13). For brevity these equations are not presented here.
Note that for a linear ramp startup profile, the number of cycles to reach the resonant frequency (fn) of the single degree of freedom system is given by  This number of cycles, j, will be used as a non-dimensional normalisation parameter.
In order to normalise further the maximum displacement response, an updated parameter which takes into account the damping ratio is proposed:

Note that now the normalised maximum harmonic response when the single-degree-of-freedom system is in resonance is:

The normalised maximum displacement responses for various damping ratios are plotted in Figure 6 for the case of machine startup, and in Figure 7 for the case of machine shutdown.
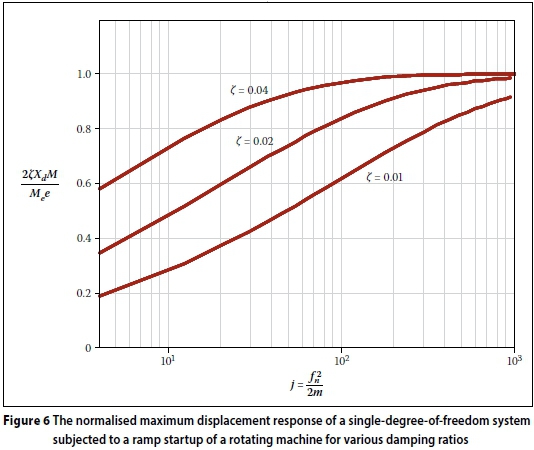
Note that, as the number of cycles j taken to reach the structure's resonance increases (i.e. ramp speed decreases), the normalised displacement response approaches unity, i.e.  . The smaller the damping the more cycles are required to reach resonance. Thus, increasing the damping of the system has two effects. First, as expected, the maximum response is decreased. Second, for a given startup/shutdown profile, the structure approaches resonance amplitude at a faster rate. Consider the case when the ramp-up speed increases, i.e. as j becomes smaller. The difference in the actual response, i.e.
  for the high and for the low damping ratio casesare highly dependent on the ramp speeds. A numerical example will clarify this point:at faster speeds where
  when ζ = 0.04 and
  when ζ = 0.01,while at very low startup speeds, i.e. when
 for ζ = 0.04 and
  for ζ = 0.01. This illustrates that increasing the damping in a structure will reduce the overall dynamic maximum response, but at the same time the response will be strongly ramp-up speed dependent.
COMPARISON OF RAMP STARTUP WITH SYSTEM AT RESONANCE
Consider the transient response of a structure subjected to a rotating machine operating at a constant frequency equal to the resonant frequency of the structure (assume the motor reaches its operating frequency instantaneously). If the structure is assumed to be initially at rest, the time history response of the structure is shown in Figure 8. The envelope of the maximal response (blue lines in Figure 8) is well known and is given by Chopra (1995). Normalising this envelope produces:
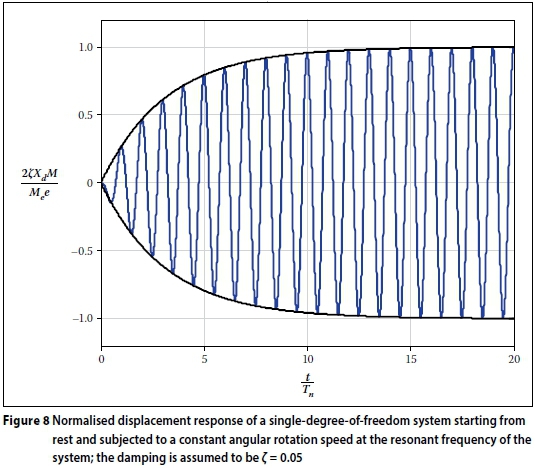
where  is the number of cycles towhich the system is subjected. Note that, as expected, the normalised response approaches unity as jnincreases.
Figure 9 shows the normalised maximal response of the linear startup profile (blue curves) and the maximal response of the structure subjected to a machine operating at resonance (green curves) after jn cycles. Please note that for the machine operating at resonance the maximal response is given at jn cycles, while for the linear ramp startup profile, the maximal response can occur when the machine has passed through resonance. Thus the definitions of the number of cycles to resonance are different in the two cases. In the resonant condition, j = jn is the actual number of cycles the machine has made, while for the linear startup profile

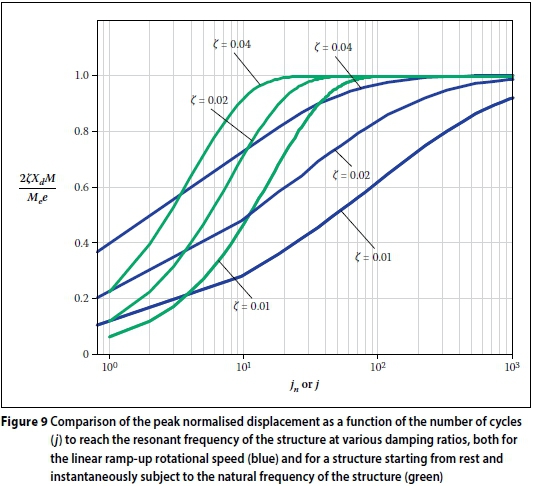
As can be seen in Figure 9, at fast ramp-up speeds (i.e. low j), the maximal response to the linear machine startup exceeds the startup response of the structure at resonance. At a higher number of cycles, the resonant condition reaches maximal response much sooner than for the ramp profile. During fast ramp-up speeds, the actual maximal response occurs after the machine has passed through resonance. It is important to note that startup and shutdown amplitudes do not exceed the fully developed resonance amplitudes. Many designers, as a simplifying assumption, check the structure's response at fully developed resonance.
As expected, Figure 9 clearly shows that for slower ramp speeds (i.e. higher j), the maximal response approaches the theoretical resonance value, i.e.  It is interesting to note that even for very rapid ramp up speeds (low j) there can be a significant maximal response. For example, for the fastest ramp up speed shown in Figure 9, and assuming a 2% damping ratio, the maximal 0.2 response is still approximately
  , which is significantly greater than the expected normalised value of approximately 1 for a machine designed for low-tuned operation in Figure 3. Typically a low-tuned structure would be designed with a low enough natural frequency so that
  , i.e. the structure's frequency is well away from the operating frequency of the motor. However, Figure 9 shows that increasing motor ramp-up speed can still lead to significant transient effects greater than resonance startup response and should thus not be neglected during the design of the structure.
A very rough estimate of the maximal response during startup dynamics can be made by using the analytical expression for the response of a single-degree-of-freedom structure subjected to a constant harmonic loading at the resonance of the structure. In this case the normalised response can be estimated from Equation (14) to be:
The full resonance response is given in Figure 9 for values on the vertical axis equal to 1.0. Thus, as the number of cycles at resonance jn increases, the response given by  tends to 1.0, i.e. full resonance.
EXAMPLES
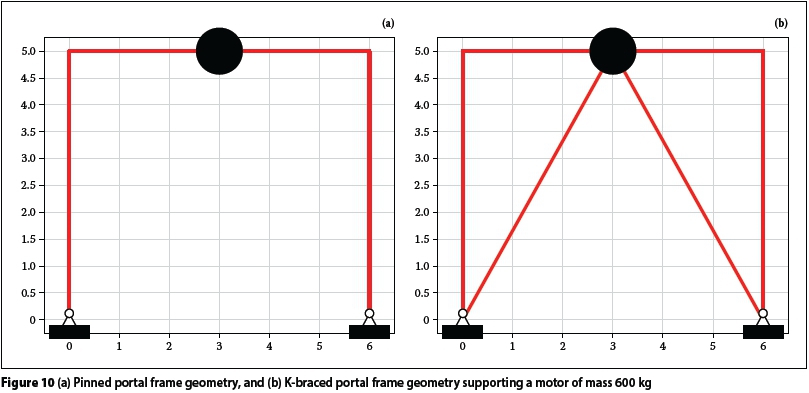
The use of the graphs in Figure 6 will be demonstrated via an example of a pinned steel portal frame shown in Figure 10(a) that supports a machine of mass 600 kg rotating at 1 800 rpm (i.e. 30 Hz). An initial modal analysis, with parameters shown in Table 1, has been performed and yields a first natural frequency of 4.20 Hz, with the first vibration mode shape shown in Figure 11(a). The structure is thus low-tuned. The connections in the structure are a combination of welded and bolted joints; a 2% damping ratio for the first two modes is assumed. As is common in dynamic analysis, Rayleigh (also known as proportional) damping is assumed for the structure.

Two types of analyses are performed on the structure, the first being a simple one-degree-of-freedom analysis, and the second a full transient matrix method analysis. The results are then compared.
One-degree-of-freedom approximation
The one-degree-of-freedom analysis can be performed by estimating (a) the lateral stiffness of the structure (K), and (b) the vibrating mass (M). The estimation of the stiffness can be performed in a number of ways. For example, using the simplified analysis approximation of Silva and Badie (2008) of a pinned rectangular portal frame, the lateral stiffness is given by:
where E is the elastic modulus, I is the second moment of area and L is length. The subscripts b and c correspond to the beam and column respectively.
The stiffness of the structure in the lateral direction can also be calculated using the stiffness method and performing a static analysis with a unit load applied in the lateral direction at the position of the motor; after finding the lateral deflection (Δ), the static stiffness (K) is given by 
The dynamic stiffness can be found by extracting the first natural frequency of the structure solving the eigenvalue problem as performed in Figure 11(a). The dynamic stiffness can then be found using Equation (3).
For a pinned portal frame, the vibrating mass can be estimated as the sum of the motor mass, the beam mass, and 50% of the mass of each of the columns.
The three different approaches yield similar results. The equivalent one-degree-of-freedom stiffness of the structure is approximately K ≈ 770 kN/m. The effective mass is approximately M ≈ 1 130 kg. By Equation (3) the first natural mode is then fn ≈ 4.15 Hz, which is only 1% different to the natural frequency found from the eigenvalue analysis.
For the startup speed given in Table 1,  cycles; for a damping ratio of ζ = 0.02, the normalised response from Figure 6 is:
 . This corresponds to a maximum lateral deflection of Xd = 0.0625 m. It should be noted that if startup dynamics were not considered, the maximum steady-state deflection under the dynamic load would correspond to Xd,ss = 0.0055 m as can be found from Equation (5).
Thus, considering only the steady-state response would under-predict the deflection during startup by a factor of 11.4.
The conservative practice of calculating the full resonance response instead of the actual startup  would lead to an over-prediction of approximately twice the transient response
Full transient analysis
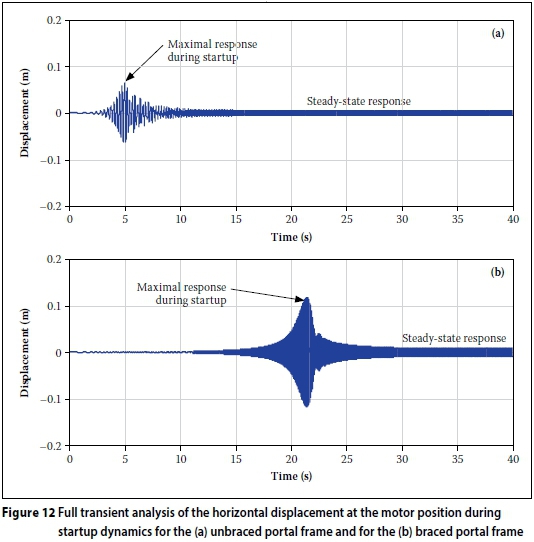
The full transient analysis of the portal frame is performed using standard beam elements and assuming an applied load given by Equations (9) and (13) in the centre of the beam. The full transient and steady-state response for the horizontal deflection at the motor is shown in Figure 12(a). The peak deflection and steady-state amplitude are simulated to be Xd = 0.0639 m and Xd,ss = 0.0055 m. These results are at most 2.2% different when compared to the one-degree-of-freedom analysis. The accuracy of the results versus the simplicity of the one-degree-of-freedom analysis must be noted.
Bracing the portal frame
In order to limit the maximal deflection during startup and steady-state operation, a design engineer might be tempted to introduce K-bracing into the structure as shown in Figure 10(b) with properties given in Table 1. The analysis would follow the same procedure as described for the unbraced frame above. The fundamental frequency in this case increases from 4.20 to 20.91 Hz. Note in this case 50% of each bracing element should be added to the effective mass of the structure.
The single-degree-of-freedom analysis using Figure 6 would give a maximum response of Xd = 0.1180 m and a steady-state response of Xd,ss = 0.0099 m. The full transient computer analysis solution shown in Figure 12(b) gives a maximum lateral deflection at the motor of Xd = 0.1175 m and a steady-state response of Xd,ss = 0.0097 m. The simplified approach presented in this paper gives an error of only 2%. The maximum startup response is now 12 times greater than the maximum steady-state amplitude.
One of the options a structural designer can use to limit deflections under dynamic loading is to stiffen the structure (in this example with K-bracing) (see for example Bachmann & Ammann 1987). However, in this case stiffening the structure increases both the steady-state and maximal startup deflections. The increase in the steady-state response of the structure is due to the fact that the resonance of the structure is now closer to the operating frequency than for the unbraced structure. The increase in maximal response during startup is due to the fact that  (i.e. the number of cycles to reach the resonant frequency of the structure) has also significantly increased (from 8.8 cycles for the unbraced case to 218.6 cycles for the braced case) which, from Figure 6, increases the normalised response, i.e.
  from 0.47 for the unbraced case to 0.93 for the braced case.
CONCLUSION
The effect of startup and shutdown on low-tuned structures subjected to rotating loads has been discussed in this paper over a relatively wide range of startup speeds and damping coefficients. The maximum deflection results have been normalised to produce generalised response curves. The curves can be used in simplified one-degree-of-freedom analyses to predict accurately these maximum deflections, thus obviating the necessity to perform computationally intensive transient analyses.
Assuming the same ramp slope, the responses of the structure to startup versus shutdown are similar but not exactly the same, as can be seen from the normalised graphs (Figures 6 versus 7). Ignoring the transient response during machine startup/ shutdown can greatly under-predict the dynamic response of low-tuned structures, even though the logic behind ignoring the transient response is that the structure is only subject to resonant-frequency forcing load for a short duration. On the other hand, this paper has shown that the conservative practice of assuming full resonant behaviour in lieu of the actual transient response can significantly over-predict maximum displacements, and hence stresses. The transient response is a function of both the motor ramp-up (or -down) speeds, as well as the damping of the structure. In general both increasing the damping and increasing the ramp-up speed decrease the transient deflections. However, damping has a significantly greater effect in limiting the overall structural response at slower speeds than at faster ramp-up speeds.
A rough estimate of the maximal transient response of the system during startup has been derived in this paper (Equation (15)). This estimate was shown to underestimate the maximum transient response during startup for fast ramp-up speeds, and to overestimate the response for slow ramp-up speeds (Figure 9).
It must be emphasised that the deflection during startup/shutdown can be significantly greater than the steady-state response, and thus cannot be ignored. This point has been illustrated by two example problems which analysed an unbraced and braced low-tuned portal frame subjected to loading from an unbalanced rotating machine. The results show that the transient deflection can be an order of magnitude greater than the steady-state response. Bracing the portal structure significantly stiffens the structure and increases its natural frequency. However, both the maximum steady-state and transient deflections also increased. The steady-state response increased since the braced structure's resonant frequency was closer to the operating frequency of the machine. The maximal startup deflection increased since the structure took more cycles to reach its resonance. One potential method of decreasing the deflection during startup is to high-tune the structure but this might require a very stiff structure, which might not be practical or economical.
Future work will concentrate on experimental validation of the results presented in this paper. Different startup and shutdown profiles should also be investigated. The effect of startup and shutdown transients should be studied in the case when the operating frequency of the rotating machine is greater than higher structural resonances.
ACKNOWLEDGEMENTS
The authors would like to thank the Southern African Institute of Steel Construction for funding this work. Matomo (Pty) Ltd is also thanked for allowing the use of their acceleration data.
REFERENCES
Arya, S C, O'Neill, M W & Pincus, G 1979. Design of Structures and Foundations for Vibrating Machines. Houston, TX, US: Gulf Publishing Co. [ Links ]
Bachmann, H & Ammann, W J 1987. Vibrations in structures - Induced by man and machines. Structural Engineering Documents, Vol 3e, Zürich: International Association of Bridge and Structural Engineering (IABSE). [ Links ]
Blevins, R D 1979. Formulas for Natural Frequency and Mode Shape. New York: Van Nostrand Reinhold. [ Links ]
Chopra, A K 1995. Dynamics of Structures: Theory and Applications to Earthquake Engineering. Englewood Cliffs, NJ, US: Prentice Hall. [ Links ]
Elvin, A & Elvin, N 2012. Structural response to startup of rotating machinery. Proceedings, Conference on Structures for Mining and Related Materials Handling, SMMH2012, hosted by the SAISC, Section 6.3.2, pp 105-114. [ Links ]
Regulatory Guide 1.61: Damping Values for Seismic Design of Nuclear Power Plants. 2007. US Nuclear Regulatory Commission, March. [ Links ]
Silva, P & Badie, S 2008. Optimum beam-to-column stiffness ratio of portal frames under lateral loads. Available at: http://www.structuremag.org/article.aspx?articleID=736#ArticlePDF [ Links ]
Tse, F S, Morse I E & Hinkle R T 1963. Mechanical Vibrations. Englewood Cliffs, NJ, US: Prentice-Hall. [ Links ]
Wach, P 2011. Dynamics and Control of Electrical Drives. Berlin: Springer-Verlag. [ Links ]
Weaver, W & Johnston, R P 1987. Structural Dynamics by Finite Elements. Harlow, UK: Prentice-Hall International Series in Civil Engineering and Engineering Mechanics. [ Links ]
 Correspondence:
Prof Alex A Elvin
School of Civil and Environmental Engineering
University of the Witwatersrand
Johannesburg
South Africa
T: +27 (0)11 717 7145
E: alex.elvin@wits.ac.za
Prof Niell G Elvin
Department of Mechanical Engineering City College of New York
Steinman Hall T-228
New York
NY, 10031 USA
T: +1 212 650 8468
E: elvin@me.ccny.cuny.edu

PROF ALEX A ELVIN Pr Eng, Member SAICE, graduated as a civil engineer from the University of the Witwatersrand in 1989. Working on non-destructive evaluation of concrete bridges he completed his Masters in 1991 at the Massachusetts Institute of Technology (MIT), and in 1996 obtained his PhD from MIT in numerical modelling offracture of brittle high-temperature materials. He worked in industry and taught several classes at MIT. From 1998 to 2002 he was a junior faculty member at Harvard Medical School doing finite element analysis of implants. He was promoted first to associate (2007) and then to full professor (2010) in structural mechanics at the University of the Witwatersrand. His research interests are focused on theoretical modelling (i.e. numerical modelling), finite element analysis, loading, dynamic simulations, behaviour of structures, instrumentation and sensor networks in engineering, as well as health monitoring of structures.

PROF NIELL G ELVIN graduated as a civil engineer from the University of the Witwatersrand in 1993. He obtained dual Master's degrees from the Civil and Aeronautical-Astronautical Departments, Massachusetts Institute of Technology (MIT) in 1995. Working on light fibre sensors and non-destructive evaluation he completed his PhD in 1998 at MIT. He was a post-doctoral fellow at Harvard Medical School and also worked in industry on SMART materials and structures. In 2005 he joined the engineering faculty at Michigan State University as an assistant professor where he lectured structural mechanics and dynamics of structures. In 2008 he moved to City College New York as an associate professor. His research interests include dynamic modelling, material behaviour, instrumentation and SMART materials.

