


Servicios Personalizados
Articulo
 Inglés (pdf)
 Articulo en XML
 Referencias del artículo
Indicadores

Links relacionados
-
 Citado por Google
 -
 Similares en Google
Compartir

 Permalink
Journal of the South African Institution of Civil Engineering
versión On-line ISSN 2309-8775
versión impresa ISSN 1021-2019
J. S. Afr. Inst. Civ. Eng. vol.57 no.1 Midrand ene./mar. 2015
http://dx.doi.org/10.17159/2309-8775/2015/v57n1a1
TECHNICAL PAPER
Capacity self-assessment as a catalyst for improved municipal service delivery
S M van Baalen; C S L Schutte; K von Leipzig
ABSTRACT
This research paper illustrates that accurate and truthful capacity assessments are a fundamental phase of any capacity building process, and that capacity assessments play a fundamental role in reaching the necessary performance efficiency. Service delivery performance enhancements by municipalities are becoming increasingly necessary. At the same time, however, the majority of municipalities in South Africa find themselves under-capacitated. Some municipalities are aware of the lack of capacity within their organisation, but are unable to identify, define and quantify these shortcomings. Many other municipalities are not aware of their capacity shortfalls. In both cases, this is often caused by the lack of necessary systems and procedures to assess the different dimensions of organisational capacity. In this regard, this research paper introduces a proposed Subjective Municipal Capacity Self-Assessment Model (SMCSAM) as an alternative solution to the current practices of the Municipal Demarcation Board. It is intended that this model be used internally by municipalities to sustain internal capacity building and performance enhancement initiatives.
Keywords: municipality, capacity, performance, self-assessment, basic services
BACKGROUND
The enactment of the new Constitution of South Africa, 1996, gave prominence to the transformation of local government in South Africa. Rooted in the Constitution, the Municipal Systems Act of 2000 and the Municipal Structures Act of 1998 guide municipalities towards establishing structured performance management practices. As part of a comprehensive legislative framework for local government, these acts moreover state the functions of municipalities, which include the delivery of basic municipal services. These services include, amongst others, water provision, refuse removal, sanitation, electricity provision, municipal roads and stormwater management.
Despite a range of statutory provisions, policy instruments and capacity improvement initiatives with a view to provide a democratic, participative, responsive, effective and efficient local sphere of government, South African municipalities, in general, continue to fail in eradicating service delivery backlogs. Some of these are, at least partially, the result of the policies and practices of the apartheid era. Apart from eradicating backlogs, non-sustaining service delivery to communities has become a noticeable phenomenon. As a result the highest number of service delivery protests over the past decade occurred in 2012 (Heese 2012).
INTRODUCTION
Regardless of the provisions made in the Constitution and a battery of policy measures for local government, which have been adopted with a view to provide more efficient and effective government at local level, significant service delivery backlogs remain in South Africa (Siddle & Koelble 2012). The 2011 South African Census indicated that, despite a slight decrease in service delivery backlogs over the previous five years, many South African households had not yet received all six basic municipal services. Table 1 illustrates backlogs regarding water provision, sanitation services, electricity provision and refuse removal services. While backlogs regarding municipal roads and stormwater management are not quantified per number of households, these backlogs are also significant (Statistics South Africa 2012).
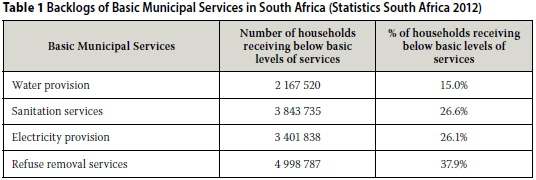
The inability of South African municipalities to eradicate the longstanding basic service delivery backlogs, as shown in Table 1, are often used as measure for municipal underperformance. As a consequence of municipal underperformance, frequent service delivery protests occur in South Africa. In recent years, service delivery has been typified by violent and mass protests, demonstrations and petitions. Responses by communities resorting to protests have become a characteristic feature of citizens' response when municipalities fail to show reaction to community needs (Heese 2012). Useful insight can be gathered from the vast number of protests which have occurred in South Africa since 2004 (Afesis-Corplan 2011). By 2012, the number of annual service delivery protests of the past decade reached a new peak. As a result, municipalities now are more pressurised to react to basic service delivery backlogs.
In an attempt to overcome service delivery challenges, a lack of individual capacity has been identified as a key cause of municipal underperformance (Lawless 2007; Macleod 2007). Palmer Development Group, in a Municipal Demarcation Board (MDB) review, also identifies the importance of leadership within the political and administrative structures of municipalities (MDB 2010). The relationship between municipal performance, organisational capacity and leadership, as shown in Figure 1, should be considered. It should be noted that, according to the United Nations Development Programme (UNDP 2010), organisational capacity consists of three dimensions, i.e. individual, institutional and environmental capacity.
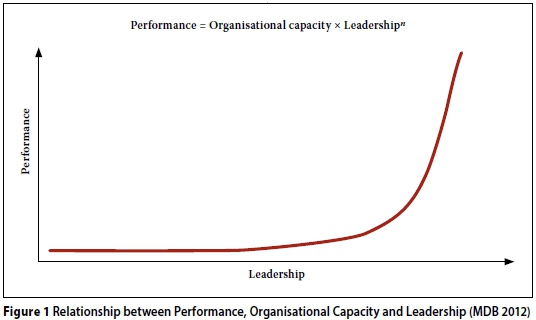
It should be noted that the n in Figure 1 denotes effectiveness. It is intended that the organisational capacity of municipalities be used as an input to a service delivery process which commences with the mandate of municipalities. Based on its mandate, municipalities are obliged to compile particular strategic plans, including an Integrated Development Plan (IDP) and a Service Delivery and Budget Implementation Plan (SDBIP). According to Lawless (2007), the phases of the service delivery process include the allocation of resources, the fulfilment of municipal engineering functions, and the achievement of predetermined service delivery outputs, outcomes and specifically desired impacts. These engineering functions include planning, designing, documenting, financing, construction, operations and maintenance of infrastructure.
Effective fulfilment of these engineering functions requires the necessary allocation of resources, and results in the fulfilment of municipalities' service delivery mandates. It can therefore be said that municipalities need to sustain a minimum level of organisational capacity in order to maintain the necessary service delivery performance. Lawless (2007) states that, as a result of the transformation of local government in South Africa, municipalities today typically employ less engineering staff than a decade ago, and outsource many of the engineering functions to external service providers. The Municipal Systems Act of 2000 allows for such outsourcing in Section 58.
Lawless (2007) further alludes that, apart from the result of this change in resource utilisation, municipalities have not sustained a minimum level of internal engineering capacity. The following section reports on the downfalls of South African municipalities in terms of the fundamental dimension of organisational capacity, i.e. individual capacity, which includes the internal engineering and management personnel. Similar to the use of municipal service delivery backlogs used as a key performance indicator (KPI), this study uses municipal engineering resources as a key capacity area (KPA).
MUNICIPAL SERVICE DELIVERY CAPACITY AND PERFORMANCE
Municipal vacancies in South Africa
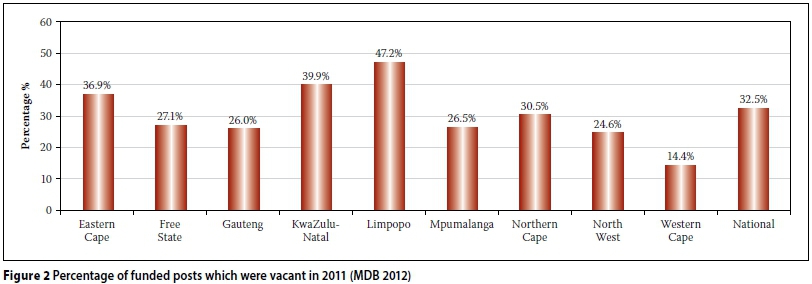
A large number of vacancies exist in local government. Nationally, with an estimated 28% vacancy rate, roughly one in every four posts was vacant in 2011 (MDB 2012). The highest vacancy levels are found in the Eastern Cape, KwaZulu-Natal and Limpopo, while the lowest vacancy levels are evident in the Western Cape, North West and Gauteng.
It should be noted that, as a consequence of inadequate budgeting, amongst others, municipalities are commonly not able to fund posts. Nevertheless, even of the funded posts, 32.5% remain vacant on average across all municipalities in South Africa. According to MDB (2012), this phenomenon typically results from municipalities' incapability to attract and employ suitable and competent personnel. This is especially the case for municipalities situated in rural areas and previous Bantustans (MDB 2012).
According to Lawless (2007), the number of vacancies, as shown in Figure 2, are dominating municipal capacity challenges as human resources are one of the most fundamental capacity requirements. For municipalities in Limpopo, KwaZulu-Natal and the Eastern Cape particularly, high vacancy rates create huge concern, as backlogs in terms of basic municipal services are high in these regions and need adequate municipal capacity for their eradication.
Municipal management resources in South Africa
Leadership and the quality of decisions made by a municipality's management team are essential prerequisites for municipal performance. Relating to this, Lawless (2007) suggests that, apart from high vacancy levels, a lack of strategic leadership and especially poor management practices have significantly hampered municipal service delivery in recent years.
It can be assumed that leadership, as referred to above, is interconnected with municipalities' management practices, and that not all managers fulfil the leadership responsibilities often associated with management. By ignoring the particular relation between leadership and management, but acknowledging the existence thereof, management capabilities of existing municipal managers can be used as a measure for the management and leadership practices found at municipalities.
The following sections will in turn consider the level of academic qualification and the relevant work experience of senior municipal managers, as measures of their leadership and management capabilities. Surely, the management and leadership capabilities of Technical Services Managers are of significant importance, as the person in this position typically administers all municipal service delivery processes in a municipality. Yet, considering the complete service delivery process as illustrated in Figure 3, the management and leadership practices of other functional managers can affect the success of the technical department's efforts to deliver actual services to the community.
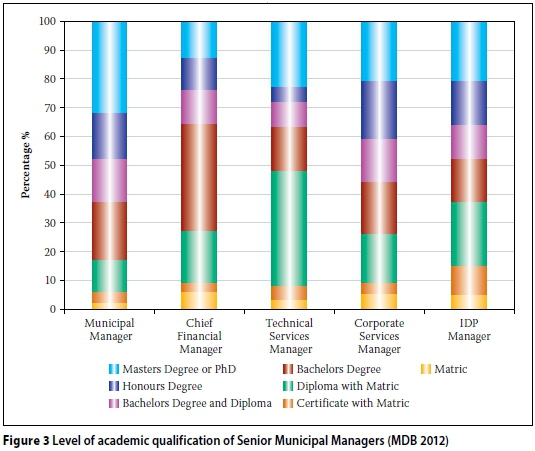
In the context of the increased focus on the skills, competencies and experience of senior managers, an analysis of the data collected from the 2011 MDB Capacity Assessment provides useful insights to the status quo with respect to the academic qualifications and relevant work experience of senior municipal managers (MDB 2012). CoGTA (2012) recognises six key senior management positions within the municipal structure, namely municipal managers, chief financial officers, human resources managers and the directors of planning, engineering and corporate services. Figure 3 shows the average level of academic qualifications for five of these positions across all South African municipalities as recorded in 2012.
An analysis across all management posts suggests that municipal managers generally have higher levels of education, while a considerable percentage of Technical Services Managers hold accredited qualifications lower than a Bachelor's degree. As a result, across all types of managers shown in Figure 3, Technical Services Managers, on average, hold the smallest percentage of bachelor's degrees, bachelor's degrees with diplomas, and honours degrees.
Given the major backlogs in terms of basic municipal services, Technical Services Managers should ideally be qualified with sufficient technical qualifications (BEng degree in civil engineering), have relevant work experience, and be in a position for longer than five years as part of the required municipal performance-based contracts (MDB 2012). Relevant work experience is a crucial necessity for large and long-term infrastructure projects, as the stability of the management structures for capital projects is vital.
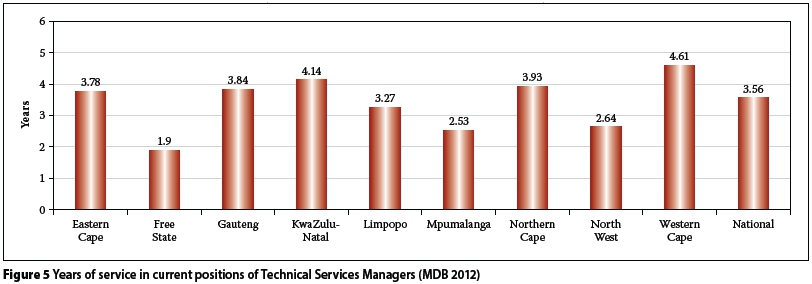
Figures 4 and 5 provide distinct overviews of the relevant work experience and years of service in the current position of the Technical Services Managers at municipalities in South Africa. Statistics are sorted according to the nine provinces in South Africa to further indicate possible regional-specific municipal strengths and weaknesses.
The analysis per province in Figure 4 shows that Technical Services Managers employed at municipalities in the Western Cape and Gauteng have the largest number of years of relevant experience. In contrast, experience levels are the lowest for municipalities in the Free State, North West, Limpopo and Mpumalanga.
Figure 5 illustrates trends that are comparable to earlier insights by showing that the number of years which Technical Services Managers remain in their existing positions is the highest in the Western Cape and the lowest in the Free State, Mpumalanga and North West. Evidently, the patterns with respect to relevant work experience and years of service in current positions of Technical Services Managers, are not ideal (MDB 2012).
Related to this drawback are the remaining municipal engineering resources which function under the management of the Technical Services Manager (MDB 2012). The next sections accordingly provide an impression of the engineering resources at municipalities in South Africa, as recorded in 2011. Reference is made to the organisation of engineering professionals, the current number of municipal engineering staff and the growth in this regard.
Number of engineering professionals in South Africa
Considering the number of technical staff, Lawless (2007) explains that the shortage of civil engineers in the municipal domain is regarded as one of the worst capacity tragedies in recent years. The annual MDB municipal capacity assessment is currently the only annual census of municipal engineering staff in South Africa. The following discussions are based on the 2010/2011 assessment, as this is the last assessment performed by the MDB.
The MDB, through its municipal capacity assessment of 2010/2011 recorded a total number of 4 295 engineering professionals of all types at municipalities of all categories. However, when collecting data on municipalities' engineering staff levels, PDG, who was contracted by the MDB to perform these assessments on behalf of the MDB, in the assessment did not distinguish between registered and non-registered technicians and technologists. So, a total number of 3 312 registered and non-registered technicians and technologists were recorded alongside 983 registered professional engineers.
Moreover, it cannot be assumed that the aforesaid technicians and technologists even hold the necessary qualifications or experience to be considered by ECSA (Engineering Council of South Africa) for registration as professionals. Vague definitions of these two categorise of engineering professionals by PDG in MDB (2012) include:
"...
■ Technologists: typically hold a BTech
degree, and
■ Technicians: typically hold an NDIP
diploma..."
Nevertheless, the following statistics illustrate worrying levels of municipal engineering capacity in South Africa. Grouped per municipal category, the number of each engineering professional category is illustrated in Figure 6.
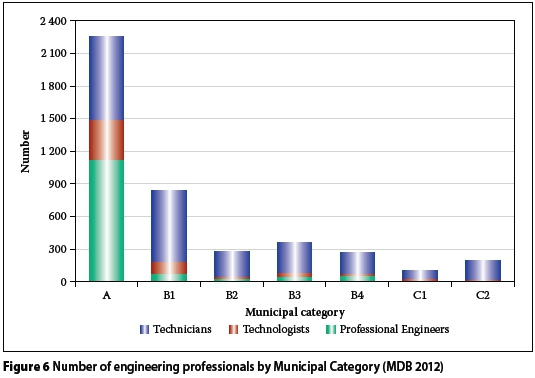
Figure 6 illustrates that the majority of engineering professionals are concentrated in the metropolitan municipalities. A mere 42 registered professional engineers are employed by 79 B3 municipalities, the number being even less in the remaining categories of municipalities. On average 0.53 engineers currently serve a B3 municipality. This shortage of engineering professionals puts strain on the remaining municipal categories. Figures 6 and 7 illustrate that, except in metropolitan municipalities, technicians form the largest group of engineering professionals in municipalities overall in South Africa.
The graph in Figure 7 indicates the average number of engineering professionals per 10 000 citizens for the same set of municipal categories as in Figure 6.
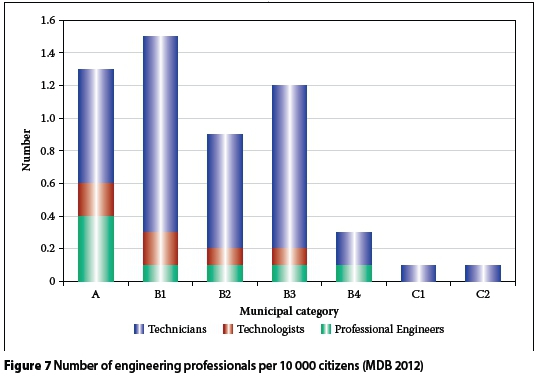
Figure 7 aids the understanding of the extent to which engineering resources are stretched, and therefore how well the consumers within communities are served. Evidently, metropolitan municipalities are generally better served by registered professional engineers, with an average of 0.44 engineers and a total of 1.37 engineering professionals per 10 000 citizens. B1 municipalities have 1.56 engineering professionals per 10 000 citizens, and are served mainly by technologists and technicians. Clearly, serious engineering constraints exist in B4, C1 and C2 municipalities (MDB 2012).
The low levels of municipal engineering capacity in South Africa must be viewed in the context of the current major basic service delivery backlogs. In the previous sections of this paper, it could be observed that a relation between these two aspects of municipal service delivery indeed exists. Disregarding leadership, as it is not easily quantifiable, the theory as shown in Figure 1 can therefore be assumed to be partially accurate.
A further and fundamental aspect to consider is the significance of updated, accurate and truthful quantitative and qualitative data regarding all three dimensions of organisational capacity. This data is typically obtained through thorough capacity assessments. In order to continually identify capacity deficiencies, it is important to frequently assess capacity. As illustrated through the use of the most updated capacity-related data in the preceding sections, current municipal capacity assessment practices in South Africa can be described as insufficient. Not only do the assessments by the MDB focus merely on individual capacity, but these assessments are incomprehensive and rely only on objective quantitative data.
The next section motivates why capacity building, including the phase of capacity assessment at municipalities, is fundamental to the improvement of basic municipal service delivery. It further signifies the importance of internal subjective municipal capacity assessments.
CAPACITY, CAPACITY ASSESSMENT AND CAPACITY BUILDING
The UNDP (2007) defines capacity assessment as an application for the generation of both quantitative and qualitative data of future and existing capacity needs in support of the development of capacity building strategies. UNDP (2005) recommends that, subject to the context of capacity challenges and accessible resources, capacity assessments should analyse one or more capacity dimensions, including the environmental, institutional and individual capacity of a municipality. Irrespective of the entry point, capacity assessments should constantly take account of the interrelatedness of capacity concerns between the targeted levels and the enabling environment.
The UNDP (2007) describes capacity assessment as an analysis of present capacities against desired future capacities. It therefore generates an understanding of present capacity strengths and weaknesses, and through this guides the formulation of capacity development strategies. The UNDP Capacity Assessment Framework (2007) advises the following three simple steps for the technical process of conducting a capacity assessment:
1. Define desired future capacities.
2. Define level of desired future capacities.
3. Assess existing capacity level.
It can therefore be understood that capacity assessments of municipalities are an integral task during capacity building initiatives. Based on the Kolb learning cycle, Martinelli and Schnupp (2013) suggest the following four-phase approach to capacity building:
1. Capacity Assessment: This step is largely concerned with the attainment of quantitative and qualitative data regarding the relevant strengths and weaknesses of the institutional framework at individual, institutional and environmental levels.
2. Strategic Planning: This step involves the planning of activities necessary to deliver the programme outcomes, i.e. costs, schedules, monitoring and evaluation arrangements, such as organisational mapping and the establishment of capacity baselines.
3. Implementation: This section sets out the important roles of the concerned partners in supporting capacity building processes, and highlights some examples of action at each of the three capacity levels which can contribute to effective capacity building.
4. Monitoring and Evaluation: This section focuses on the key principles to be followed in the monitoring and evaluation, and provides some examples of indicators which may be used to judge the effectiveness of the capacity building initiative.
5. By combining the four-phased approach of capacity building described earlier, Figure 8 shows a simplified capacity building process.

Evidently, it is important to complete Step 1A to Step 1C in Figure 8 as accurately as possible, as the ease in completing the following three steps (Steps 2 to 4) are based on the findings of Step 1. Considering that organisational capacity is defined as a multidimensional concept, comprising individual, institutional and environmental capacity, an assessment of organisational capacity can be complex and laborious. Typically, when an organisation is lacking in performance, the associated dimension of organisational capacity is assessed.
Ritchie and Dale (2000) allude to the fact that the mutual objective of self-assessment endeavours is the improvement of organisational processes based on opportunities identified by the assessment process. According to Ford and Evans (2002), therefore, self-assessment can be viewed as a catalyst for positive change and is attractive to managers seeking to operationalise a performance improvement philosophy in an organisation.
Challenges in performing these assessments include quantifying different levels of capacity and doing so as objectively as possible. In the context of municipal management in South Africa, it is furthermore important to recognise the need for the involvement of a monitoring body, such as an independent committee or task group.
The following sections report on an investigation of the use of internal non-monitored, subjective municipal capacity self-assessment as an alternative for the current best practices by the Municipal Demarcation Board. These sections moreover discuss the development and the validation of a proposed subjective municipal capacity self-assessment model (SMCSAM).
SUBJECTIVE MUNICIPAL CAPACITY SELF-ASSESSMENT MODEL
Understanding the concept of self-assessment
Self-assessment is a methodology for continual improvement which organisations develop either in the context of total quality management (TQM) or as an independent strategy. Organisations from the private sector (Bayazit & Karpak 2007) and the public sector (Fraser 2005) have used this methodology. Owing to the contemporary use of self-assessment, it can moreover be described as the holistic evaluation of organisational processes and performance using limited external assistance (Ford & Evans 2002).
Researchers and practitioners, specifically, provide varying definitions for self-assessment. Nuland et al (1999) define self-assessment as:
"... an analysis within an organisation in a structured and systematic way, after which a decision-making process regarding an action-plan takes place. The actions are prioritised and have a strategic importance. The realisation of these actions allows you to achieve a breakthrough in results."
Considering the above definitions and earlier insights, capacity self-assessment, in the context of capacity building and performance improvement, can be defined as an exercise performed internally, with the objective to identify key capacity strengths and weaknesses and formulate suitable capacity building strategies in order to achieve desired levels of performance. Whereas conventional performance self-assessments are based on criteria of quality awards, capacity self-assessments should also be based on a particular framework.
The process of self-assessment
Managing an assessment begins with understanding the motivation for conducting it. It is essential to know if the assessment is motivated from within or outside an organisation. Those engaged in the assessment therefore need to determine the following (Hakes 2007):
1. The central purpose of the assessment
2. The time and budget
3. The overall approach
4. How to communicate and use the information.
These matters are ideally included in written terms of reference that help clarify and communicate the intentions. The format of these terms will vary for an external assessment versus a self-assessment, but in either case it is beneficial to keep the assessment process and purpose of the product aligned. Stakeholder steering committees generally guide the assessment process, by clarifying stakeholders' interests, values and perspectives on frameworks, methodologies and sources of data, and engage in vetting of the preliminary findings, address political issues, and provide a forum for debate of preliminary reports (Hakes 2007).
Upon completion of steps 1-4, as shown above, the needed leadership commitment for using self-assessment as a tool to achieve organisational performance should be acquired. Hereafter the departments involved with conducting the self-assessment should be identified, a model for self-assessment must be designed and a reporting system must be established. This includes the selection of individuals to direct the self-assessment process, and design appropriate record forms and methods for scoring achievements (Hakes 2007).
The objectives, strategies and planning for conducting self-assessment should be communicated throughout the organisation. All facilitators and employees directly involved in the self-assessment processes should be trained. After conducting the self-assessment, action plans must be agreed on, showing priorities, responsibilities and milestones for actions. Improvement teams should be given the responsibility and the appropriate resources to implement actions according to the action plans and the strategic directions. Finally, the entire self-assessment process must be subject to regular reviews (Finn & Porter 1994).
Development of a Subjective Municipal Capacity Self-Assessment Model (SMCSAM)
An SMCSAM was developed in Visual Basic for Applications (VBA), an implementation of Microsoft's event-driven programming language, Visual Basic 6 and its associated integrated development environment (IDE). The SMCSAM includes the concept of Fuzzy Logic as a mathematical model to process users' input data. The SMCSAM uses a variety of methods to represent its outputs to support users in identifying capacity strengths and weaknesses.
The SMCSAM implements the matrix method to enable the self-assessment process. This method requires that the individuals who are taking part provide their perception of the current reality in the organisation by rating a set of statements derived from the structure of a chosen matrix which, in the case of the SMCSAM, is the consolidated municipal capacity assessment framework (of which a three-dimensional representation is shown in Figure 9).

As part of a self-assessment, these ratings must reflect the perceived truthfulness of the statements. As a result of the use of the matrix method as part of a self-assessment exercise, users' ratings are inevitably subjective whilst used as qualitative data. In this sense, the matrix method is easy to implement as it requires few resources and limited training of individuals. A practical feature of this approach is the chance to tailor the matrix according to the particular requirements of the organisation.
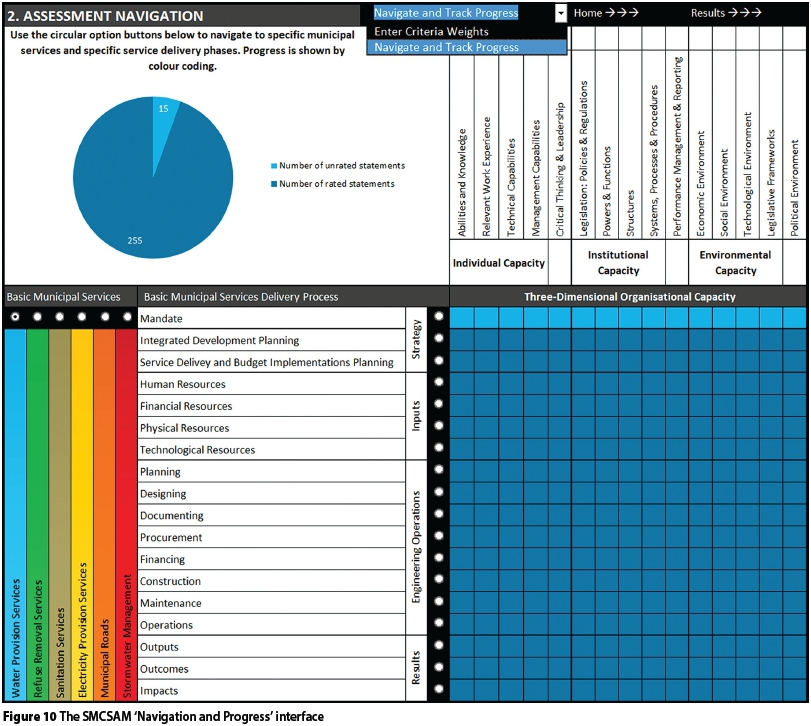
Based on the consolidated municipal capacity assessment framework, as shown in Figure 9, the SMCSAM uses two of the interfaces used to collect user inputs. Figure 10 shows the Navigation and Track progress interface (selected from the dropdown box at the top of the opening interface), by which users can navigate to specific sets of statements by clicking on a combination (basic municipal service and municipal service delivery phase) of radio buttons.
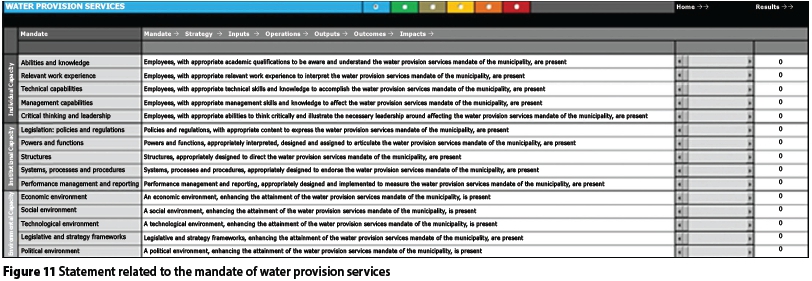
Figure 10 shows how Water Provision Services is selected, with the assessment matrix and pie chart colour-coded accordingly. Here, light blue represents statements which have not been rated yet. In order to navigate to an interface which holds these unrated statements, the user may simply click on the radio button allocated next to Mandate. This interface is shown in Figure 11. Rightfully, Figure 11 shows how no statements have been rated.
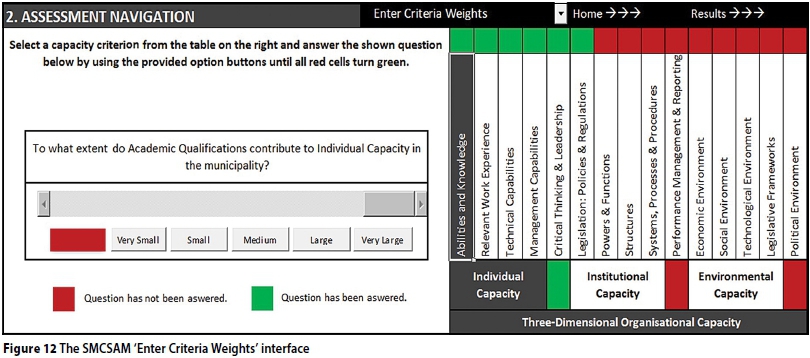
The user interface, as illustrated in Figure 12, is presented when the user selects Enter Criteria Weights from the dropdown box at the top of the opening interface, and is designed to display a unique question that is based on the user's selection in the matrix of capacity categories for assessment. The displayed question needs to be answered by clicking on the most appropriate perceived option button. These options range from very small, to small, medium, large and very large.
After the completion of this user-input exercise for each of the fifteen elements and three dimensions of organisational capacity, attained data is used in an automated Fuzzy AHP (Analytical Hierarchy Process). A typical Fuzzy AHP decision problem consists of (1) a number of alternatives, (2) a collection of evaluation criteria, (3) a linguistic judgement representing the relative importance of each criteria pair, and (4) a weighting vector.
PILOT STUDY: DRAKENSTEIN MUNICIPALITY (WESTERN CAPE)
Drakenstein Municipality was selected for the testing of the SMCSAM. According to its own annual report (2013) and CoGTA (2009), Drakenstein Municipality was identified as one of the highest performing municipalities in South Africa. It was assumed that it should therefore be able to provide at least a degree of data that would highlight strengths, while also showing weaknesses in certain areas.
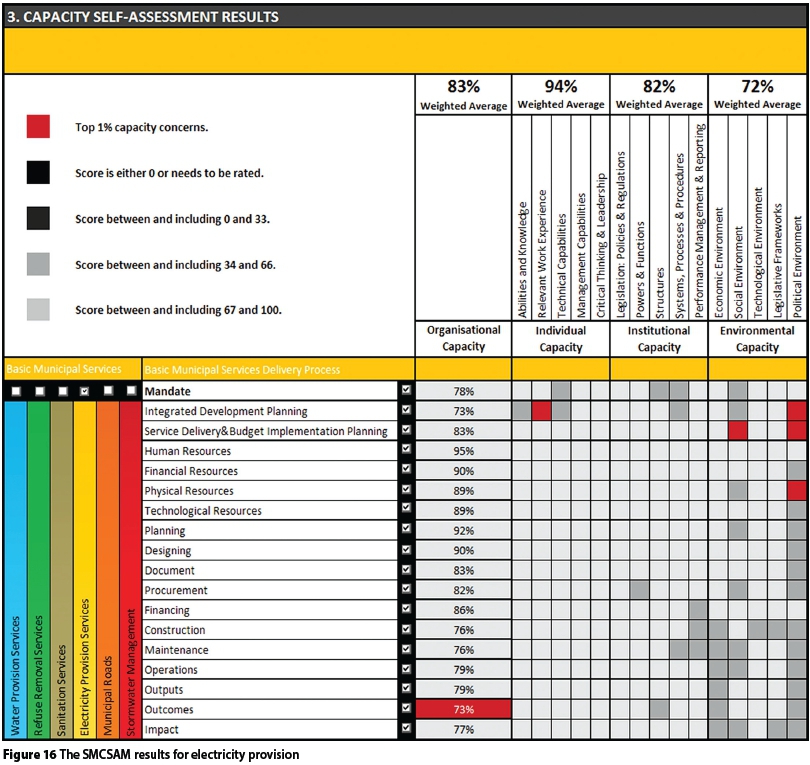
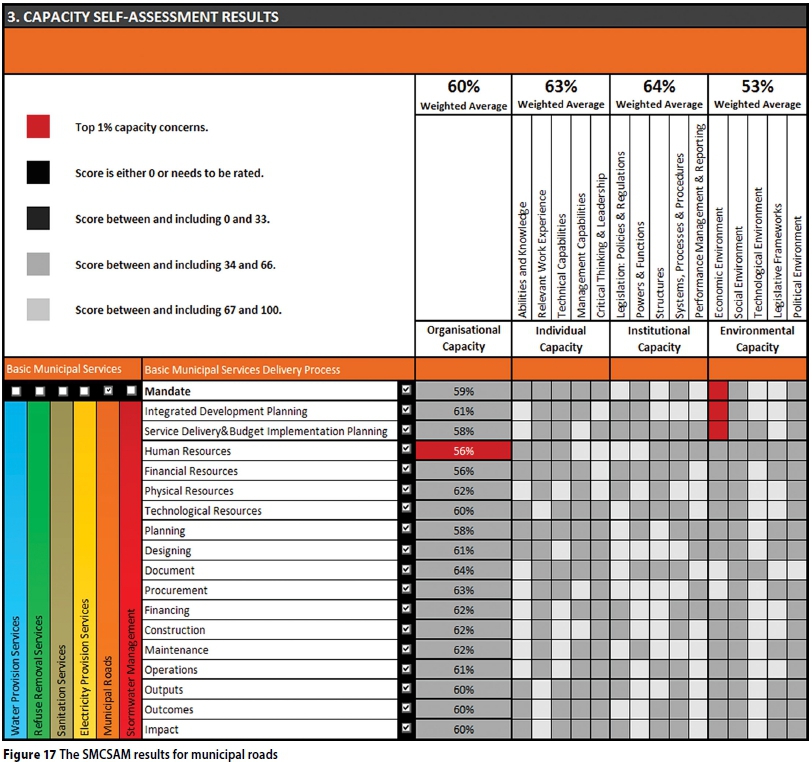
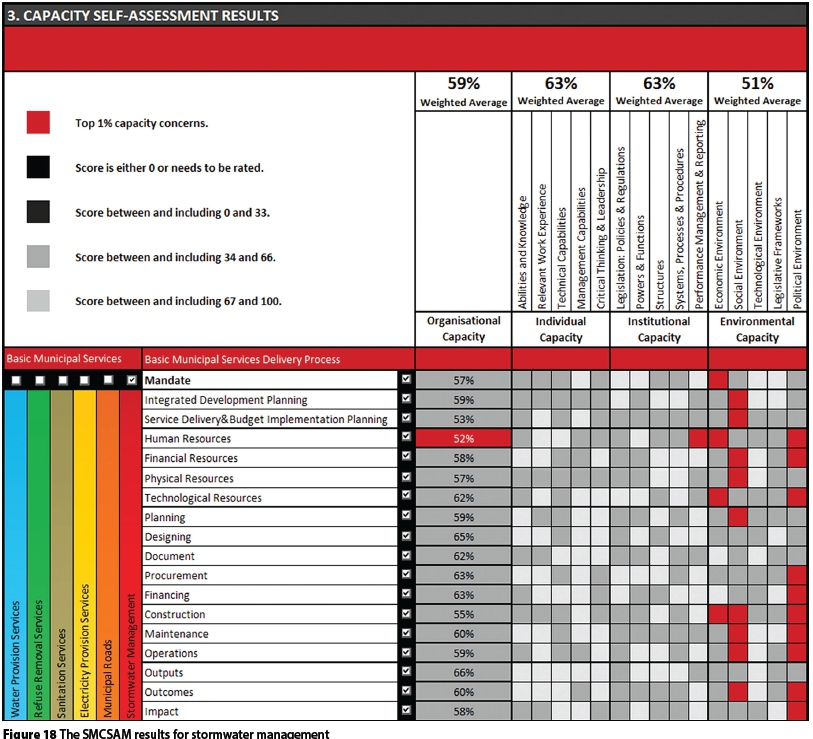
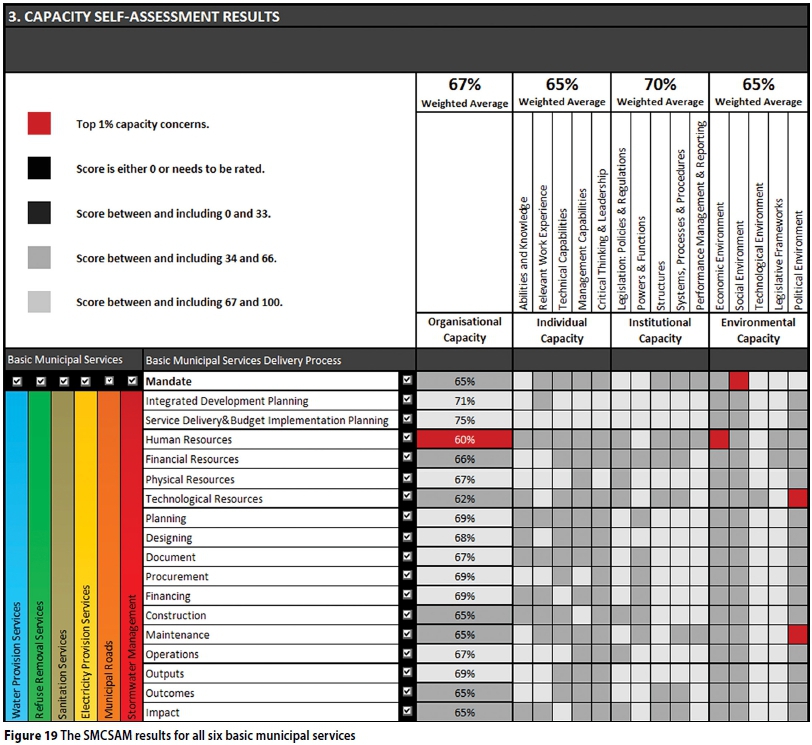
Figures 13-19 reflect the results of the self-assessment performed at Drakenstein Municipality, and do so by means of the fourth and final user-interface of the SMCSAM. This interface corresponds with the Navigation and Progress interface and enables the user to select and view the results for the desired combination of Basic Municipal Services and Service Delivery Processes.
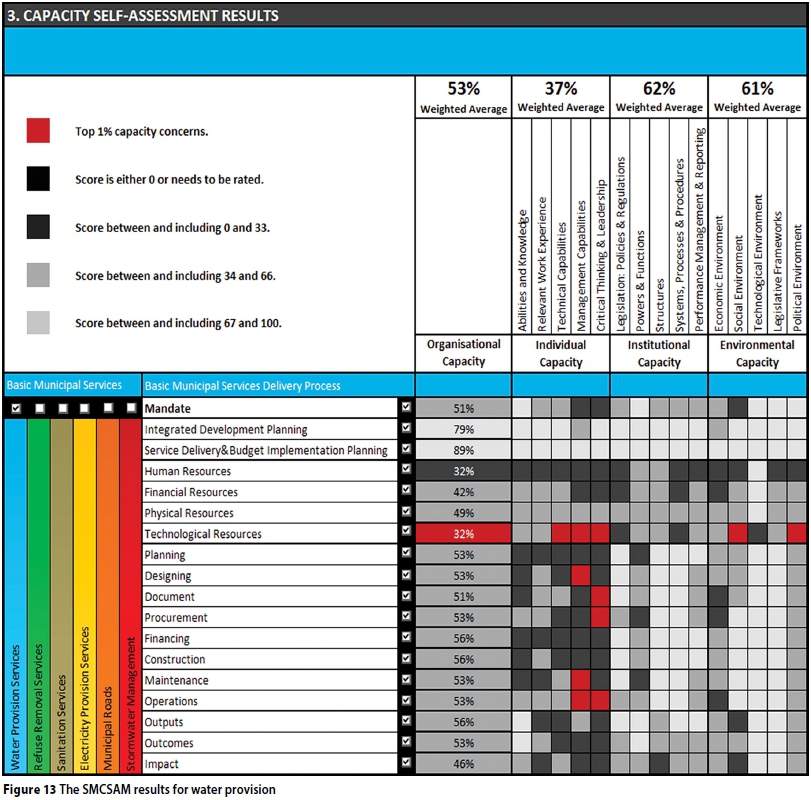
Figure 13 shows the results as generated by the SMCSAM for water provision. In terms of the various capacity dimensions, clearly, individual capacity achieved the lowest overall score with a weighted average of 37%. Environmental capacity achieved 61%, while institutional capacity achieved the highest score of 62%. With a weighted average of 53% for overall organisational capacity, it can be assumed that the validator believes the capacity of Drakenstein Municipality for water provision is worrying.
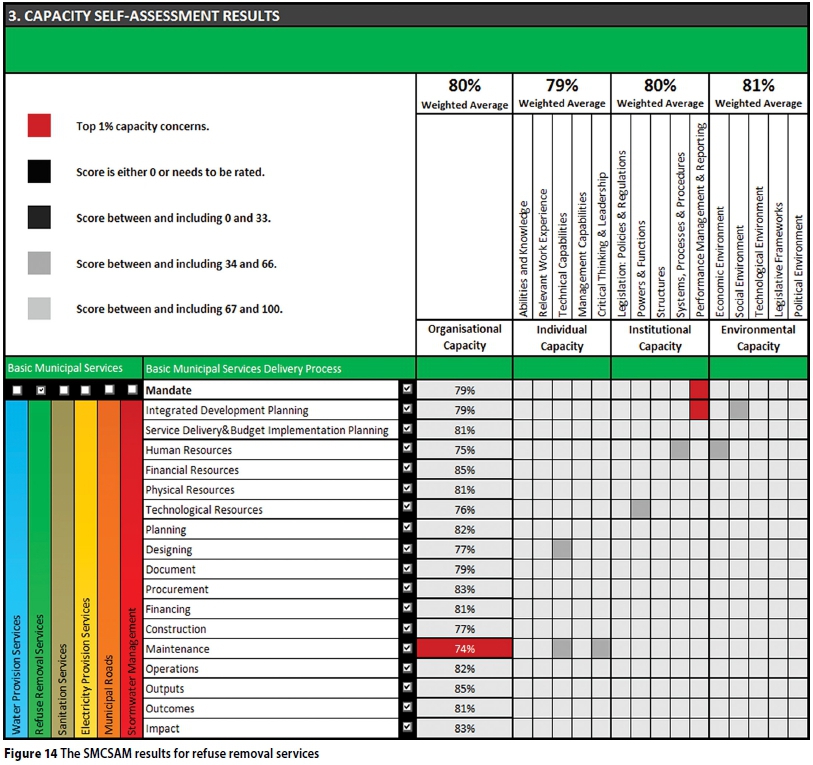
Figure 14 shows the results as generated by the SMCSAM for refuse removal services. Evidently, the perceived capacity of Drakenstein Municipality for the delivery of refuse removal services is very high. Individual capacity achieved a weighted average score of 79%, while institutional and environmental capacity scored 80% and 81% respectively. With the overall organisational capacity scoring 80%, few elements of the assessment matrix reflect weighted scores of below 67. However, for all Basic Municipal Services Delivery Process items, the maintenance of service delivery infrastructure represents the top 1% of capacity concern.
Figure 15 shows the results as generated by the SMCSAM for sanitation services. In terms of the capacity dimensions, individual capacity achieved the lowest score, with 57%. Both institutional and environmental capacity achieved a perceived weighted score of 71%, resulting in a 66% weighted average for overall organisational capacity. In terms of the Basic Municipal Services Delivery Process, the scores are observed with regard to resources, and more specifically technological resources. The top 1% of capacity concerns again relate to technical and management capabilities.
Figure 16 shows the results as generated by the SMCSAM for electricity provision. It is evident that the trends regarding the scores for the different capacity dimensions, as discussed above, are not observed for electricity provision. For this service, individual capacity achieved the highest score, while institutional and environmental capacity achieved 82% and 72% respectively. With a perceived weighted average of 83% for overall organisational capacity, it can be stated that the capacity of Drakenstein Municipality to provide electricity in its area of authorisation, is believed to be sufficient.
Figure 17 shows the results as generated by the SMCSAM for municipal roads. Evidently, the perceived capacity of Drakenstein Municipality to provide municipal roads is fairly low. Again environmental capacity achieved the lowest score with a weighted average of 53%, while individual and institutional capacity respectively achieved scores of 63% and 64%. This resulted in a weighted average of 60% for overall organisational capacity. In terms of the Basic Municipal Services Delivery Process human resources formed the top 1% of capacity concerns.
Figure 18 shows the results as generated by the SMCSAM for stormwater management. For stormwater management, scores of 63%, 63% and 51% were achieved for individual, institutional and environmental capacity respectively, while overall organisational capacity achieved a score of 59%. As for municipal roads, human resources formed the top 1% capacity concerns for stormwater management. The elements of the assessment matrix that formed the top 1% of capacity concerns are largely related to the environmental capacity, and more specifically the political, social and economic environments. In terms of the Basic Municipal Services Delivery Process, these concerns relate to all phases, except for designing, document and outputs.
Figure 19 shows the combination of the SMCSAM results and shows a perceived overall organisational capacity of 67% for Drakenstein Municipality, with human resources as the top 1% of the municipality's capacity concerns in terms of service delivery processes.
Respective capacity scores of 65%, 70% and 65% were achieved for individual, institutional and environmental capacity. In terms of the different elements of capacity, the top 1% capacity concerns related to the municipality's political, social or economic environments. Evidently, for the results of all services combined, none of the elements of the assessment matrix achieved a score of below 34. Thus, it can be concluded that Drakenstein Municipality has a realistically perceived capacity to deliver basic municipal services, and that this capacity is well aligned with the municipality's high levels of service delivery performance.
CONCLUSION
This research paper illustrated that accurate and truthful capacity assessments are a fundamental phase of any capacity building process. By acknowledging the relationship between performance, organisational capacity and leadership as set out in Figure 1, it can also be said that capacity assessments play a fundamental role in reaching the necessary performance efficiency. As highlighted in the literature study of this paper, service delivery performance enhancements by municipalities are becoming increasingly necessary. At the same time, the majority of municipalities in South Africa find themselves under-capacitated.
Some municipalities are aware of a lack of capacity within their organisation, but are unable to identify, define and quantify these shortcomings. Many other municipalities are not aware of their capacity shortfalls. In both cases, this is often caused by the lack of necessary systems and procedures to assess the different dimensions of organisational capacity. In this regard, this research paper introduced a proposed Subjective Municipal Capacity Self-Assessment Model (SMCSAM) as an alternative solution to the current practices of the Municipal Demarcation Board. It is intended that this model be used internally by municipalities to sustain internal capacity building and performance enhancement initiatives.
REFERENCES
Afesis-Corplan 2011. Service delivery protests in South Africa: Lessons for municipalities - by Musa Sebugwawo. Available at: http://www.afesis.org.za [Accessed on 13 November 2012]. [ Links ]
Bayazit, O & Karpak, B 2007. An analytical network process-based framework for successful total quality management (TQM): An assessment of Turkish manufacturing industry readiness. International Journal of Production Economics, 105(1): 79-96. [ Links ]
COGTA (Department of Cooperative Governance and Traditional Affairs, South Africa) 2009. Basic services publication, Pretoria: COGTA. [ Links ]
COGTA (Department of Cooperative Governance and Traditional Affairs, South Africa) 2012. Revised National Capacity Building Framework (NCBF) for local government 2012 to 2016. Pretoria: COGTA. [ Links ]
Drakenstein Municipality 2013. Annual Report 2011/2012. Paarl: Drakenstein Municipality. [ Links ]
Finn, M & Porter, L J 1994. QM self-assessment in the UK. The TQM Magazine, 6(4): 56-61. [ Links ]
Ford, M W & Evans, J R 2002. Models for organizational self-assessment. Business Horizons, 45(6): 25-32. [ Links ]
Fraser, W 2005. Using Baldrige-based self-assessment to drive public sector agency performance. Proceedings, ASQ World Conference on Quality and Improvement, Seattle, WA, US. [ Links ]
Hakes, C 2007. EFQM Excellence Model for Assessing Organizational Performance: A Management Guide. Zaltbommel, Netherlands: Van Haren Publishing. [ Links ]
Heese, K 2012. Municipal IQ's municipal hotspots results. Municipal IQ. Available at: http://www.africacheck.org/wp-content/uploads/2014/03/201312021614519448.pdf [ Links ]
Lawless, A 2007. Numbers and needs in local government - Addressing civil engineering - The critical profession for service delivery. Midrand: SAICE. [ Links ]
Macleod, N 2007. A time of opportunity for civil engineering in South Africa. Presidential Address. Midrand: SAICE. [ Links ]
Martinelli, F & Schnupp, S 2013. Capacity building toolkit. Available at: http://www.createthefuture.com/CBtoolkit.htm#_ftn1 [Accessed on 6 February 2013]. [ Links ]
MDB (Municipal Demarcation Board) 2010. Review of the MDB's Capacity Assessment Model. Johannesburg: MDB. [ Links ]
MDB (Municipal Demarcation Board) 2012. State Municipal Capacity Assessment 2010/2011. Johannesburg: MDB. [ Links ]
Nuland, Y, Van, G & Broux, L 1999. Excellent: A guide for the implementation of the EFQM Excellence Model®. Paper presented at the GOMACTech Conference, Leuven, Belgium. [ Links ]
Ritchie, L & Dale, B G 2000. Self-assessment using the business excellence model: A study of practice and process. International Journal of Production Economics, 66(3): 241-54. [ Links ]
Siddle, A & Koelble, T A 2012. The Failure of Decentrailisation in South African Local Government. Cape Town: UCT Press. [ Links ]
Statistics South Africa 2012. Census 2011. Pretoria: Statistics South Africa. [ Links ]
UNDP (United Nations Development Programme) 2007. Capacity assessment methodology user's guide. New York: Bureau for Development Policy. [ Links ]
UNDP (United Nations Development Programme) 2010. Measuring capacity. New York: United Nations Development Programme. [ Links ]
 Correspondence:
Sarelvan Baalen
9 Country Estate Drive
Waterfall Business Estate
Jukskei View, 1662
South Africa
T: +27 (0)10 060 1555; F: +27 (0)86 299 7730
E: svanbaalen@groupfive.co.za / smvanbaalen@gmail.com
Prof Corné Schutte
Department of Industrial Engineering
University of Stellenbosch
Private Bag X1
Matieland, 7602
South Africa
T: +27 (0)21 808 4234; F: +27 (0)21 808 4245
E: corne@sun.ac.za
Konrad Von Leipzig
Department of Industrial Engineering
University of Stellenbosch
Private Bag X1
Matieland, 7602
South Africa
T: +27 (0)21 808 4233; F: +27 (0)21 808 4245
E: kvl@sun.ac.za

SARELVAN BAALEN, Who holds a BEng degree in Civil Engineering and an MEng degree in Engineering Management from the University of Stellenbosch, is currently studying part-time towards a BCom degree in Law with prospects to do his MBA abroad. Sarel works for Group Five Construction (Pty) Ltd as a proposal engineer,and is involved inthetechnical, commercial and legal aspects of the preparation and coordination of bids fo multi-disciplinary engineering projects. He is also involved in business development and business process development. Sarel is an Associate Member of SAICE.

PROF CORNÉ SCHUTTE is Chairman of the Department of Industrial Engineering at the University of Stellenbosch. He is a Fellow and past president of the Southern African Institute for Industrial Engineering, and is a professionally registered engineer. He has an MEng in Industrial Engineering from the University of Pretoria, and a PhD in Engineering from the University of Stellenbosch.

KONRAD VON LEIPZIG holds a Master's in Industrial Engineering and has been a lecturer at the Department of Industrial Engineering at the University of Stellenbosch for 25 years. He i also Director of the Institute of Industrial Engineering at the Department. He specialises in Operations and Supply Chain Management, which he also teaches at MBA level at the University of Stellenbosch Business School, as well as productivity improvement, where he has been involved in various consulting projects. Hi has co-authored seven journal articles and numerous conference papers.

