


Servicios Personalizados
Articulo
 Inglés (pdf)
 Articulo en XML
 Referencias del artículo
Indicadores

Links relacionados
-
 Citado por Google
 -
 Similares en Google
Compartir

 Permalink
Journal of the South African Institution of Civil Engineering
versión On-line ISSN 2309-8775
versión impresa ISSN 1021-2019
J. S. Afr. Inst. Civ. Eng. vol.56 no.3 Midrand oct. 2014
TECHNICAL PAPER
Directional wave spectra on the east coast of South Africa
S Corbella; D D Stretch
ABSTRACT
Directional wave spectra provide detailed information about wave climates some of which can be important for coastal vulnerability assessments and design applications. Spectral data is also important for calibrating and validating spectral wave models that are widely used in coastal engineering. This paper discusses directional spectra derived from measurements on the east coast of South Africa (16-year data set). A variety of spreading functions are applied and compared. The Cosine-2s and Gaussian distributions produce similar results and seem to give an appropriate representation of directional spreading at the case study location. The spectra show some seasonal variations, with the broadest directional spreading in summer and the narrowest (from the southeast) in winter. The winter season also has the highest wave energy of the seasons. The spectral data has no clear evidence of cyclone activity contributing significant northeasterly wave energy as has often been conjectured for this location. The occurrence of wave energies above a threshold that causes significant coastal erosion varies seasonally, and mainly comprises long period swell waves linked to distinct weather systems. The analysis and results reported here provide insights for modelling coastal vulnerability and designing coastal infrastructure.
Keywords: waves, directional spectra, seasonality, coastal vulnerability
INTRODUCTION
Summary wave statistics (e.g. wave height, period and direction) are an incomplete and often insufficient means of characterising complex wave fields. Parameters such as significant wave height, peak wave period and direction are only partial descriptors of the full wave energy spectrum and neglect significant spatio-temporal information. Understanding wave directional spectra, including their variability and seasonality, has important applications in coastal vulnerability assessment and engineering design. For example, some beach types may only be vulnerable to specific wave directions, and this information may not be evident in basic wave statistics.
Spectral wave models have become an integral part of coastal engineering design and assessments. Detailed calibration and validation of these models can be improved by using measured directional wave spectra. Therefore, understanding site-specific features of directional wave spectra is an increasingly important component of all coastal and marine work. The measurement and analysis of directional wave spectra has captured global interest for a variety of applications, but mainly for the application of spectral wave models. For example, Alves and Melo (1999) analysed Brazilian wave data with the intention of creating input data for numerical models of wave evolution. Lucas et al (2011) analysed directional wave spectra from Portuguese coastal waters and North Atlantic locations in an attempt to create a statistical description of the wave climates, while Naffaa (1995) collected and analysed wave spectra data along the Nile Delta coast to estimate longshore sediment transport and to design coastal protection works.
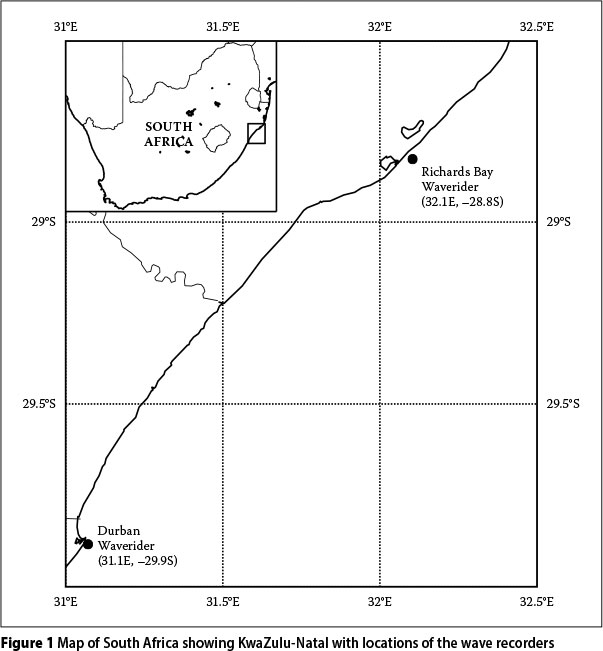
The east coast of South Africa (Figure 1) has two relatively long records of wave data. Basic wave statistics derived from the data have been reported by Corbella and Stretch (2012d), Rossouw (2001) and Rossouw (1984), but no detailed descriptions of the measured directional wave spectra have been published to date. The region has an energetic wave climate and some chronic erosion problems are occurring on the KwaZulu-Natal coastline (Corbella and Stretch, 2012a, c).
The principal forcing mechanisms for storm waves on the KwaZulu-Natal coastline are generally thought to be associated with three weather systems, namely (1) cold fronts and coastal lows, (2) extra-tropical cyclones and cut-off low pressure systems, and (3) tropical cyclones. Detailed descriptions of South African weather conditions can be found in Hunter (1987), Preston-Whyte and Tyson (1993), and Taljaard (1995). Cold fronts or extra tropical cyclones move from west to east and are associated with large intense wave fields. The effect of these systems on the KwaZulu-Natal coastline is relatively small compared to the effects on the west coast and southern east coast. Cold fronts and coastal lows generally exist closer to the coast than cut-off lows or cyclones, and are therefore typically associated with smaller wave heights and shorter periods from a southerly wave direction. Cut-off lows are associated with a southeasterly wave direction, but form further offshore and produce longer period waves. Tropical cyclones are sometimes cited as an important destructive force along the KwaZulu-Natal coast. However, recent research has suggested that these events may not be as significant as previously conjectured (e.g. Kruger et al 2010; Corbella & Stretch 2012b). Tropical cyclones produce long period waves typically from the north-east or east-north-east.
The aims of this paper are (1) to compare various directional spreading functions for the directional wave spectra, (2) to investigate seasonal variations in wave spectra, (3) to elucidate the spectra typically associated with erosive storm events, and (4) to evaluate the difference in spectral characteristics of wave events driven by distinct weather systems such as tropical cyclones near Madagascar. We start by describing the available data and the methods used for the analysis, followed by a presentation of the results, in turn followed by a discussion.
METHODS
Case study
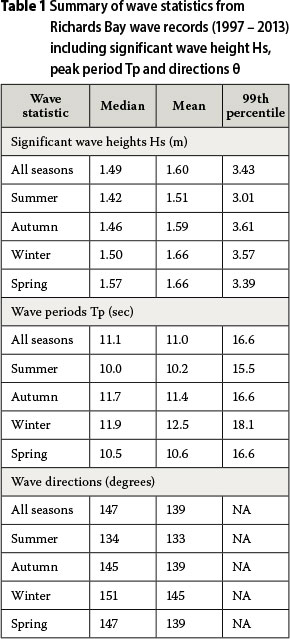
The east coast of South Africa (Figure 1) has two relatively long records of wave data measured at Durban and Richards Bay. Basic wave statistics derived from the data
have been reported by Corbella and Stretch (2012d), Rossouw (2001) and Rossouw (1984). A summary of these wave statistics is given in Table 1, and wave roses are shown in Figure 2. The largest waves tend to occur during the autumn and winter seasons, followed by spring and summer. All directions are stated in the nautical convention.
Spectral data
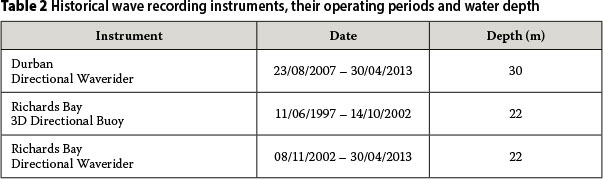
Spectral data for the east coast of South Africa is limited to Durban and Richards Bay (Figure 1). The collection of wave data at both sites has been primarily for port operations. Although Richards Bay has 34 years of spectral wave data, this study was solely concerned with directional wave spectra that are only available for 16 years. Durban has only six years of directional wave spectra data. Durban's six-year data set is from a single 0.9 m diameter Datawell Directional Waverider buoy located at constant coordinates and a water depth of 30 m (Table 2). The Richards Bay data sets are made up of two different instruments, but located at the same coordinates and a water depth of 22 m (Table 2). The directional wave recording buoys that have been used on the east coast of South Africa have been predominately Datawell Waverider buoys with the exception of a CSIR-developed buoy (called a GPS 3D buoy) using similar principles. The Waverider buoys sample at a rate of 1.28 Hz, and therefore collect a total of 256 heave samples every 200 seconds. The available data sets have spectral data available at 3-hour, 1-hour and 0.5-hour intervals.
It should be noted that the waves recorded by the wave recording buoys do not accurately represent deep-water waves. To explore the effects of refraction we simulate waves of different periods and directions with constant wave heights in a calibrated SWAN model (Booij et al 1999). The SWAN model consists of three curvilinear grids. The coarse grid has an average cell size of 500 m χ 500 m, the medium grid is 120 m χ 120 m and the fine grid is 20 m χ 20 m.
The recorded data consists of frequency, power spectral density (PSD), mean wave direction and directional spread for each frequency interval. The directional spread is the standard deviation of the wave directions in the recording interval, and is defined as:

where

is the amplitude of first harmonic and a1 and b1are angular Fourier coefficients in an expansion of the form:
Directional spreading
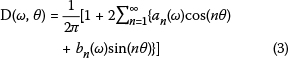
Directional wave spectra are a means of describing superimposed sea states, where each sea state has a unique wave number, frequency and direction of propagation. The directional wave spectrum therefore represents the distribution of wave energy in the frequency and direction domain, and is generally expressed as:

where Ε(ω, θ) is the directional wave spectrum, S(ω) is the frequency spectrum and D(ω, θ) is the angular distribution or directional spreading function. The directional spreading function is dimensionless and is normalised so that:

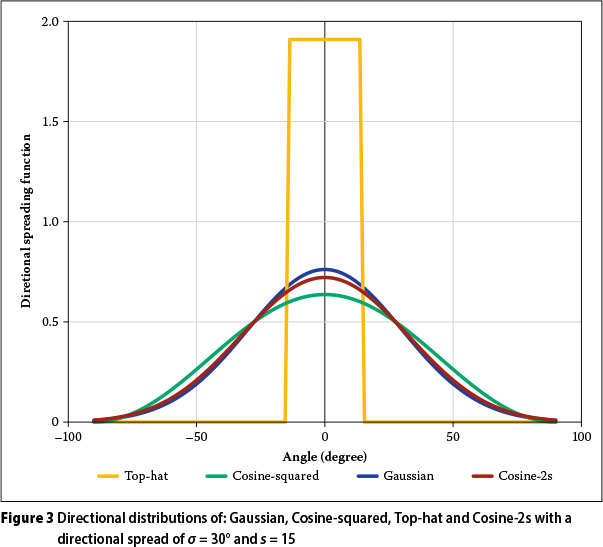
Directional distributions of sea states are inherently difficult to measure, so there remains limited knowledge on the subject (e.g. Goda 2008). Directional distributions can be derived directly from the Fourier coefficients a1 a2, b1 and b2without requiring the use of a model (Kuik et al 1988; Datawell BV 2010). The available data for the present study does not contain the Fourier coefficients, and so models of the directional distributions are applied. In this study we considered four directional spreading functions: Gaussian, uniform (Top-hat), Cosine-squared and Cosine-2s distributions.
Motivation for the use of a Gaussian distribution can be found in the central limit theory. Taking the directional spread of waves at frequency ω as the standard deviation of the wave directions σ(ω), the Gaussian directional spreading function can be expressed as:
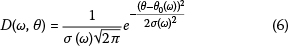
where θ0(ω) is the mean wave direction for frequency ω.
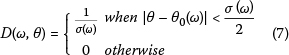
A uniform or Top-hat distribution as a spreading function can be used to demonstrate the sensitivity of the directional spectrum to the directional distribution. The Top-hat distribution is defined by:
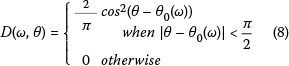
The Cosine-squared distribution is perhaps the simplest of the idealised directional distributions. The Cosine-squared distribution is defined as:
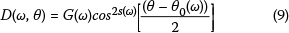
The Cosine-2s model is widely used due to its simplicity and general effectiveness (Kumara et al 1999). It was proposed by Longuet-Higgins et al (1963), and is expressed as:
where
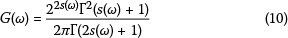
and where Γ(.) is the gamma function, and s is the spreading parameter.
Methods for estimating the spreading parameter s have been proposed by numerous authors (e.g. Mitsuyasu et al 1975;
Hasselmann et al 1973; Cartwright 1963; Wang 1992; Goda 2008). In this study we avoid the need for wind data by estimating s from the first Fourier harmonic, an approach that is widely used (Zhang & Zhang 2006) and yields the result:
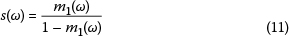
Figure 3 shows plots of the four different directional spreading functions with the directional spread taken as σ = 30°. A directional spread of 30° is representative of the average directional spreading for the dominant wave energy frequencies (refer to Figure 10). The plot illustrates that the Cosine-squared, Cosine-2s and the Gaussian distribution are very similar.
Seasonal distribution of directional wave spectra
The three data sets were compared both with and without grouping the data into seasons defined using the meteorological convention (refer Table 3). The seasons were compared using difference plots and by computing Pearson and Spearman correlation coefficients.
Exceedance percentiles of erosive storm events
Corbella and Stretch (2012a, b) previously found that significant wave heights exceeding 3.5 m were typically associated with major coastal erosion, and theytherefore used this as a threshold criterion to define a storm event. In a similar fashion the peak storm energies were related to the 3.5 m significant wave height threshold. The associated peak energy threshold was then used as an indication of significant erosive events. In the present study, the energy exceeding this threshold was used to investigate exceedance percentiles in (ω, θ) space. These distributions provide valuable information about the energy distribution of erosive storm events, and therefore can have important applications in coastal vulnerability assessments and in the design of coastal works.
RESULTS
In this section we start by investigating the effects of refraction between deep water waves and waves recorded by the wave recording buoys. We then compare the different directional spreading distributions, identifying an appropriate one. This is then used to compare the three data sets. The seasonality of the energy spectra is then presented. Finally the (ω, θ) distribution of wave energy for erosive storms is presented.
Refraction of deep water waves
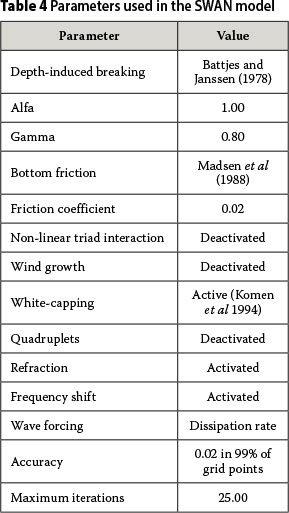
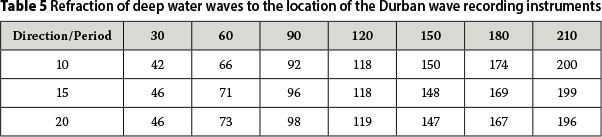
Since the Durban data is recorded at a depth of 30 m and the Richards Bay data is recorded at a depth of 22 m, there can be significant refraction of the deep-water waves. This is particularly true for the long period waves. A calibrated SWAN model was used to estimate the effects of refraction. The SWAN model parameters are detailed in Table 4. A deep-water significant wave height of 2.5 m was used for all the simulations, while varying the wave period and the wave direction from 10-20 seconds and 30°-180° respectively. The simulation results are limited to the Durban wave recording instruments and are shown in Table 5. For the 21 simulations in Table 5 on average the waves refract by 6° and a maximum of 16°. The largest refraction occurs for deep-water waves that approach from a 30° wave direction. Since Richards Bay's wave recorder is in shallower water it would not be unreasonable to expect refractions as large as 20 degrees.
Comparison of spreading functions
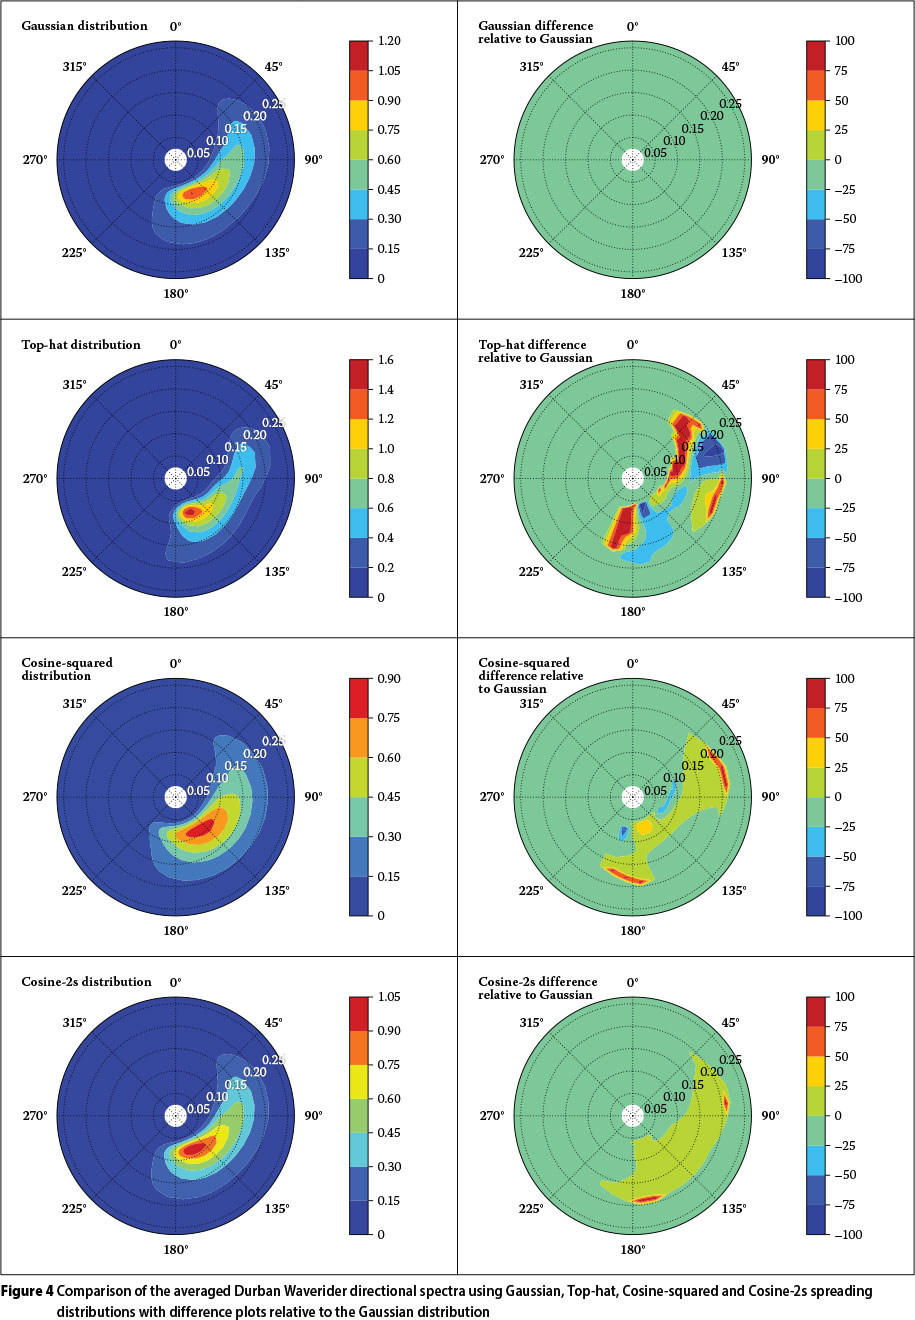
Figure 4 shows the averaged directional spectra for the Durban Waverider data using the Gaussian, Top-hat, Cosine-squared and Cosine-2s directional spreading distributions. Figure 4 also includes the percentage difference plots relative to the Gaussian distribution. The plots demonstrate a very similar distribution, and comparison of all the spectra give Spearman rank correlations near unity. On visual inspection the Gaussian and the Cosine-2s distributions produce the most similar results. They have Spearman and Pearson correlations of 0.99. The difference plots show an absolute difference of 3.7%. The other directional distributions differ from 20% to 60%. The major difference between the distributions is in their tails, while the main body of the distributions are generally similar.
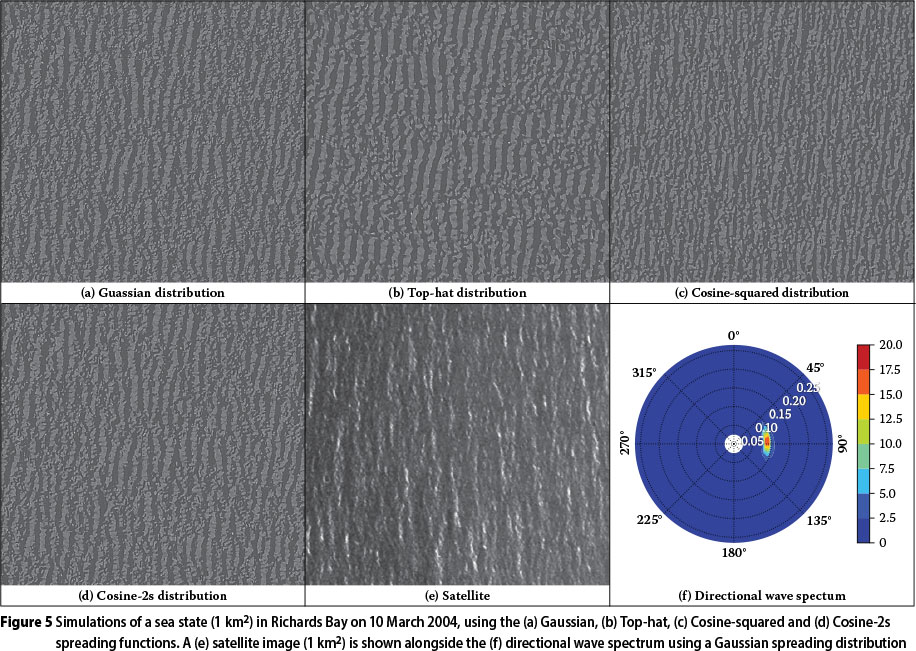
Figure 5 shows simulations of Gaussian waves using the WAFO Matlab tool-box (WAFO Group 2011). The simulations are of recorded data from 10 March 2004 using the four spreading functions (a) Gaussian, (b) Top-hat, (c) Cosine-squared and (d) Cosine-2s. The simulations are compared to (e) a Google Earth satellite image. The Gaussian, Cosine-squared and Cosine-2s simulations are almost indistinguishable and look similar to the satellite image, while the Top-hat distribution does not replicate the appearance of a real sea state. We conclude that the Gaussian, Cosine-squared and Cosine-2s distributions are all able to model a real sea state. There is no generally accepted standard functional form for directional spreading in the literature. The results using the Gaussian distribution are very similar to those of the widely used Cosine-2s distribution (Figure 3). Since the statistical theory underpinning the Gaussian distribution is widely familiar, we adopted it for our evaluation of the directional wave spectra characteristics.
Comparison of Durban and Richards Bay
Corbella and Stretch (2012a) claimed that the Durban and Richards Bay data was sufficiently similar to be used interchangeably. However, they did not consider the directional information since only six years of data is available for comparison. Furthermore, comparisons based on averaged statistics from short data sets are not definitive, because it has been found that a minimum of 50 years of data is required to accurately estimate a wave climate and obtain a representative average (WASA Group 1998).
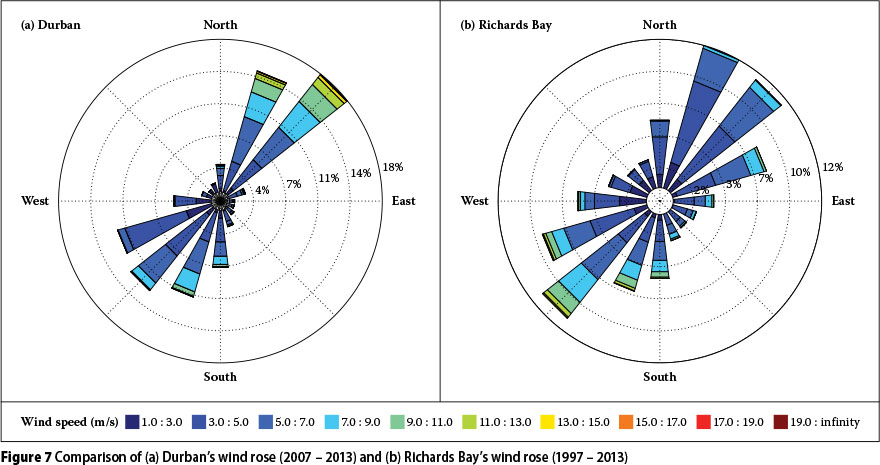
Averaged directional spectra for both Richards Bay and Durban are shown in Figure 6. Both locations have similar energy distributions between 90° and 180° and similar peak energies between 135° and 180°. However, it is evident from the difference plots that Durban has stronger northeasterly energy components. Richards Bay is approximately 160 km away from Durban and any meteorological forcing between the two locations will result in a northerly component for Durban and a southerly component for Richards Bay. The existence of such events may explain why Durban has a stronger northerly component and Richards Bay has a higher peak energy in the south. This may also be a function of the coast's orientation that allows a longer northerly fetch at Durban. Much of the northeasterly energy is contained around relatively high frequencies (greater than 0.1 Hz). These frequencies are usually associated with locally generated wind waves. Figure 7 shows wind roses for Durban and Richards Bay. Durban winds are more frequent and stronger from the northeast than the Richards Bay winds. The additional northeasterly wave energy in Durban can therefore be attributed to local wind conditions. Corbella and Stretch (2012a) correctly stated that the Durban and Richards Bay data is interchangeable in terms of significant wave height and wave period. However, considering directional energy spectra, Richards Bay may not provide enough northeasterly wave energy to use in place of the Durban data for design applications and coastal vulnerability assessments.
Comparing data from different instruments
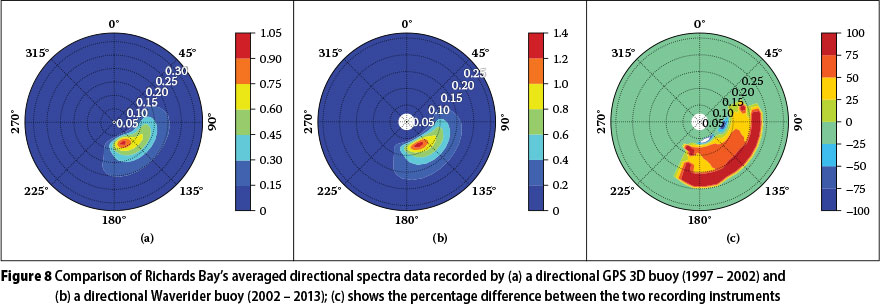
Richards Bay has five and a half years of directional data from a directional GPS 3D buoy, and more recently ten and a half years from a directional Waverider buoy (Table 2). These two recording instruments do not overlap, and so it is not possible to do a direct comparison. Figure 8 shows a comparison of the averaged directional spectra of the two wave recording instruments. Since these averages show similar directional spectra, and the recording instruments were in the same location, it is acceptable to combine the data sets into a 16-year record.
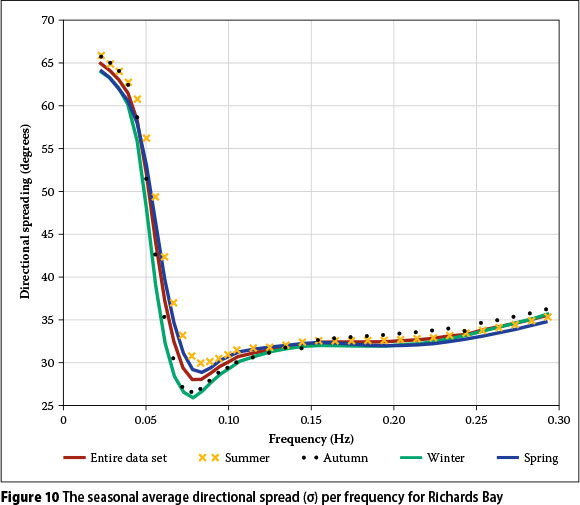
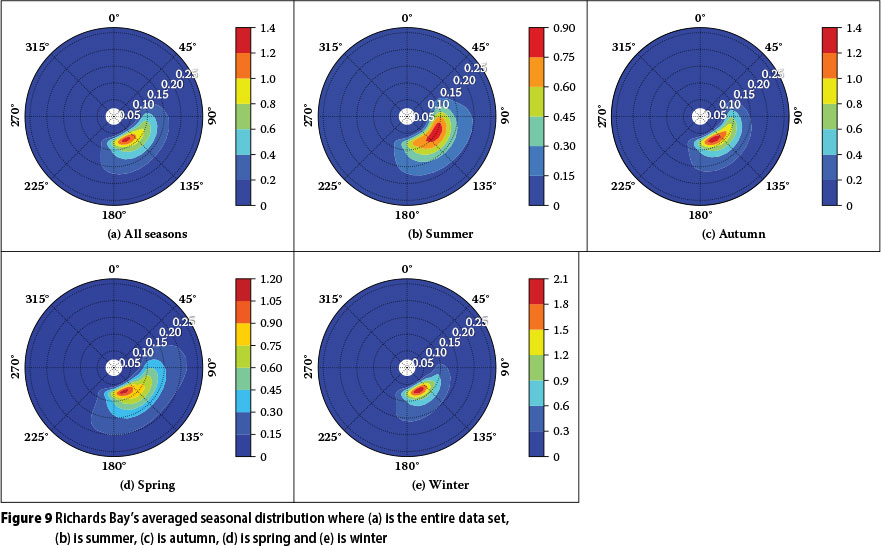
Richards Bay seasonality
All of Richards Bay's directional spectral data were combined into a 16-year record to produce the average seasonal spectra plotted in Figure 9. In addition we present the average directional spread per frequency (Figure 10). There is little seasonality in the Richards Bay data. Figure 10 shows that the seasons have different magnitudes of variability and may be placed in descending order of variability as summer, spring, autumn and winter. The energy is spread over the widest range of directions during spring and summer. This is due to the absence of large swell waves in these months, and these months also being the windiest months of the year. These two factors result in the average distributions being influenced by the predominant southwesterly and northeasterly winds. Autumn and winter do not show as much variability, but have more energy due to the presence of southeasterly storms during these months. This feature is also evident from the Durban data in Figure 6.
Distribution of erosive storm energy
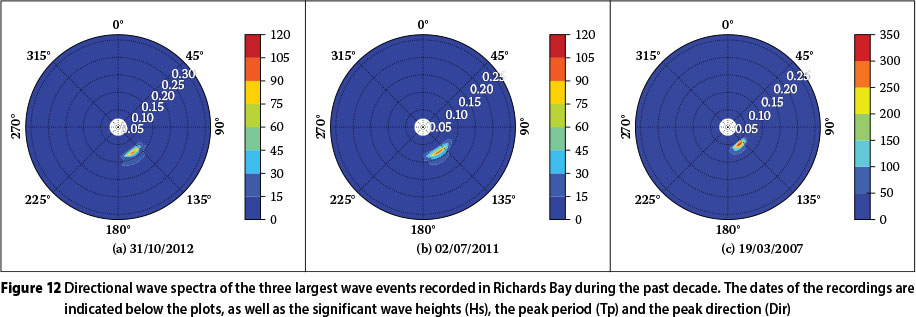
Figure 11 shows the percentage exceedance of the wave energies (Hs > 3.5 m) that could potentially erode a sandy coastline, as discussed earlier in this paper. The Durban data is not shown, as it is similar to the Richards Bay data and only covers six years. Figure 11 shows bimodal features with two storm components, one from the south-south-east, the other from the east-south-east. Their relative importance shifts seasonally. As expected, the storm waves for these events typically have low frequency (0.05 - 0.1 Hz), which is indicative of swell waves generated far offshore. Locally generated wind waves with generally higher frequencies (or shorter periods) are not evident in these plots, because they do not produce sufficient energy to exceed the threshold criterion used. Winter seems to be strongly dominated by a south-south-easterly swell. Figure 12 shows the three largest storms (in terms of significant wave height) in the past decade. These storms clearly show the south-south-easterly energy component that is so prominent in Figure 11. The storm event in the year 2007 was particularly destructive, and Corbella and Stretch (2012c) showed that many of the eroded beaches took six years to recover. The strong east-south-east energies in summer may be evidence of tropical cyclones contributing to erosive conditions. These exceedance percentiles for potentially erosive wave energy are clearly important for coastal vulnerability assessments.
DISCUSSION
The available directional data in the case study region only totals 16 years, and therefore cannot be considered as fully representative of the wave climate (WASA Group 1998). Nevertheless, while cognisant of the limitations in the short data record, several key features are already clearly evident.
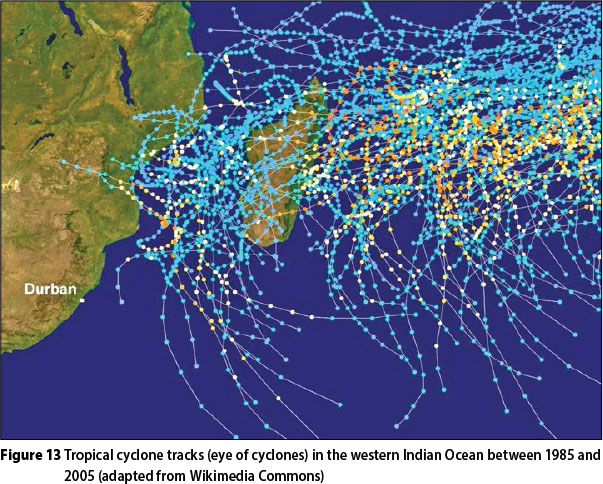
Firstly there is no evidence of significant northeasterly wave energy, with the exception of locally generated wind waves in Durban. It therefore seems apparent that tropical cyclones contribute very little to northeasterly storm waves outside of summer. It is expected that only cyclones entering the Mozambique Channel are capable of producing storm waves from the northeast and will generally only contribute to east-south-easterly wave energy, as is evident from Figure 13. It must be remembered that, due to wave refraction, many of the waves measured as east-south-east may be east-north-east deep-water waves. These waves, particularly in summer and autumn, may be evidence of tropical cyclones. The majority of waves, including the largest energy contributions, come from the southeast and seem to be associated with a combination of cold fronts and cut-off lows. The determination of wave origins can only be achieved by investigating the forcing mechanisms.
Secondly, the wave energy spectra show some seasonal variations. Summer storm waves are produced in the south-southeast and the east-southeast. The occurrence of the east-south-easterly component dominates in summer, even with the prevalence of strong northeasterly winds and tropical storms in the same season. The contribution of the two storm components changes in autumn and the south-south-easterly component dominates. This is due to storms that move up the coast from the south. The effect of these storms becomes even more prevalent in winter, where storm swells are only evident from the south-southeast. Winter also contains the most wave energy. Spring shows signs of the transition from winter to summer, with evidence of a bimodal energy distribution occurring.
In order to fully analyse these spectra, the wind and swell components should be partitioned and analysed separately. Once this partitioning has been performed, the associated spectra may be linked more directly to meteorological forcing, such as circulation patterns associated with sea level pressures. This may also be the only way to clearly identify and fully evaluate cyclone contributions.
Many coastal regions around the world are facing the prospect of increasing vulnerability to erosion and episodic storm damage due to climate change and associated sea level rise. Planning for this requires developing improved models of the wave climate that can incorporate climate change impacts - examples are given by Callaghan et al (2008), and Corbella and Stretch (2012b, 2013). Directional wave spectra contain information that should improve the realism of these models by providing greater detail concerning the wave characteristics that are important for specific applications and contexts. Furthermore, directional data can facilitate the linking of wave events to their meteorological forcing. Weather systems such as tropical cyclones and other important wave generating circulation patterns are expected to be affected by climate change. Therefore, linking them to location-specific wave characteristics is helpful in developing fidelity in wave simulation models.
CONCLUSION
In this paper we have presented a formal analysis of directional wave spectra data from the east coast of South Africa. Measurements from two locations about 160 km apart were analysed and found to be generally similar, but with some differences in the directional energy distribution - the Durban data has more northeasterly energy than Richards Bay. Various spreading functions have been investigated, and the Cosine-2s and Gaussian distributions produce similar results and are representative of directional spreading along the east coast of South Africa. There is evidence of seasonality in the directional wave spectra. Summer and spring have the least energy and the most directional variability, while winter has the most energy with the majority of it focused from the southeast. There is no clear evidence of tropical cyclones contributing significant northeasterly wave energy. For design and vulnerability considerations the southeasterly wave energy is the most important.
ACKNOWLEDGEMENTS
The authors thank the eThekwini Municipality, the National Ports Authority and the CSIR for access to the directional spectral wave data. Author Corbella is supported by a post-doctoral fellowship from the Nelson Endowment Fund in the UKZN School of Engineering, which is acknowledged with thanks. Author Stretch is grateful to the eThekwini Municipality for their support of a Sponsored Chair in Civil Engineering at UKZN.
REFERENCES
Alves, J & Melo, E 1999. On the measurement of directional wave spectra at the southern Brazilian coast. Applied Ocean Research, 21: 295-309. [ Links ]
Battjes, J A & Janssen, J P F M 1978. Energy loss and setup due to breaking of random waves. Proceedings, 16th International Conference on Coastal Engineering ASCE, Hamburg, Germany, pp 569-587. [ Links ]
Booij, N, Ris, R & Holthuijsen, L H 1999. A third-generation wave model for coastal regions. 1. Model description and validation. Journal of Geophysical Research, 104: 7649-7666. [ Links ]
Ca llaghan, D, Nielsen, P, Short, A & Ranasinghe, R 2008. Statistical simulation of wave climate and extreme beach erosion. Coastal Engineering, 55: 375-390. [ Links ]
Cartwright, D 1963. The use of directional spectra in studying the output of a wave recorder on a moving ship. New York: Prentice Hall. [ Links ]
Corbella, S & Stretch, D D 2012a. Decadal trends in beach morphology on the east coast of South Africa and likely causative factors. Natural Hazards and Earth System Sciences, 12: 2515-2527. [ Links ]
Corbella, S & Stretch, D D 2012b. Predicting coastal erosion trends using non-stationary statistics and process-based models. Coastal Engineering, 70: 40-49. [ Links ]
Corbella, S & Stretch, D D 2012c. Shoreline recovery from storms on the east coast of southern Africa. Natural Hazards and Earth System Sciences, 12: 11-22. [ Links ]
Corbella, S & Stretch, D D 2012d. The wave climate on the KwaZulu-Natal coast of South Africa. Journal of the South African Institution of Civil Engineering, 54: 45-54. [ Links ]
Corbella, S & Stretch, D D 2013. Simulating a multivariate sea storm using Archimedean copulas. Coastal Engineering, 76: 67-78. [ Links ]
Datawell, BV 2010. Datawell Waverider reference manual. Haarlem, Netherlands: Datawell BV Oceanographic Instruments. [ Links ]
Goda, Y 2008. Random seas and design of maritime structures, 2nd ed. Singapore: World Scientific Publishing. [ Links ]
Hasselmann, D E, Dunkel, M & Ewing, J A 1973. Directional wave spectra observed during JONSWAP. Journal of Physical Oceanography, 10: 1264-1280. [ Links ]
Hunter, I 1987. The weather of the Agulhas Bank and the Cape Town south coast. MSc dissertation. Cape Town: University of Cape Town, Department of Oceanography. [ Links ]
Komen, G J, Cavaleri, L, Donelan, M, Hasselmann, K, Hasselmann, S & Janssen, P A E M 1994. Dynamics and modelling of ocean waves. Cambridge: Cambridge University Press. [ Links ]
Kruger, A, Goliger, A, Retief, J & Sekele, S 2010. Strong wind climatic zones in South Africa. Wind and Structures, 13(1): 37-55. [ Links ]
Kuik, A, Vledder, G & Holthuijsen, L 1988. A method for the routine analysis of pitch and roll buoy wave data. Journal of Physical Oceanography, 18: 1020-1034. [ Links ]
Kumara, V S, Deob, M C, Ananda, N M & Chandramohana, P 1999. Estimation of wave directional spreading in shallow water. Ocean Engineering, 26: 83-98. [ Links ]
Longuet-Higgins, M, Cartwright, D & Smith, N 1963. Observations of the directional spectrum of sea waves using motions of a floating buoy. New York: Prentice Hall. [ Links ]
Lucas, C, Boukhanovsky, A & Guedes Soares, C 2011. Modeling the climatic variability of directional wave spectra. Ocean Engineering, 38: 1283-1290. [ Links ]
Madsen, O, Poon, Y K & Graber, H 1988. Spectral wave attenuation by bottom friction: Theory. Proceedings, 21st International Conference on Coastal Engineering ASCE, Torremolinos, Spain, pp 492-477. [ Links ]
Mitsuyasu, H, Tasai, F, Suhara, T, Mizuno, S, Ohkusu, M, Honda, T & Riki-ishi, K 1975. Observations of the directional spectrum of ocean waves using a cloverleaf buoy. Journal of Physical Oceanography, 5: 750-760. [ Links ]
Naffaa, M 1995. Wave climate along the Nile Delta coast. Journal of Coastal Research, 11: 219-229. [ Links ]
Preston-Whyte, R & Tyson, P 1993. The atmosphere and weather of southern Africa. Cape Town: Oxford University Press. [ Links ]
Rossouw, J 1984. Review of existing wave data, wave climate and design waves for South African and South West African (Namibian) coastal waters. CSIR report No T/SEA 8401. Stellenbosch: CSIR National Research Institute for Oceanology, Coastal Engineering and Hydraulics. [ Links ]
Rossouw, M 2001. Re-evaluation of the extreme wave climate of Southern Africa. PhD thesis. Stellenbosch: University of Stellenbosch. [ Links ]
Taljaard, J 1995. Atmospheric circulation systems, synoptic climatology and weather phenomena of South Africa. Part 2: Atmospheric circulation systems in the South African region. Pretoria: South African Weather Bureau. [ Links ]
WAFO Group 2011. WAFO - A MATLAB toolbox for analysis of random waves and loads. Lund, Sweden: Lund University. [ Links ]
Wang, D 1992. Estimation of wave directional spreadin in severe seas. Proceedings, 2nd International Offsho and Polar Engineering Conference, Rhodes, Greece, 17-23 June, Vol. III, pp 146-153. [ Links ]
WASA Group 1998. Changing waves and storms in the northeast Atlantic? Bulletin of the American Meteorological Society, 79: 741-760. [ Links ]
Zhang, S & Zhang, J 2006. A new approach to estimat directional spreading parameters of a Cosine-2s model. Journal of Atmospheric and Oceanic Technology, 23: 287-301. [ Links ]
BIBLIOGRAPHY
Komen, G J, Hasselmann, K & Hasselmann, K 1984. On the existence of a fully developed wind-sea spectrum. Journal of Physical Oceanography, 14: 1271-1285. [ Links ]
 Correspondence:
Stefano Corbella
School of Engineering University of KwaZulu-Natal
Durban
South Africa 4041
T: +27 31 260 1064
E: corbella@ukzn.acza
Derek Stretch
School of Engineering University of KwaZulu-Natal
Durban
South Africa 4041
T: +27 31 260 1064
E: stretchd@ukzn.ac.za

DR STEFANO CORBELLA Pr Eng (Member of SAICE) obtained his BSc degree in Civil engineering cum laude from the University of KwaZulu-natal. He completed the requirements for an MSc in coastal engineering summa cum laude and upgraded the MSc to a PhD that was completed in 2012. He is currently a post-doctoral research fellow In the UKZN Centre for Research in environmental, Coastal and Hydrological engineering.

PROF DEREK STRETCH (PhD (Cantab)) is Professor of Hydraulics and Environmental Fluid Mechanics at the University of KwaZulu-Natal. He currently occupies the eThekwini-sponsored Chair in Civil Engineering and is Director of the Centre for Research in Environmental, Coastal & Hydrological Engineering. His research group focuses on the bio-hyclroclynamics of estuarlne systems, coastal and shoreline processes, and understanding turbulence and mixing in environmental flows.

