


Servicios Personalizados
Articulo
 Inglés (pdf)
 Articulo en XML
 Referencias del artículo
Indicadores

Links relacionados
-
 Citado por Google
 -
 Similares en Google
Compartir

 Permalink
Journal of the South African Institution of Civil Engineering
versión On-line ISSN 2309-8775
versión impresa ISSN 1021-2019
J. S. Afr. Inst. Civ. Eng. vol.56 no.3 Midrand oct. 2014
TECHNICAL PAPER
Evaluating the prioritisation of South African dams for rehabilitation with special focus on risk to human lives
S Reynolds; C Barnardo-Viljoen
ABSTRACT
Existing decision criteria for the prioritisation of dam rehabilitation in South Africa are evaluated. In this context risk to human lives and economic considerations are the most important decision drivers, although other considerations are also taken into account by the Department of Water Affairs. The Department's assessment of risk to human lives is compared to international best practice and prediction models to show that the assessment is currently somewhat inconsistent, resulting in over-conservative decisions for low-consequence situations and possibly too low safety levels for severe-consequence situations. Reduction of the life-safety risks comes at significant costs, which may be better spent elsewhere. Society's Willingness to Pay is used to determine the lower boundary for acceptable investments in life safety. Investments for improved safety could also be made for economic reasons. Economic optimisation would often imply higher safety levels than required by Society's Willingness to Pay. These concepts are applied to case studies of actual South African dam rehabilitation projects, allowing evaluation of the quality of decisions taken. Based on the above, life-safety criteria that incorporate a measure of the economic efficiency of the proposed rehabilitation are developed, and suggestions are made to improve the current decision criteria used by the Department of Water Affairs.
Keywords: dams, risk acceptability, life safety, SWTP, optimisation
INTRODUCTION
In South Africa, the Department of Water Affairs (DWA) is a national governmental department that is the custodian of a large number of dams. A risk-based model has been developed and is currently applied by the DWA to aid decisions regarding the adequacy of dam safety levels. For a specific dam, the estimated probability and consequences of dam failure are combined to define risks. These risks are evaluated against multiple acceptability criteria on five impact diagrams to assess the risk to human life, and the economic, social, socio-economic and environmental impacts of dam failure. A sixth diagram is used by the DWA, the risk level diagram, where the annual risk of fatalities per exposed hour is evaluated against the annual risk of financial losses (Hattingh & Oosthuizen 2009). If any of these risks are considered unacceptable, the rehabilitation of the dam to improve its safety may be recommended.
In the years 2004/2005, the DWA identified 166 of the 314 South African government-owned dams as being in need of rehabilitation works. This encouraged the initiation of the dam safety rehabilitation programme, and it is estimated that the total expenditure for rehabilitation works since the start of the programme in 2005/2006, up until the 2011/2012 financial year, is more than R1.5 billion (Segers 2012).
The DWA recently identified the need to review its acceptability criteria for risk to human life.
Dam rehabilitation should reduce the probability of dam failure, thereby reducing the risk to human life. Since rehabilitation comes at large costs and it is society that essentially finances dam rehabilitations via public taxes or charges, it should be ensured that these investments in life safety are actually worthwhile for society. In this sense it must be noted that the societal resources that can be allocated to improving life safety through dam rehabilitation are limited. If the cost of reducing the risk to human life is disproportionate to the actual risk reduction, these resources may be better redirected into other sectors, for example into health care, transportation services or education, to improve the quality of life of society. Society' s Willingness to Pay (SWTP) is a utility function which may be used to determine the acceptable level of expenditure into life safety required by society (Pandey et al 2006).
On the other hand, investments in dam rehabilitation works are not always driven by societal preferences for life safety, but are often made for economic reasons. In these cases, larger investments than what is required by society can be justified, and their magnitudes can be determined by economic optimisation. These additional economic considerations could include economic motivations for the existence of the facility, damage costs and compensation costs for lives lost due to dam failure or the environmental, socio-economic and social implications of dam failure.
It is unlikely for the SWTP boundary to govern the investment into rehabilitation works, as economic optimisation would typically dictate the decision (Rackwitz & Streicher 2002). Thus, criteria which effectively incorporate this consideration into the decision process are needed.
The aim of this paper is:
-
To briefly review international best practice methods to quantitatively evaluate risk to human lives.
-
To evaluate the current DWA life-safety criteria by comparing to international best practice criteria.
-
To define the lower boundary for investments in life safety required by society,
-
using SWTP.
-
To investigate economic motivations for further investments, above the lower boundary for life safety defined by SWTP.
-
To propose criteria, primarily to evaluate life safety, but which implicitly incorporates some measure of the economic efficiency of the rehabilitation works.
INTERNATIONAL BEST PRACTICE METHODS FOR QUANTITATIVELY EVALUATING RISK TO HUMAN LIVES
Internationally, risk to life is most commonly quantitatively assessed as the expected fatalities per year against FN-criteria on an FN-diagram (Faber 2009). FN-diagrams have a double logarithmic scale with the x-axis representing the number of fatalities (N) and the y-axis the annual probability (F) of N or more fatalities occurring (Kroon & Maes 2008).
FN-criteria could be typically defined by two properties, namely the intersection with the y-axis and the slope of the criterion line. If the criteria intercept the y-axis at a lower probability (F) of N or more fatalities occurring, the criteria are more stringent. The slope of the criterion line describes the risk aversion of a society, which is the additional public opposition to an event which kills a large number of people over a series of smaller events that collectively result in the same number of fatalities (Ball & Floyd 1998). A slope of -1 represents a "risk neutral" society, while an increased slope, for example -2, is more stringent and describes "risk aversion".
Furthermore, the criteria can define different regions for risk - risks that are so high that they are to be judged as unacceptable/ intolerable, risks that are so low that they are to be judged as acceptable/negligible, and risks that are regarded as tolerable only if they are reduced to be As Low As Reasonably Practicable (ALARP) (Ball & Floyd 1998).
The implementation of the ALARP principle requires consideration of the trade-off between the risk and the time, the cost and the physical difficulty of implementing the risk reduction measure. If the cost of a safety measure is disproportionate to the actual risk reduction, it is not reasonably practicable to implement the safety measure, and a higher risk is accepted (HSE 2001).
Internationally, FN-criteria have been developed for life-safety risks associated with large-scale facilities, including nuclear and offshore facilities and the transport of dangerous goods. According to Ball and Floyd (1998) there are similarities between the criteria as it developed for these industries in the United Kingdom, the Netherlands and Hong Kong. The upper limit of tolerability is often set at 10-4 for 10 or more fatalities (or 10-5 in the Netherlands). The acceptable/ negligible line tends to be located two or three factors of 10 (100 or 1 000) lower on the frequency (F) scale. Most of the criteria used in the UK and in Hong Kong have a gradient of -1, whereas the Netherlands criteria are generally set at -2. This is due to different regimes of control. According to Ball and Floyd (1998) there is no compelling rationale for incorporating risk aversion into the FN-criteria defined for these industries, and generally a slope of -1, corresponding to risk neutrality, is regarded as good practice.
The criteria that have been developed for these industries may not necessarily be directly applied to dam safety, since it may be reasonably impracticable to accept the same safety levels. Expert judgement should be applied to establish industry-specific criteria.
The International Commission on Large Dams (ICOLD) outlines the current application of risk-based methods in international dam safety in Bulletin 130 on Risk Assessment in Dam Safety Management (2005). According to ICOLD (2005), many countries acknowledge that risk-based tools are useful within dam safety, but there are contradicting views and opinions, and some countries are hesitant to explicitly define FN-criteria for life safety.
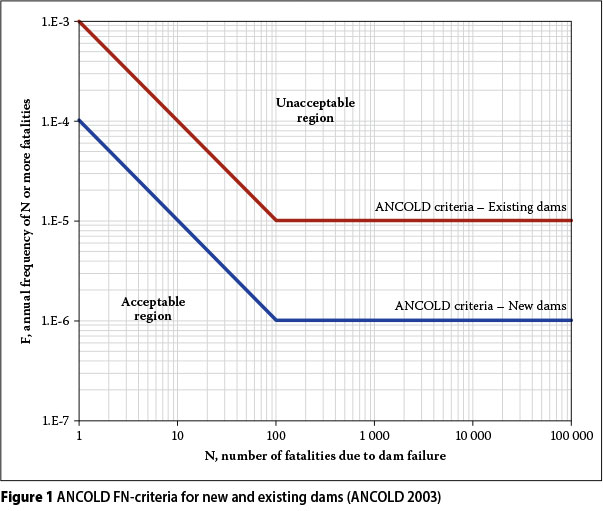
In Australia, the Australian National Committee on Large Dams (ANCOLD) proposed FN-criteria as shown in Figure 1. The following properties can be observed from the criteria:
-
Different criteria are defined for new and existing dams. According to ANCOLD (2003), the marginal cost of reducing risk at existing dams is generally more than at new dams. Thus, it is not reasonably practicable to accept same safety levels.
-
The acceptability limit is set at 10-4 for ten or more fatalities for existing dams, and at 10-5 for new dams, corresponding to the trend observed by Ball and Floyd (1998) for other industries.
-
A risk-neutral slope of -1 is used, corresponding to the Ball and Floyd (1998) recommendation.
-
The criteria have a lower probability of failure cut-off. According to ANCOLD (2003), technology does not allow for the construction of dams with lower probabilities of failure, and it is not reasonably practicable to reduce dam safety levels to more stringent criteria.
The ANCOLD criteria are thus based on engineering judgement, implicitly incorporating cost considerations for reasonable practice.
Several other dam safety organisations, such as the New South Wales Dam Safety Committee (NSW-DSC) also in Australia, and the US Army Corps of Engineers (USACE) in the USA, have based their criteria on the ANCOLD criteria. It was therefore decided to compare South African dam safety criteria for risk to human life to the ANCOLD criteria.
EVALUATION OF SOUTH AFRICAN DAM SAFETY CRITERIA FOR RISK TO HUMAN LIVES
The Department of Water Affairs (DWA) quantitatively estimates life-safety risks as the combination of the annual probability of dam failure (if) and the population at risk (PAR), i.e. the number of people exposed to the dam-break flood. These risks are evaluated against criteria presented on a PAR diagram, with the x-axis representing the PAR and the y-axis the probability of occurrence, as shown in Figure 2 (Hattingh & Oosthuizen 2009).
In Figure 2 an example is shown how the DWA depicts a dam's risk on this type of graph. To demonstrate the uncertainty associated with estimating risk, the DWA estimates ranges for the PAR and the probability of occurrence.
International methods assess risk to life most commonly as expected fatalities. Thus, since two different consequence measures are used, the South African dam safety criteria could not be directly compared to ANCOLD criteria.
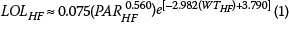
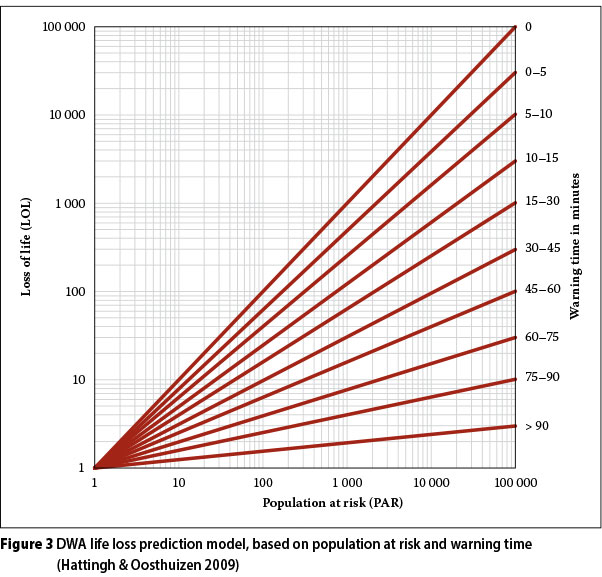
The DWA uses its own in-house developed model to predict what portion of the PAR would become fatalities, based on assumptions related to warning times (WTs) available to the PAR in the event of a dam break. The number of fatalities, expressed as the loss of life (LOL) by the DWA, can be estimated using the diagram shown in Figure 3.
The DWA criteria are compared to ANCOLD criteria by finding, for a certain Pf, the implied warning time (WT) needed such that the DWA-predicted loss of life would correspond to that of ANCOLD.
The implied WTs needed for the DWA criteria to adhere to ANCOLD criteria for new and existing dams are summarised in Table 1. For existing dams, at high probabilities of failure, long WTs are needed for DWA criteria to adhere to ANCOLD criteria. In practice these high WTs are often not realistically achievable, and thus such DWA dams are accepted at less stringent safety levels than ANCOLD dams. At low probabilities of failure, the WTs are small and probably easily achievable. Consequently DWA over-designs for low probability events, implying risk-averse behaviour.
A similar pattern is observed when the implied WTs needed for new dams are computed. As the probability of failure decreases, the implied WT decreases. The WTs needed for the criteria to correspond are higher than for existing dams, implying that new DWA dams are accepted at less stringent safety levels than ANCOLD new dams. This is expected because the DWA does not differentiate between new and existing dams in its acceptance criteria.
The DWA model for predicting loss of life was developed based on historical data for dam failures (Hattingh & Oosthuizen 2009). The statistical basis is not documented. It was therefore decided to validate the DWA prediction model by comparing it to another internationally accepted prediction model.
The DeKay and McClelland (1993) model uses a regression approach to predict the loss of life due to dam failure from the population at risk and assumptions related to the warning time, similar to the DWA model. It is based on the statistical analysis of actual historical data compiled from the 1950s onwards, which applies to a wide range of populations at risk. The DeKay and McClelland (1993) predicted life loss compares well with the actual historical data.
The DeKay and McClelland (1993) model incorporates an additional factor, the force factor, accounting for the severity of the dam-break flood on the predicted life loss. The High Force (HF) condition refers to the scenario where the PAR is located in a canyon and the flood waters due to dam failure are very deep and swift. The Low Force (LF) condition is where the PAR is located on a plain and the flood waters are shallow and slow. The DeKay and McClelland (1993) equations for determining the loss of life (LOL) from the population at risk (PAR) and warning time (WT) for both HF and LF conditions are:

The DeKay and McClelland (1993) predicted loss of life was compared to DWA-predicted values for a range of population at risk and for three different warning times, namely a "small" WT (0 minutes), a "medium" WT (30-45 minutes) and a "large" WT (90 minutes). The comparison between the two life-loss prediction models is shown in Figure 4 and Figure 5 for HF and LF conditions respectively.
For both HF and LF flood conditions the DeKay and McClelland (1993) model predicts the loss of life within a narrower range than the DWA model. For HF conditions DWA generally over-predicts the loss of life for small and medium WTs. This may lead to conservative decision-making regarding life safety where severe consequences are expected. In this way the DWA unwittingly incorporates risk aversion in decision-making. For LF conditions the DWA severely over-predicts the loss of life for small and medium WTs. Thus, the DWA predictions are too conservative for conditions where low consequences are expected. For large WTs, the DWA generally under-predicts the LOL in comparison to DeKay and McClelland (1993).
The conservative life-safety decisions implied by the DWA life-loss prediction model may, to some extent, off-set the moderate life-safety decisions of the DWA that are implied when the warning times needed for DWA criteria to adhere to ANCOLD criteria are computed. Until better South African data can be found to recalibrate the current DWA life-loss prediction model, we would, however propose that it be replaced by the DeKay and McClelland (1993) model, which has a well-documented and rational scientific basis.
A further comparison of the DWA criteria to ANCOLD can be made by using the DeKay and McClelland (1993) prediction model to convert "population at risk" to "loss of life".
For different probabilities of failure (Pf), the corresponding PAR is obtained from the PAR-criteria used by the DWA (Figure 2). For the PAR and an assumed WT the loss of life (LOL) is determined through the DeKay and McClelland (1993) prediction model. The LOL is plotted against the Pfto obtain a DWA equivalent FN-criterion line, which can be directly compared to the ANCOLD FN-criteria.
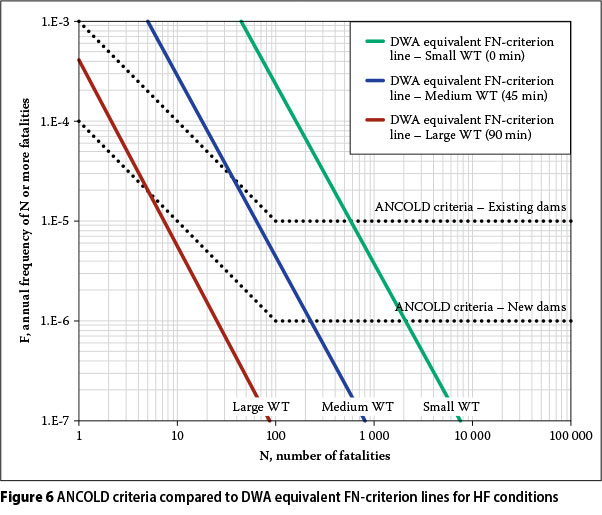
DWA equivalent FN-criteria are obtained for three assumed warning times (WTs) and for HF and LF conditions, as shown in Figure 6 and Figure 7.
Different DWA criteria lines were obtained, depending on assumptions regarding the available warning time and flood severity condition. This result implies a fundamental flaw in the currently used DWA criteria: while warning time and flood severity will influence the risk level that is associated with a given dam, the criteria that dictate what level of risk is deemed to be acceptable should be independent of the underlying characteristics of individual dams. The ALARP principle may be used as an argument to define different acceptability criteria for broad categories where reasonable practice may dictate less stringent safety requirements. For example, this is the argument behind ANCOLD's different criteria lines for new and existing dams.
For small WT and HF conditions the DWA equivalent FN-criteria were less stringent than the ANCOLD criteria, implying less stringent safety levels in cases where severe consequences are expected. For large WT and LF conditions, the DWA equivalent criteria were more stringent, implying too conservative decision-making in cases where low consequences are expected.
Further, the gradient of the DWA FN-criteria lines are steeper than the risk-neutral slope of -1 used by ANCOLD.
Thus, several problems with the current formulation of DWA life-safety criteria came to light by comparing them to the equivalent ANCOLD criteria. We propose that the DWA eliminates these by switching to the ANCOLD life-safety criteria, for the following reasons:
-
The ANCOLD criteria evaluate risk to life using fatalities as a consequence measure, which is most commonly used internationally. Using PAR as a consequence measure is fundamentally flawed, since the numbers of fatalities that may come from the PAR are greatly dependent on factors such as warning time and flood severity, which in turn are dam-specific.
-
An internationally recommended risk neutral slope of -1 is used.
Switching to ANCOLD would not imply a substantial change in the current DWA safety levels. It would, however, imply a more consistent treatment of risk across the board of different warning times and flood severity levels. Also, using ANCOLD criteria would not imply more risk analysis effort than what is currently required, since the DWA already estimates the loss of life as part of its standard risk analysis procedures.
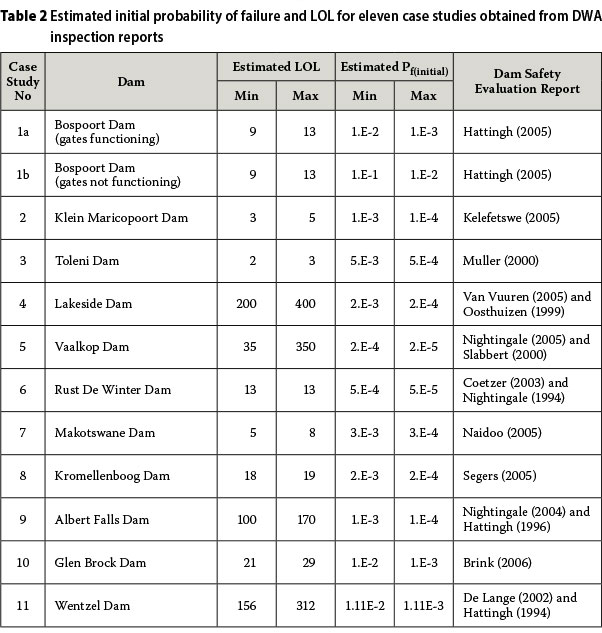
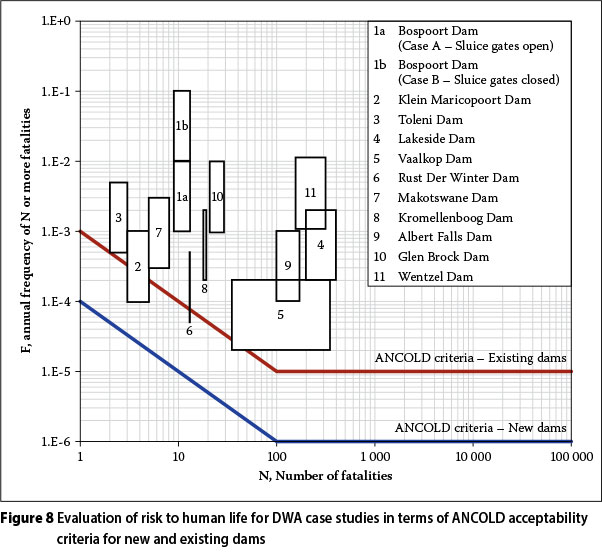
The risk to life for eleven case studies of DWA-owned dams that have been identified to be in need of rehabilitation are evaluated against ANCOLD FN-criteria for existing dams. The estimated initial probability of failure and LOL are obtained from DWA dam safety evaluation reports as shown in Table 2.
For Bospoort Dam two different scenarios were considered in the DWA risk analysis - Case 1a, where the sluice gates were assumed to function normally during failure, and Case 1b, with the gates not functioning during failure.
In Figure 8 it is seen that the risk to life for the case studies are mostly within the unacceptable region of the ANCOLD criteria for existing dams, justifying the original DWA rehabilitation decision.
The ANCOLD criteria do not only consider the societal preferences for investments in life safety, but implicitly take other considerations into account, for example economic considerations for reasonable practice. Societal Willingness To Pay is proposed to determine the acceptable level of these life-safety investments required by society.
SOCIETAL WILLINGNESS TO PAY (SWTP) AS A LOWER BOUNDARY CONSTRAINT ON DAM SAFETY LEVELS
The reduction of the life-safety risks of a dam through rehabilitation works comes at a cost. Society essentially finances dam rehabilitation via public taxes or charges; therefore it should be ensured that these investments in life safety are actually worthwhile to society. SWTP is a utility function which effectively determines the lower boundary for investments in life safety required by society (Pandey et al 2006). It is based on the Life Quality Index (LQI), which jointly considers the social indicators of a nation to give a measure of the quality of life of a society (Pandey & Nathwani 2004). In a simple form, the LQI can be written as:

where G represents the Gross Domestic Product (GDP) per person, E the life expectancy at birth, and q, a parameter which reflects the trade-off placed on consumption and the value attached to length of life. The parameter q depends on the fraction of time spent producing G, and the remaining time, the leisure time, available for the enjoyment of E. It is the ratio of average work time (w) to leisure time (i-w).
An investment in life safety should lead to an improved life quality. A small change in the LQI due to the implementation of a safety measure is shown (Nathwani et al 2008) as:

where dG corresponds to the monetary cost of implementing the project (negative), dE the change in the life expectancy due to a change in the risk associated with the project and K = 1/q.
The LQI net benefit criterion requires that an investment into life safety, which influences both G and E, should lead to a positive change in the LQI, i.e. dL/L>0
(Pandey & Nathwani 2004). SWTP defines the lower boundary for acceptable decisions and may be obtained as the exact value (dL/L = 0) of Equation 4:

Society requires that an investment, -dG, into a life-saving activity should at least be equal to the SWTP for a marginal increase in life expectancy (Fischer et al 2011).
The parameter dE/E may not always be easily quantified; instead it may be calculated as the product of the mortality change (dμ) and a demographic constant (Cx). The demographic constant takes age-averaging and discounting into account. For age-averaging two mortality reduction schemes may be considered, namely the π-regime, where the change in mortality is proportional over the age distribution, i.e. it implies that persons who are more susceptible to mortality (typically due to weakened physical state) are more subject to the phenomenon, and the Δ-regime, where the change in mortality is uniformly distributed over all ages, i.e. it implies that a phenomenon will affect every member of a society, regardless of each individual's age (Lentz 2007). The discount rate, also referred to as the time preference for consumption, compensates for the fact that individuals tend to undervalue the prospect of future consumption compared to current consumption.
If investments are made into risk reducing activities, a "technology curve" may be obtained, as shown in Figure 9. As the investment cost into life safety increases (ΔΟ, the risk to life is reduced ΔN).
The shape of the curve depends on the effectiveness and cost of life-saving measures. For different activities, projects and technologies, the curves differ, since different risk reduction options are typically available, some more effective than others. Society should implement all the safety measures that are more effective than the threshold set by SWTP, i.e. if the investment cost per marginal life saved ΔC/ΔN) is less than the SWTP for a marginal increase in life expectancy, the investment in life safety is efficient and should be made.
The absolute lower boundary for investments in life safety required by SWTP can be defined as:
Thus for a dam rehabilitation project, for the investment into life safety (ΔΟ to be considered efficient by society through SWTP, the minimum required reduction in risk to life ΔN) could be determined.
Considering the basic principle that expected risk is the product of probability and consequence, the minimum reduction in risk to human life ΔN) could be expressed as a function of the reduction in the probability of dam failure ΔΡf· (which depends on the effectiveness of the rehabilitation strategy) and the estimated number of lives lost (LOL) in case of dam failure:

This relationship implies that a rehabilitation investment may be considered inefficient if:
-
the rehabilitation strategy available is not effective, leading to a small reduction in ΔΡf
-
the dam was already fairly safe, thus rehabilitation leads to only a small improvement in ΔΡf
-
the number of expected lost lives (LOL) due to failure is already so low that the risk is considered acceptable.
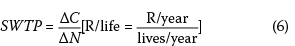
The lowest number of expected lost lives (LOLl) for which an investment into life safety is still considered efficient by society can be determined by rearranging Equation 7:

For an initial probability of failure before the dam is rehabilitated, if the LOL estimated by the DWA is more than LOLl the investment into rehabilitation works is required by society. In this way, FN-criteria lines can be developed to reflect the SWTP threshold for a specific dam, assuming a range of initial probabilities of failure, known rehabilitation costs and the final (rehabilitated) probability of failure.
SWTP-criteria are developed for the same eleven case studies of DWA-owned dams that have been evaluated in terms of ANCOLD criteria. The reduction in the probability of failure (ΔΡβ is determined as the difference between the initial probability of failure (Pf(initial), shown in Table 2, and the final (rehabilitated) probability of damfailure(Pf(final)).ThevalueforPf(final) is assumed to be between 1E-5 and 1E-6 per year, which is equivalent to the DWA assumption for a well-engineered dam with no known deficiencies (Oosthuizen 2002).
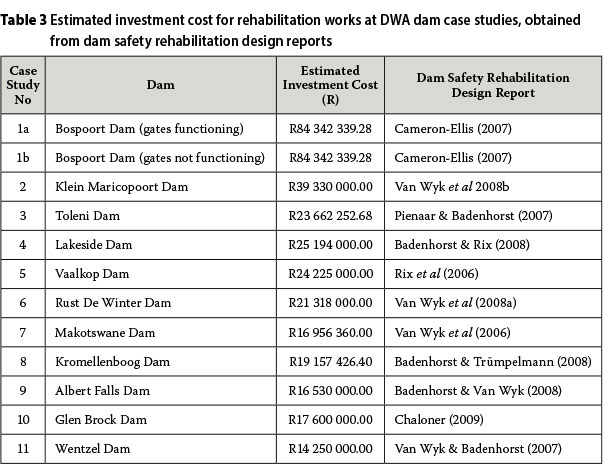
The estimated investment cost for rehabilitation works is obtained from DWA design reports, as shown in Table 3.
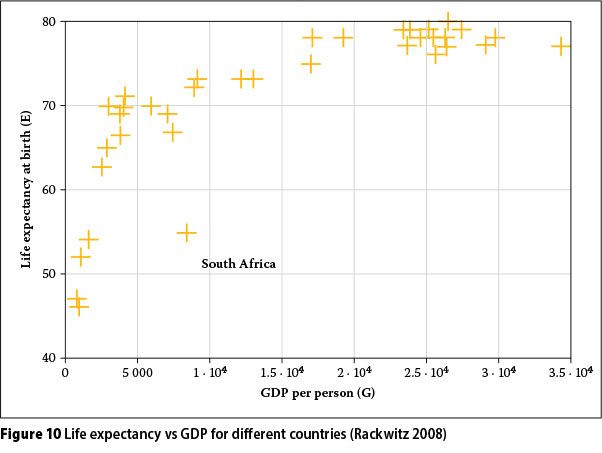
To develop SWTP criteria which may be applied to South African dam safety, a reasonable SWTP value should be used. Rackwitz (2008) demonstrates the relationship between the life expectancy at birth and GDP per person for different countries. In Figure 10 it is seen that the two factors are highly correlated across countries.
In South Africa the relationship between life expectancy and GDP per person is an outlier compared to other countries at similar levels of development. Our life expectancy is comparatively low due to factors such as HIV, and our GDP is comparatively high due to our richness in mineral resources (i.e. the GDP is not purely dependent on the income produced through the work time of South African citizens). Furthermore, the low employment rate in South Africa may lead to the misinterpretation of parameter q. A low value for work time (w) leads to a higher value for leisure time (1-w), implying that South African citizens prefer enjoyment of life over spending time earning a higher income.
Thus, the SWTP value for South Africa may not be a true reflection of our society's preference regarding investments in life safety. Instead, an Earth value for SWTP (ESWTP) developed by Faber and Virguez- Rodriguez (2011) is used. The ESWTP is based on observations for more than 70% of the Earth's population and conforms well to the underlying assumptions of the LQI derivation, i.e. the joint development of health and life safety (life expectancy at birth), economy (GDP per person) and the necessary time to work (described by q).
If a discount rate (time preference for consumption) of 3% (Arrow 1995), and a uniform mortality reduction scheme (Δ-regime) are assumed, the ESWTP obtained from Faber and Virgules-Rodriguez (2011) is US$ 517 000/life. US dollars are converted to the South African currency, rand, using the yearly average exchange rates obtained from the International Revenue Service (2012) from the years 2006 to 2011, within the time frame where the investment cost for rehabilitation works for the case studies were estimated. The average of the exchange rate values results in an ESWTP of R4.048 million/life.
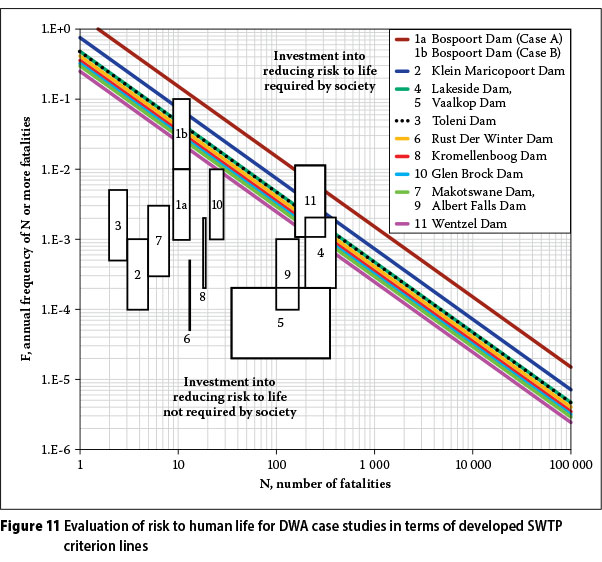
Based on the ESWTP, the estimated investment cost for rehabilitation works (ΔC), and the reduction in the probability of dam failure ΔΡf·, SWTP criteria lines were developed for the eleven case studies, as shown in Figure 11.
Since the available best practice technologies for rehabilitation works are case specific, the investment cost for reducing risk to life depends on the dam under consideration. Consequently different SWTP criteria lines are obtained for each dam. The positions of these lines are, however, within one log cycle (factor of 10) of one another, implying a fairly low level of sensitivity to factors such as the rehabilitation cost and the SWTP value. Therefore, as long as the values are estimated within the correct order of magnitude, useful criteria may be derived.
The estimated risk to life for the case studies (as the combination of the Pf(initial) and LOL shown in Table 2) is evaluated against these criteria lines. In Figure 11 it is seen that only two of the eleven case studies (case studies 4 and 11) required rehabilitation in terms of their SWTP criteria. ANCOLD criteria required rehabilitation for all the cases. ANCOLD, however, implicitly incorporates economic considerations for reasonable practice, while SWTP only accounts for societal preferences for life safety.
Further investments should be made if required by the decision-maker or owner of the facility on the basis of economic optimisation.
ECONOMIC OPTIMISATION AS A DECISION TOOL FOR EVALUATING SOUTH AFRICAN DAMS FOR REHABILITATION
Economic optimisation requires evaluating the profitability of a project, ensuring a maximum benefit at the lowest cost (Rackwitz 2002). It typically implies higher safety levels than those required by SWTP (Rackwitz & Streicher 2002). But, if the economic optimum is at a lower level than dictated by SWTP, the SWTP minimum safety level should be enforced.
Considering investments in dam rehabilitations, the objective function for the monetary net benefit is:

where B represents the benefit and C the cost of the rehabilitation works. B does not consider the incomes generated from the existence of the facility, but considers only the additional benefit derived from rehabilitation works, i.e. a reduced probability of dam failure which, in combination with the cost of failure, results in reduced expected cost of failure.
The cost of failure considers the economic losses and the compensation costs for lives lost due to dam failure. The DWA estimates direct and indirect economic losses through the risk analysis methodology, where the direct economic losses could include the damage to the structure, loss of agriculture and the costs of emergency relief, while the indirect economic losses could include the loss of future benefits (Hattingh & Oosthuizen 2009).
The compensation costs for lives lost are determined as the product of the estimated lives lost (LOL) and the Societal Value of a Statistical Life (SVSL). Similar to SWTP, SVSL is derived from the LQI concept (Faber & Virgules-Rodriguez 2011):

where G, K and E are as defined for Equations [3] and [4].
SWTP and SVSL should not be confused with each other - SVSL is the amount which should be compensated for each fatality, while SWTP defines the acceptable level for investments in life safety.
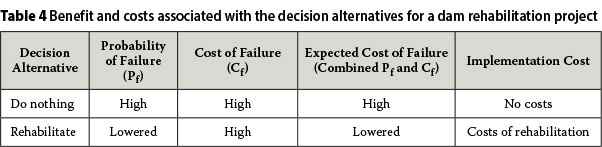
In each case study, the net benefit (Z) was determined for two decision alternatives, namely "do-nothing" and "rehabilitate". The two alternatives are compared to each other in terms of the expected cost of failure and the associated implementation costs, as shown in Table 4. Economic optimisation requires that the alternative with the highest net benefit should be preferred.
For the eleven dam cases considered in this study, the reduced probability of failure is determined as the difference between the f(initial),showninTable2 and the Pf(final) after rehabilitation, assumed to be between 1E-5 and 1E-6. To determine the costs of failure, the direct and indirect economic losses and LOL are obtained from DWA dam safety evaluation reports. The estimated cost of rehabilitation works is obtained from the DWA design reports, as shown in Table 3.
Five of the eleven case studies required rehabilitation on the basis of economic optimisation, while SWTP only required rehabilitation in two of these five cases. Therefore economic optimisation in most cases recommended higher safety levels.
The original DWA decision was to rehabilitate all eleven dams. The decision is not only based on life safety and economic considerations, it also considers the environmental, social and socio-economic impacts of dam failure and the risk level of dams, as described in the Introduction of this paper. The DWA dam safety evaluation reports for the other six cases reveals that two cases did not really require rehabilitation based on DWA criteria (although a number of risks were judged to be fairly high in these cases). The four remaining cases were rehabilitated based on environmental, social, socioeconomic and risk level considerations.
Since economic optimisation in most cases dictated the rehabilitation decision, criteria which effectively incorporate these observations into the decision process are needed. Also, the current DWA evaluation does not take the cost of rehabilitation works into account in any way, and so could be improved.
SINGLE-EVALUATION CRITERIA FOR EVALUATING DAMS FOR REHABILITATION
It could be argued that a three-phase approach would be the best, where the acceptability of risk to life is first evaluated using SWTP, followed by economic optimisation as possible motivation to rehabilitate, and finally incorporating environmental, socio-economic, social and risk level considerations into the evaluation. The first two tools do, however, require fairly involved estimations of the expected failure cost and the investment cost for rehabilitation works.
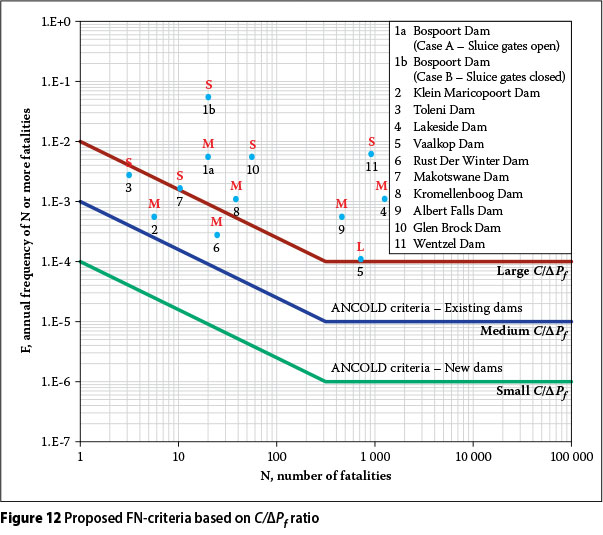
It is proposed to replace the first two steps with a single-evaluation criterion, which accounts for both considerations and would be more convenient and easy to use. For this purpose FN-criteria are developed primarily to evaluate risk to life, but which implicitly incorporate the economic efficiency of rehabilitation works. The FN-criteria are similar to ANCOLD criteria, but instead of using descriptive differentiation as in the case of ANCOLD ("new" vs "existing" dams), the ratio of the investment costs for rehabilitation to the reduction in the probability of failure (C/ΔΔΡf) is used as an efficiency measure on which stringency levels for safety are based. If a large reduction in the probability of failure (ΔΡf) can be achieved at a small cost, it is very efficient and reasonably practicable to implement more stringent safety criteria for these dams. On the other hand, if only a small ΔΡf· is achieved at a large cost, it might not be reasonably practicable to rehabilitate, and less stringent criteria should apply to such cases. FN-criteria with different levels of stringency were developed for "small", "medium" and "large" efficiency ratios (C/ΔΡf).
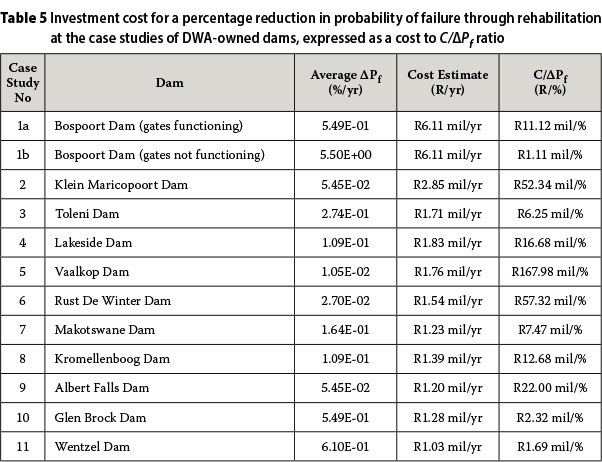
The eleven case studies considered in this study were used to define practical ranges for the efficiency ratios. The C/ΔPf ratio is computed, as shown in Table 5.
To differentiate between the efficiency of rehabilitation works, the C/ΔPf ratios are divided into intervals to obtain practical levels for what can be considered as a "small", "medium" and "large" ratio:
-
Small: R1 mil/% <C/ΔPf < R10 mil/%
-
Medium: R10 mil/% <C/ΔPf < R100 mil/%
-
Large: C/ΔPf > R100 mil/%
The "small" efficiency ratio was defined to coincide with the ANCOLD criterion line for new dams, the "medium" efficiency ratio with the ANCOLD criterion line for existing dams, and an additional "large" efficiency ratio criterion line, one multiple of 10 less stringent than the previous two were defined.
The risk to life for cases studied was evaluated in terms of these newly developed criteria as shown in Figure 12. For simplicity the average value of the Pf and the LOL was used to define the risk to life as a singular point instead of a block (with "S" for "small", "M" for "medium" and "L" for "large" efficiency ratios).
Rehabilitation works were required for all the cases, corresponding to the original DWA decision. The case studies within the "medium" or "large" intervals were, however, located closer to, or on the border of, acceptability of their criteria lines.
Based on the SWTP and economic optimisation outcomes, some dams should not have been rehabilitated. This could suggest an argument for moving the criteria lines to an even less stringent safety level, but for this to be properly motivated more case studies should be considered.
The proposed C/ΔPf criteria could be used as a first step to evaluate South African dams for rehabilitation. It is easy and convenient to use. The rehabilitation decision could then be tested by applying the SWTP and economic optimisation criteria, but these methods require more involved estimations of rehabilitation and failure costs.
It should be noted that the C/ΔPf criteria are by no means perfect. The benefit of an investment in rehabilitation works only considers a reduction in the probability of failure, while economic optimisation additionally considers the costs of dam failure.
The criteria do not consider other factors, such as the socio-economic, social and environmental impacts and the risk level, any of which could require dam rehabilitation works. These factors should be considered separately and require expertise in different areas.
SUMMARY AND CONCLUSIONS
In summary, when evaluating South African dams for rehabilitation works, the diagram shown in Figure 13 could be considered. The DWA-estimated risks, as the combined probability and consequences of dam failure, could be evaluated against the FN-criteria proposed in this study, as shown in Figure 12, which primarily evaluates risk to life, but implicitly incorporates a measure of economic efficiency. It is well-aligned with ANCOLD criteria that are based on good engineering practice and judgement. In addition, the risks should be evaluated against the existing DWA multiple acceptability criteria for economic, environmental, social and socio-economic impacts of dam failure and the risk level of dams. If a more refined analysis is required, the risks, together with a detailed estimate of the cost of proposed rehabilitation works, could be used to re-evaluate the rehabilitation decision in terms of the SWTP criteria, economic optimisation and the DWA multiple acceptability criteria.

The criteria developed in this study do not serve as absolute criteria, but are guidelines which should be considered in conjunction with engineering expert judgement. They could serve as useful tools for validating and prioritising dam rehabilitation. Through this the DWA could make informed decisions and efficiently allocate financial resources to the improvement of dam safety in South Africa.
REFERENCES
ANCOLD (Australian Committee on Large Dams) 2003. Guidelines on risk assessment. Hobart, Tasmania, Australia: ANCOLD. [ Links ]
Arrow, K J 1995. Intergenerational equity and the rate of discount in long-term social investment. Technical report. Stanford, CA: Stanford University, Department of Economics. [ Links ]
Ball, D J & Floyd, P J 1998. Societal risks. London: Health and Safety Executive. [ Links ]
DeKay, M L & McClelland, G H 1993. Predicting loss of life in cases of dam failure and flash flood. Risk Analysis, 13(2): 193-2005. [ Links ]
DWA (Department of Water Affairs, Pretoria, South Africa) 2006-2008. DWA design reports for dam safety rehabilitation: [ Links ]
■ Rix, A et al 2006 (Vaalkop Dam) [ Links ]
■ Van Wyk, W et al 2006 (Makotswane Dam) [ Links ]
■ Cameron-Ellis, D G 2007 (Bospoort Dam) [ Links ]
■ Pienaar, R A & Badenhorst, D B 2007 (Toleni Dam) [ Links ]
■ Van Wyk, W & Badenhorst, D B 2007 (Wentzel Dam) [ Links ]
■ Badenhorst, D B & Rix, A P 2008 (Lakeside Dam) [ Links ]
■ Badenhorst, D B & Trümpelmann, M 2008 (Kromellenboog Dam) [ Links ]
■ Badenhorst, D B & Van Wyk, W 2008 (Albert Falls Dam) [ Links ]
■ Van Wyk, W et al 2008 (Klein Maricopoort Dam) [ Links ]
■ Van Wyk, W et al 2008 (Rust De Winter Dam) [ Links ]
■ Chaloner, A 2009 (Glen Brock Dam). [ Links ]
DWA (Department of Water Affairs, Pretoria, South Africa) 1994-2006. DWA dam safety inspection reports: [ Links ]
■ Hattingh, L C 1994 (Wentzel Dam) [ Links ]
■ Nightingale, P A 1994 (Rust De Winter Dam) [ Links ]
■ Hattingh, L C 1996 (Albert Falls Dam) [ Links ]
■ Oosthuizen, C 1999 (Lakeside Dam) [ Links ]
■ Muller, H 2000 (Toleni Dam) [ Links ]
■ Slabbert, P J A 2000 (Vaalkop Dam) [ Links ]
■ De Lange, F J 2002 (Wentzel Dam) [ Links ]
■ Coetzer, C J 2003 (Rust De Winter Dam) [ Links ]
■ Nightingale, P A 2004 (Albert Falls Dam) [ Links ]
■ Hattingh, L C 2005 (Bospoort Dam) [ Links ]
■ Kelefetswe, S E 2005 (Klein Maricopoort Dam) [ Links ]
■ Naidoo, R 2005 (Makotswane "Buffelsdoorn" Dam) [ Links ]
■ Nightingale, P A 2005 (Vaalkop Dam) [ Links ]
■ Segers, I 2005 (Kromellenboog Dam) [ Links ]
■ Van Vuuren, A 2005 (Lakeside Dam) [ Links ]
■ Brink, J 2006 (Glen Brock Dam). [ Links ]
Faber, M H 2009. Risk and safety in engineering. Course notes. Zurich: Swiss Federal Institute of Technology. [ Links ]
Faber, M H & Virguez-Rodriguez, E 2011. Supporting decisions on global health and life safety investments. In Nishijima, K. (Ed). Application of statistics and probability in civil engineering. Boca Raton, FL: CRC Press, pp 434-443. [ Links ]
Fischer, K, Virguez-Rodriguez, E, Sanchez-Silva, M & Faber, M H 2011. Defining guidelines for the application of the marginal life-saving costs principle for risk regulation. In Nishijima, K. (Ed). Application of statistics and probability in civil engineering, Boca Raton, FL: CRC Press, pp 444-451. [ Links ]
Hattingh, L C & Oosthuizen, C 2009. Risk assessment of Department of Water Affairs' dams. Pretoria: Department of Water Affairs [ Links ]
HSE (Health and Safety Executive) 2001. Reducing risk, protecting people. Sudbury, Suffolk, UK: HSE Books. [ Links ]
ICOLD (International Committee on Large Dams) 2005. Risk assessment in dam safety management - Reconnaissance of benefits. ICOLD Bulletin 130. Paris: ICOLD. [ Links ]
International Revenue Service 2012. Yearly average currency exchange rates. Available at: http://www.irs.gov/businesses/small/international/article/0„id=206089,00.html [Accessed on 16 July 2012]. [ Links ]
Kroon, I B & Maes, A 2008. Theoretical framework for risk assessment and evaluation. Technical report. Switzerland: Joint Committee of Structural Safety (JCSS). [ Links ]
Lentz, A 2007. Acceptability of civil engineering decisions involving human consequences. PhD thesis. Munich, Germany: Technical University. [ Links ]
Nathwani, J S, Lind, N C & Pandey, M 2008. The LQI standard of practice: Optimizing engineered safety with the Life Quality Index. Structure and Infrastructure Engineering, 4(5): 327-334. [ Links ]
Oosthuizen, C 2002. Risk-based rehabilitation of dams. In Design and rehabilitation of dams. Short course. Institute for Water and Environmental Engineering, Stellenbosch University; SANCOLD, South Africa [ Links ]
Pandey, M D & Nathwani, J S 2004. Life Quality Index for the estimation of societal willingness-to-pay for safety. Structural Safety, 26(2): 181-199. [ Links ]
Pandey, M, Nathwani, J & Lind, N 2006.The derivation and calibration of the Life Quality Index (LQI) from economic principles. Structural Safety, 28(4): 341-360. [ Links ]
Rackwitz, R 2002. Optimization and risk acceptability based on the Life Quality Index. Structural Safety, 24(2-4): 297-331. [ Links ]
Rackwitz, R 2008. The philosophy behind the Life Quality Index and empirical verifications. Technical report. Switzerland: Joint Committee of Structural Safety (JCSS). [ Links ]
Rackwitz, R & Streicher, H 2002. Optimization and target reliabilities. Paper presented at the Joint Committee of Structural Safety (JCSS) Workshop on Reliability-based Code Calibration, Zurich. [ Links ]
Segers, I 2012. Dam safety rehabilitation progress report. Technical report. Pretoria: Department of Water Affairs. [ Links ]
 Correspondence:
Sonel Reynolds
Department of Water Affairs Private
Bag X313 Pretoria 0001
South Africa
T: +27 12 336 8869
F: +27 12 336 8786
E: ReynoldsS@dwa.gov.za
Celeste Barnardo-viljoen
Stellenbosch University Private
Bag X1 Matieland 7602
South Africa
T: +27 21 808 4444
F: +27 21 808 4947
E: cbarnardo@sun.ac.za

SONEL REYNOLDS, who is a member of SAICE, obtained her BEng (Civil) degree at Stellenbosch University in 2010. Thereafter she continued her studies by completing a Master's in Structural Engineering at the same university. In February 2013 she started her career at the Department of Water Affairs where she is currently gaining - practical experience within the Department's dam safety surveillance sub-directorate. She has a special interest in risk and reliability. The results presented in this paper form part of her research towards the MSc Eng degree at Stellenbosch University (2013).

DR CELESTE BARNARDO-VILJOEN Pr Eng, who is a member of SAICE, completed her doctoral degree in structural engineering in 2006 at the University of Stellenbosch, for which she was honoured with the Chancellor's medal. She began her career at Element Consulting Engineers where she designed concrete structures. In 2009 Celeste joined Stellenbosch University as senior lecturer in the structural engineering division, where she also leads the structural risk and reliability research group. In 2010 Celeste was appointed on the Joint Committee for Structural Safety (JCSS), an international committee that develops norms for the design of reliable structures.

