


Servicios Personalizados
Articulo
 Inglés (pdf)
 Articulo en XML
 Referencias del artículo
Indicadores

Links relacionados
-
 Citado por Google
 -
 Similares en Google
Compartir

 Permalink
Journal of the South African Institution of Civil Engineering
versión On-line ISSN 2309-8775
versión impresa ISSN 1021-2019
J. S. Afr. Inst. Civ. Eng. vol.56 no.1 Midrand ene. 2014
TECHNICAL PAPER
The application and interpretation of linear finite element analysis results in the design and detailing of hogging moment regions in reinforced concrete flat plates
S A Skorpen; N W Dekker
ABSTRACT
Finite Element methods have been used by civil and structural engineers since the 1960s, and the theory behind this is well researched. However, there is still a lack of direction on how to use the information obtained from this type of analysis to practically design a structure for strength and serviceability criteria. Design codes are broadly based on simplified calibrated strength models and are consistent with simplified and practical detailing.
In this paper traditional methods of analysis of a simple pad foundation are compared with the linear finite element method, and the results compared to experimental results. The following questions are answered:
■ Are the traditional simplified methods adequate with respect to overall strength?
■ To what extent may finite element peaks or singularities be averaged or smoothed without compromising durability and serviceability?
■ How should the reinforcement obtained from linear finite element methods be detailed?
LIST OF NOTATIONS
d = effective depth of reinforcement in a slab or footing (mm) h = depth of concrete in a slab or footing (mm)
B = shorter plan dimension of a footing (mm)
D = longer plan dimension of a footing (mm)
Ms = smoothed support bending moment (Nmm)
Mp = peak moment at the centreline of the support (Nmm)
Fs = support reaction (N)
bs = width of support column (mm)
INTRODUCTION
Concrete design codes, SANS 10100 and Eurocode 2, currently in use, contain calibrated strength models enabling the user to calculate a safe resistance of a structural member. In many cases, such models are simplifications of quite complex failure modes. Load effects obtained using appropriate methods of analysis provide values of bending moments, shear forces and axial forces. Local peak effects (singularities) cannot be calculated using the traditional methods of analysis. The simplifications are justified, by and large, by the ductile behaviour of the members. The reliability of the models has been proved by the lengthy process of calibration involved and the many structures that have safely resisted the applied loads. A specific application can be found in a plate with column supports. Significant differentiation in curvature over the supports is regulated by the traditional methods, by simple stepping requirements.
The advent of finite element methods of analysis provides absolute rather than average values of load effects and stresses. Practical detailing of structural elements does not generally take cognisance of the peak values obtained from more sophisticated methods of analysis. Given how long simple methods of analysis have been used, and the reliability attached to the proven methods, the use of more sophisticated methods of analysis should be applied in such a manner as to provide consistent results.
Finite Element (FE) methods have been used by civil and structural engineers since the 1960s (Carlton 1993) and the theory behind these is well researched. However, there is still a lack of direction on how to use the information obtained from this type of analysis to practically design a structure for strength and serviceability criteria. Design codes assume that the designer has engineering judgement and a 'feel' for the behaviour of concrete when using FE analysis (Brooker 2006).
FE plate structures are analysed using classic plate theory which has been formulated by considering equilibrium and strain compatibility in plates which are thin enough for shear deformations to not have a significant effect on the behaviour of the slab, and thick enough that in-plane and membrane forces are not important. Park and Gamble (2000) refer to these plates as "medium thick" but they are generally referred to as thin plates.
Thin plate theory is used for flat structures where transverse shear effects are not important, and is based on Kirchhoff's theory. Thick plate theory is used for flat structures where the effects of transverse shear must be included. This is based on Reissener's / Mindlin's theory which takes into account the effect of shear strain.
The basic assumptions of thin plate or shell theory are summarised by Rombach (2005):
■ Plane sections remain plane before and after loading
■ Linear strain distribution of the slab depth (Navier theory)
■ No strain at the middle of the plane
■ Stresses in the normal direction can be ignored
■ A thin slab (span/depth > 10)
■ Constant slab depth
■ Small vertical displacements, w << h (Order theory)
The simplified analysis of flat plate type structures, such as slabs and footings, described in most codes (TMH 7, SANS 0100 and BS8110) ignore transverse shear effects and assume that plane sections remain plane.
Where shear effects become important (i.e. deep beams where span/effective depth < 2) the member can be modelled using equivalent truss analogy.
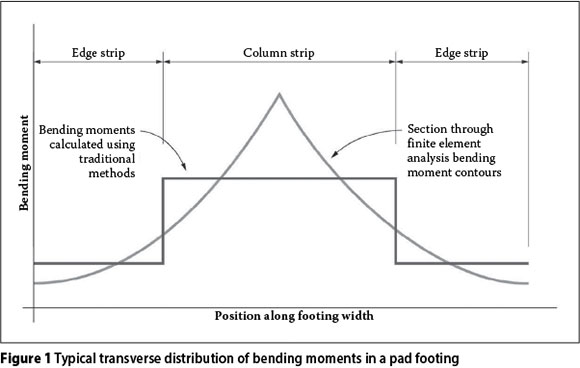
FE analyses can be either linear or non-linear. Linear FE analysis is the most commonly used type, but is limited in its capabilities as it does not take cracking and softening of the concrete into account (Rombach 2004). This type of analysis is suitable for an ultimate limit state design check, but cannot be used to check serviceability deflection and cracking. Non-linear FE analyses model the cracked behaviour of the concrete by means of an iterative process, but are complicated and time consuming to set up, and the software cost is significantly more than a linear FE program. In practice, flat plate type structures are generally designed using a linear FE analysis, and serviceability compliance done with 'rule of thumb' span to effective depth ratio checks. The main criticisms of linear FE analyses are its use of elastic material properties, which result in overestimated support moments and underestimated deflections (Jones & Morrison 2005), and an impractical required reinforcement contour output. Figure 1 shows the typical transverse bending moment distribution in a pad footing.
A paper by Brooker (2006) gives recommendations for interpretation of a linear FE analysis of flat slabs and advocates averaging the peak moment across a larger area. The recommendation is to use the total bending moment under the FE moment curve, and apportion it as per the detailing rules given in BS 8110 (1997). This requires three quarters of the moment to be resisted by the column strip, of which two thirds are apportioned to the inner column strip. The remaining moments are resisted by the outer column strip and the edge strip.
In this paper traditional methods of analysis of a simple pad foundation are compared with the linear finite element method and the results compared to experimental results. The following questions are answered:
■ Are the simplified methods adequate with respect to overall strength?
■ To what extent (width) may peak values be averaged or smoothed without compromising durability and serviceability?
■ How should the reinforcement obtained from linear FE methods be detailed?
The intention is not to do a theoretical assessment of the finite element method, but rather to provide a practical explanation of how it can be applied to general structural engineering, giving guidelines on the required amount of reinforcement and placement thereof to satisfy ultimate and serviceability limit states.
DESIGN OF FOOTINGS FOR FLEXURE
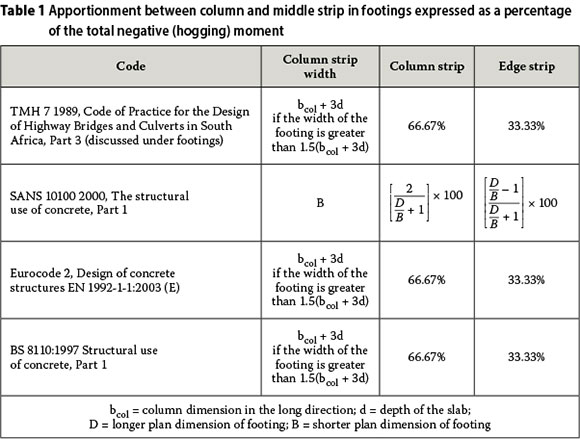
The prescribed method for designing footings in most codes is consistent with the design requirements for flat slabs. In the methods described in the South African bridge code, TMH 7 (1989), and the South African concrete design code, SANS 10100 (2000), vertical loads are resisted by an equivalent beam with the same width and depth as the footing. Bending moments are not constant across the width of a footing, and it has been experimentally shown (Regan 1981) that they are highest on a line connecting the columns, and then reduce transversely. For this reason most codes prescribe the design of footings by considering a "column" and a "middle" or "edge" strip, with the column strip resisting approximately two thirds of the load effect and the middle strip one third. This apportionment varies between codes, and Table 1 summarises what various codes require. This approach is aimed at satisfying serviceability requirements by placing more reinforcement in regions of higher bending moment and thereby reducing curvature. In this paper the authors refer to this method as the simplified design (SD) method.
FINITE ELEMENT METHOD
The significant advance in computer software technology in recent years has resulted in a surge in the use of finite element software to analyse the load effects in structures, and in particular flat plate type structures. The finite element method is an approximation in which a continuum is replaced by a number of discreet elements (Zienkiewicz et al 1976). Each component representing the system as a whole is known as a finite element. Parameters and analytical functions describe the behaviour of each element and are then used to generate a set of algebraic equations describing the displacements at each node, which can then be solved. The elements have a finite size and therefore the solution to these equations is approximate; the smaller the element the closer the approximation is to the true solution (Brooker 2006). The output from a linear finite element flat slab analysis is in the form of contour plots of stresses and moments. At a pinned support a section through these contour plots shows very large peaks in the stresses and bending moments. These peak bending moments can vary considerably depending on how the support conditions are modelled, and the element size. It is the opinion of the authors that the basics of using a linear FEM to analyse flat slabs is commonly understood by most designers. However, the modelling of column to flat plate connections is still open to numerous forms of interpretation and designer preference. The most common support models listed by Rombach (2004) are shown in Figure 2.
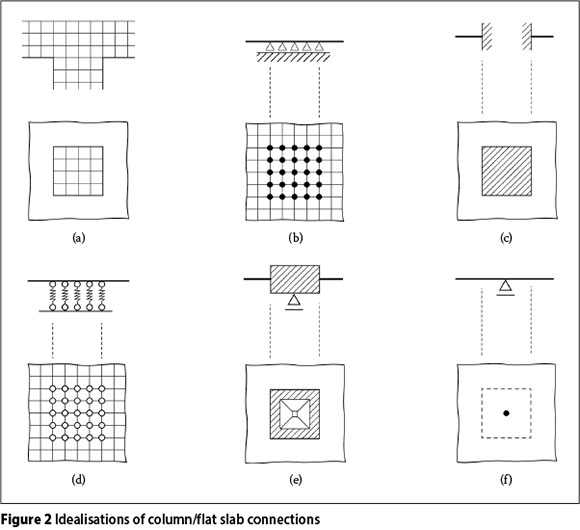
The models in Figure 2 can be interpreted as follows:
a. Full 3D continuum model - this models accurately, but is very time consuming.
b. Pinned supports over all nodes above the column - this is not suitable where the column is relatively flexible.
c. Encased supports assigned to the edge of the column in the shell model - this is not suitable where the column is relatively flexible.
d. Spring supports assigned to the column area in the shell model.
e. Rigid column head - this allows rotation of the column cross section and is suitable for flexible columns.
f. Point support at one node - this is the least accurate way of modelling a support, but probably the most commonly used.
Peak load effects (singularities) in elastic FE models are consistent with high elastic stresses. These peaks are reduced by yielding and cracking, or 'softening', of the concrete, and are never actually realised in real structures. In a two-dimensional analysis, the bending moment in a one-way spanning slab supported on pinned supports is generally smoothed using the following equation given by Rombach (2004):
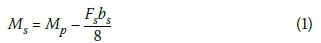
Ms = smoothed support bending moment
Mp = peak moment at the centreline of the support
Fs = support reaction
bs = width of support column
Singularities in FE analyses commonly occur where pinned supports and concentrated loads are modelled. The stress and bending moment contour output from a finite element modal will indicate peaks as shown in Figure 1.
Flat slab/plate behaviour is three-dimensional and much more difficult to analyse. It is widely accepted that these singularities in a flat slab analysis do not need to be considered in design. However, if this is assumed, then it is not clear to what extent a peak value obtained from a simplified FE model may be smoothed or averaged in a two-way spanning slab.
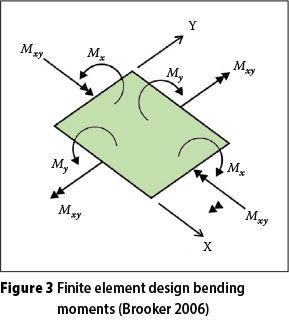
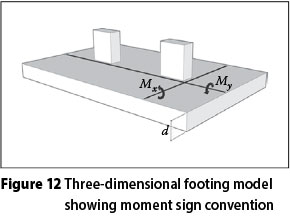
The typical output from a linear FE analysis of plate elements gives bending moments in the x and y directions Mx and My and a local twisting moment Mxy (see Figure 3). This twisting moment takes the three-dimensional behaviour of a flat slab into account. However, it does not act in the direction of the reinforcement. A popular method of including the twisting moment is known as Wood-Armer moments, and most design software will automatically calculate the Wood-Armer moments for the user. The Wood-Armer moments were developed to take complex loading into account, where the twisting moment Mxy needs to be considered (Denton & Burgoyne 1996). There are four components - top (hogging) moments in the x and y directions MxT and MyT, and bottom (sagging) moments in each direction MxB and MyB. This method is conservative and these moments form an upper limit envelope of the worst-case design moments. The four components can be used to calculate the required reinforcement for each of the reinforcement layers in a flat slab type structure. (Brooker 2006)
Modern codes allow for nonlinear analysis of reinforced concrete structures, but in practice such a complex analysis is seldom justified due to the large amount of work required and the cost of suitable software. Designs are usually based on linear-elastic material behaviour, assuming that the ductile properties of reinforced concrete allow for a limited redistribution of forces. Rombach (2004) states that the accuracy of such a simplified approach is generally sufficient. A conservative design approach is to have two slab models, one where columns are assumed to be pinned supports to determine the worst case sagging moment, and the second where the column supports are fixed to determine the worst-case hogging moments. Eurocode 2 does not prescribe a specific analysis or dictate how to interpret FE method load effects, which are open to a wide range of interpretations depending on how the column supports are modelled. Most commonly used FE packages give no clear directive on how to detail the reinforcement for flat slabs designed using FE. In general it is accepted that the design engineer will use the required reinforcement contour plots to decide how to place the slab reinforcement. It is, however, obvious that if the FE reinforcement contours are followed exactly this would lead to a very impractical reinforcement layout.
From the above it is clear that when designing and detailing, using FE analysis, a great deal is left up to engineering judgement.
FLEXURAL CAPACITY OF FOOTING CALCULATED BY THE SIMPLIFIED METHOD AND FINITE ELEMENT METHODs
In order to assess load effects in a linear elastic FE model, the design of a simple foundation pad footing was undertaken using simplified design methods (SD), and then compared with the results of a linear elastic FE model of the same footing. The moment variation at the critical design section (i.e. at the face of the column) for both methods of analysis was compared.
The analysis of a reinforced concrete pad footing is a multi-parameter problem. The stiffness of the flat slab is significantly influenced by the non-linear properties of concrete (i.e. cracking, which in turn influences member forces and deflections), and furthermore there is the added complexity of soil-structure interaction. The deformation characteristics of the soil can play a significant role in the distribution of the pressure and hence the load effect. For this exercise a conservative uniform bearing pressure under the footing was assumed, with the column acting as a support.
The moments obtained from the FE analysis are also very sensitive to how the supports are modelled in the FEM, and to the slab geometry. The effect of the support model was considered by analysing a square footing and changing the way the supports were modelled; and the effects of geometry was considered by analysing a combined loading rectangular footing and varying the thickness.
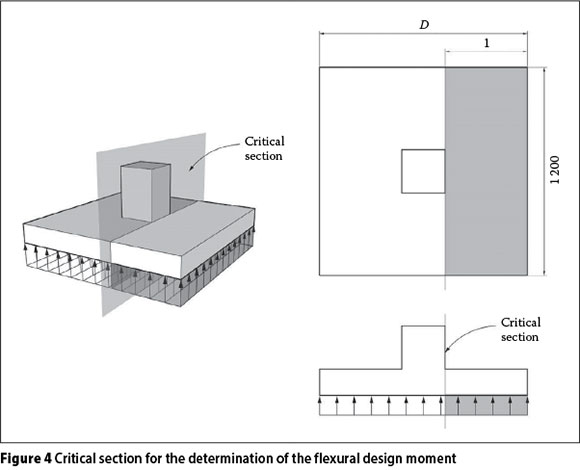
The conventional flat slab/footing design method described in the South African bridge code TMH 7 (1989) was used for the simplified method of design. The critical section for the design of the flexural hogging reinforcement in the x and y directions is taken at the face of the column (Figure 4). If the width of the footing is greater than 1.5(bcol + 3d) the code requires the slab to be split into column and middle strips, and designed and detailed accordingly, where bcol is the column width and d the effective depth to the tension reinforcement of the slab. The width of the column strip (w) is thus governed by the width of the column and the depth of the slab using the equation w = bcol + 3d. The column strip is then designed to resist two thirds of the total bending moment, and the middle strip is designed to resist one third of the total bending moment.
Finite element method: the effect of how the supports are modelled
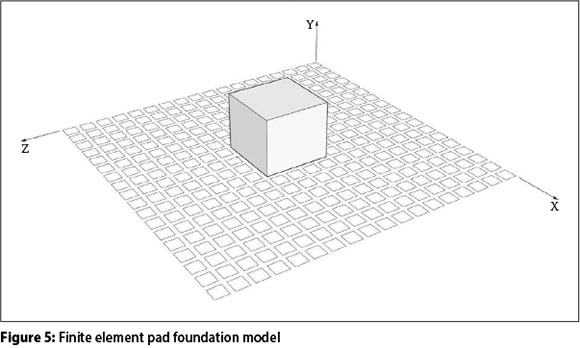
To get an indication of how the support model effects FE moments, a square footing was analysed with the different support conditions described by Rombach (2004), and the following noted for each, as summarised in Table 2 and shown Figure 5:
■ peak My axis moment (FE Mpeak)
■ peak Wood and Armer moment (FE Wood and Armer Mpeak)
■ total My axis moment - the sum under the moment curve at the face of the column (FE Mtotal)
■ total Wood and Armer moment - the sum under the moment curve at the face of the column (FE Wood and Armer Mtotal)
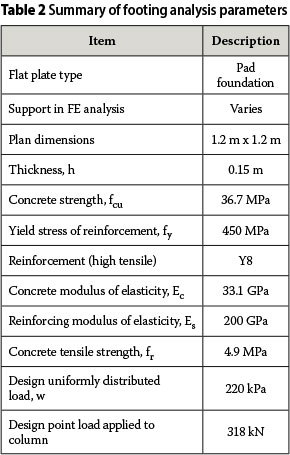
These peak and total moments were then compared to the SD column strip (SD Mcol) and total moments (SD Mtotal), as well as the concentrated SD column moment where two thirds of the column strip moment are concentrated into an inner column strip. The applied load corresponded to a typical pressure under a footing founded on dense sand (SANS 10160 1989).
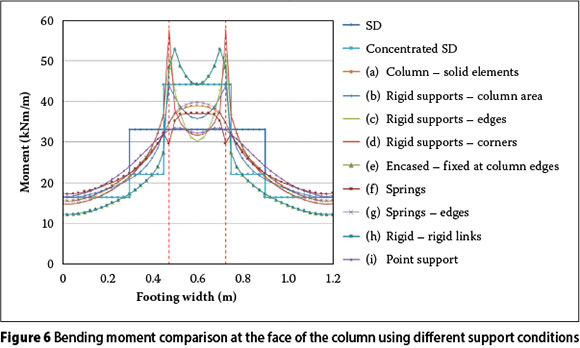
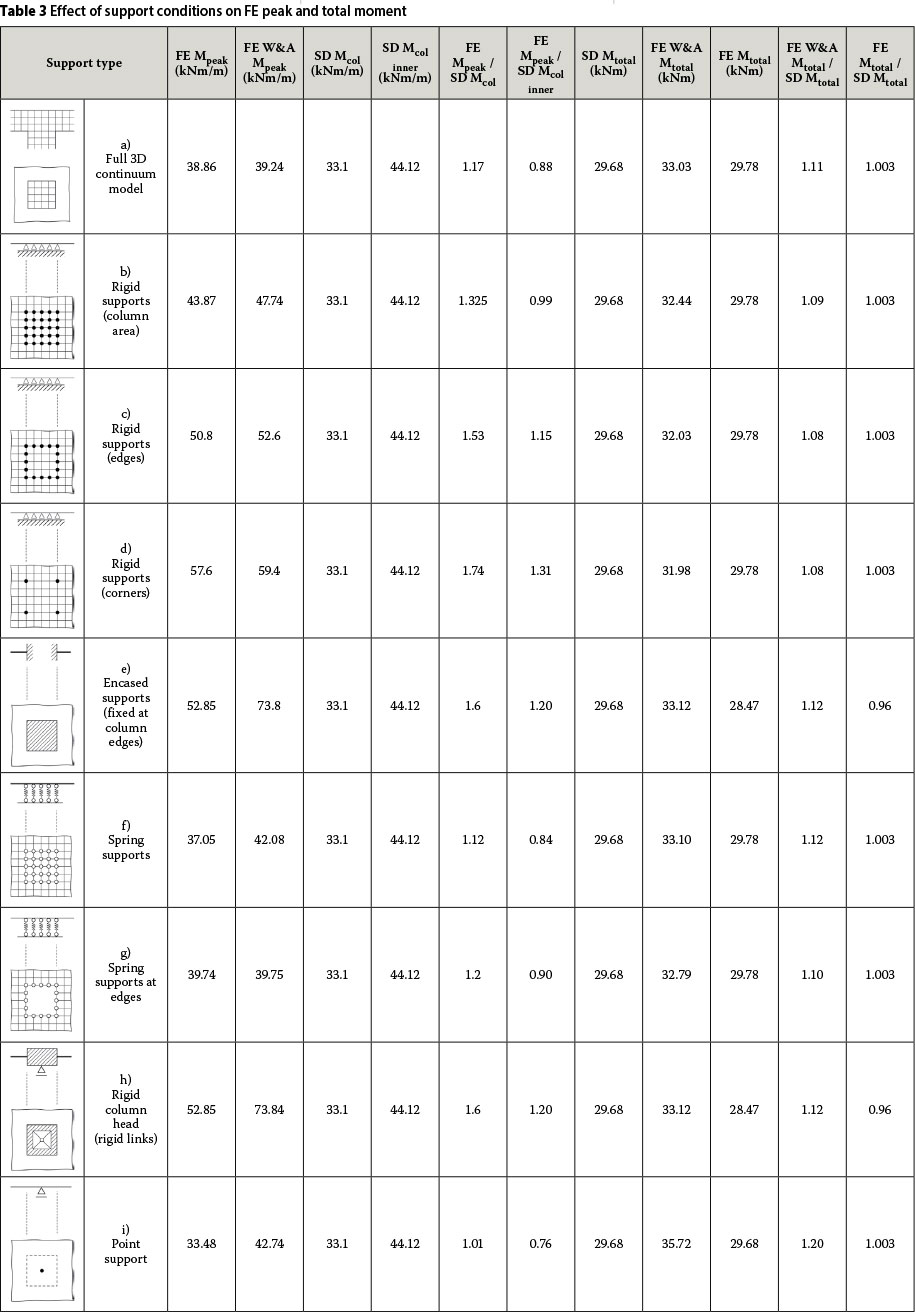
The pad foundation was modelled using the linear elastic FE program Prokon (2012), which is available to the majority of designers in South Africa (see Figure 5). It consisted of square 0.025 m x 0.025 m plate elements. The elements used to analyse the pad foundations are discreet Kirchoff-Mindlin quadrilaterals which provide good results for both thick and thin plates and are free from shear locking. Shear deformations are not considered here, as the cantilever span to depth ratio was relatively low. The following is a summary of the results shown in Figure 6 and Table 3:
■ For each different support model the total FE Mx or My moments were the same as the total SD moment.
■ The total FE Wood and Armer moment was greater than the SD moment (up to 20% more), because Wood and Armer moments are design moments, which include the Mxy twisting moment.
■ The peak FE Wood and Armer moments were higher than the peak FE Mx or My moments because of the Mxy twisting moment.
■ The Mxy twisting moments were significantly affected by how the supports were modelled.
■ Different supports (constraint) conditions caused the FE Mx or My peak moment to vary by as much as 36%.
■ Different supports (constraint) conditions caused the FE Wood and Armer peak moment to vary by as much as 88%.
■ The FE peak Mx or My moment can be more than double the SD column strip moment, depending on the support model.
■ The column strip moment approaches the FE peak moment if the concentrated column strip detailing rules specified in SANS 10100 Cl are used.
■ The most realistic moment distribution through the footing was obtained from modelling the columns support as a 3D continuum and modelling the edge of the column with springs. The peak moment is within 5% of the inner column strip-stepped SD method moment.
■ For both spring models the sensitivity of the model to support models was checked. In general a more realistic moment distribution was obtained as the stiffness of the spring decreased.
■ Ignoring the stiffness of the column, and modelling the support as pinned over the footprint of the column, show reverse curvature in the column area (see Figures 3 and 6). This reduction in moment over the column could be attributed to the fact that fixing the translational degrees of freedom on the column footprint prevents the movement at the nodes, while curvature within the element still occurs and therefore a reduced moment over the footprint of the column is observed. If the rotational degrees of freedom are also fixed in the column footprint, the moment over the column reduces to almost zero, which in reality is impossible.
Adequacy of the simplified method
The pad foundation requires bottom reinforcement in the transverse (x) and longitudinal (y) directions to resist the My and Mx hogging moments respectively.
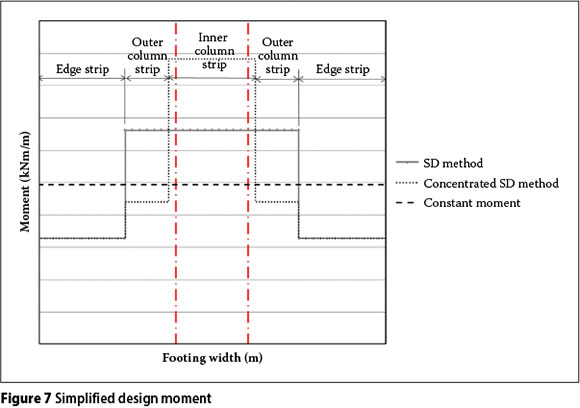
The Simplified Design (SD) method of analysis results in a constant moment, which is then split into a column strip moment and an edge strip moment for the pad foundation. The column strip can be stepped again by concentrating two thirds of the column strip moment into half of the column strip width to form an inner and outer column strip, according to the detailing rules of SANS 10100 Cl 4.6.5.4 (see Figure 7).
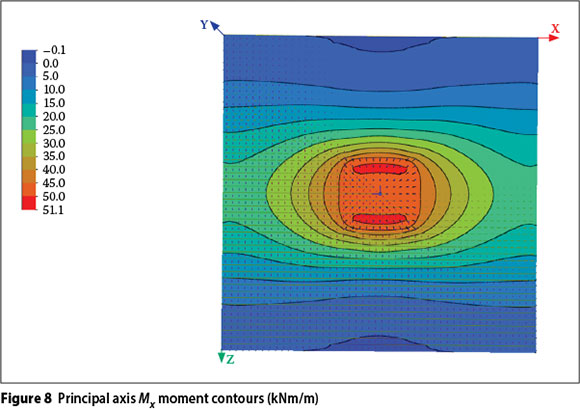
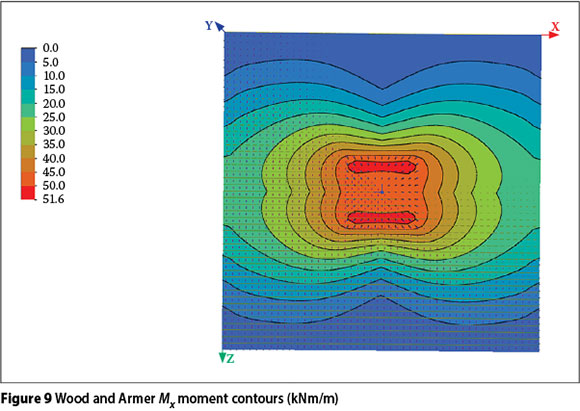
Considering the results of the FE analyses with different support constraints, the supports modelled with full 3D continuum are the most realistic and will be used for comparison with the SD analysis. The linear FE moment outputs are the Mx and My moments and the commonly used Wood-Armer moments, which include the twisting moment Mxy. Figure 8 shows the FE Mx moment contours for the hogging moments in the pad foundation. Figure 9 shows the FE Wood and Armer moment contours for the MxT and MyT hogging moments in the pad foundation.
A section taken through the SD and FE bending moment diagrams at the face of the column in the x and y directions is shown in Figure 10. Both the peak FE My and Mx hogging moments occur at the face of the column as there is a cantilever on both sides.
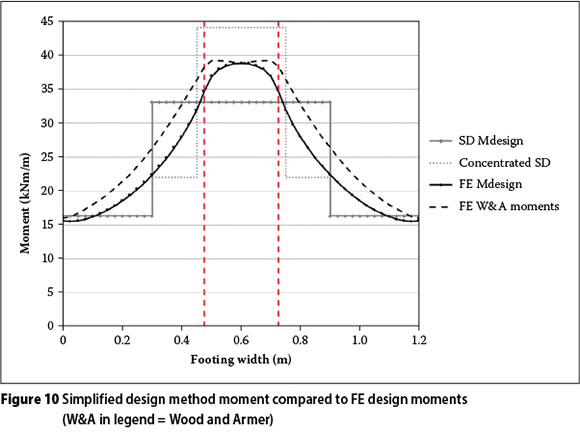
A section through the FE moment contours shows a realistic moment distribution, increasing to a maximum value at the support. To simplify this for the design of flat plates the column strip rules were introduced. The column strip requirement of the simplified design method ensures an increase in the design moment over the column strip as the peak moment in the FE analysis increases. As the FE peak moment increases, the SD column strip reduces, resulting in an increased SD moment.
The integration of the area under the moment diagram gives the total SD and FE load effect. The total SD design moment and total FE Mx moment are the same. This does not change with geometry or constraint model, as the principle of equilibrium has to apply. The total FE Wood and Armer design moments are, however, greater than the SD design moments. These moments were intended for use in design where the twisting moment needs to be considered, and, because of the unique solution and optimisation requirement, the capacity is always greater than the applied moment (Denton & Burgoyne 1996).
Finite element method: the effect of varying slab geometry
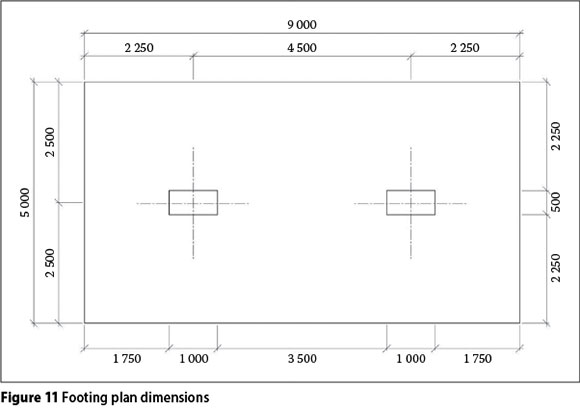
The influence of slab geometry on an FE analysis was considered by modelling a pad spread footing supporting two columns, and then varying the footing depth. The column size was calculated to meet the criterion of a 0.4fcu MPa maximum concrete stress, South African bridge code TMH 7 (1989), in order to maximise local effects. A range of footing depths (h) was then considered, varying in 100 mm increments from 400 mm to 1 300 mm, with a constant load effect. The chosen variation in footing depth covers a range of reinforcing percentages from maximum to nominal values. It also allows a study of the variation in peak values in FE methods. For the purposes of this study only resistance to hogging (negative) bending moments was considered. Resistance to the sagging (positive) moments, shear and punching forces was not investigated. The authors note that, as a footing's depth decreases, so punching becomes the governing failure mechanism. Figures 11 and 12 show the overall footing dimensions, and the analysis parameters are summarised in Table 4.
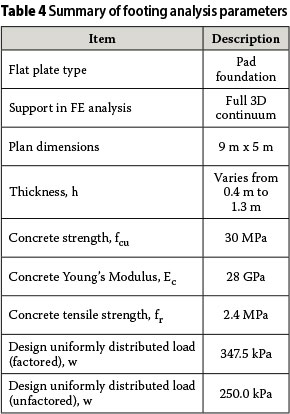
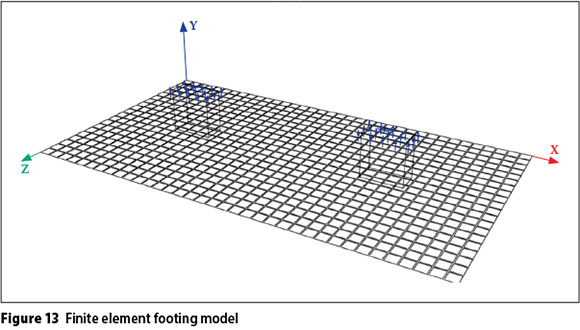
The pad foundation was modelled using the linear elastic FE program Prokon (2012), which is available to the majority of designers in South Africa. The model as shown in Figure 13 consisted of square 0.25mx0.25m plate elements (span/10 is recommended by Brooker (2006)) with column supports modelled as 3D continuum models, as this gives the most realistic moment distribution. The elements used to analyse the pad foundations are discreet Kirchoff-Mindlin quadrilaterals that provide good results for both thick and thin plates, and are free from shear locking. Shear deformations are not considered here in order to be consistent with the code requirements. The authors note that shear strain and deformation should be considered in thick pad foundations.
The worst-case negative (hogging) bending moment envelope along the face of the support in each direction was then used to design the required finite element model (FE) reinforcement.
Adequacy of the simplified method
The pad foundation requires bottom reinforcement in the transverse (x) and longitudinal (y) directions to resist the My and Mx hogging moments respectively, and top steel in the longitudinal (y) direction to resist the Mx sagging moment.
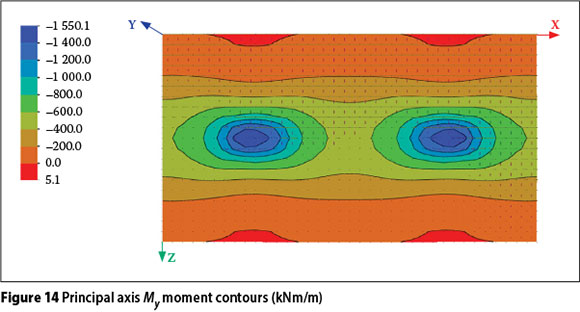
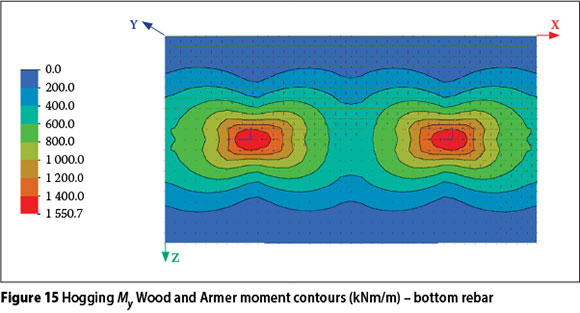
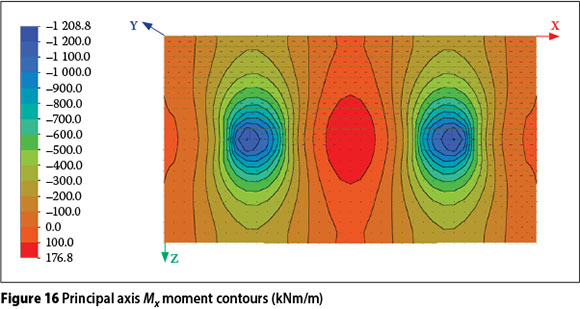
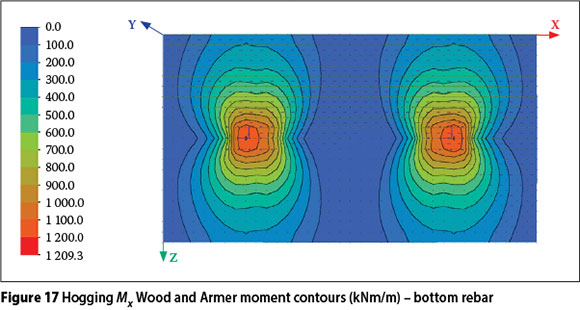
The linear FE moment outputs used were the Mx and My moments and the Wood and Armer moments. Figures 14 and 15 show the moment contours in the x and y directions for a pad foundation depth of 700 mm. Figures 16 and 17 show the FE Wood and Armer moment contours for the MxT and MyT hogging moments in the pad foundation with a depth of 700 mm. The effect of the twisting Mxy moment at the constraints (column) can be seen in the Wood and Armer moment contours.
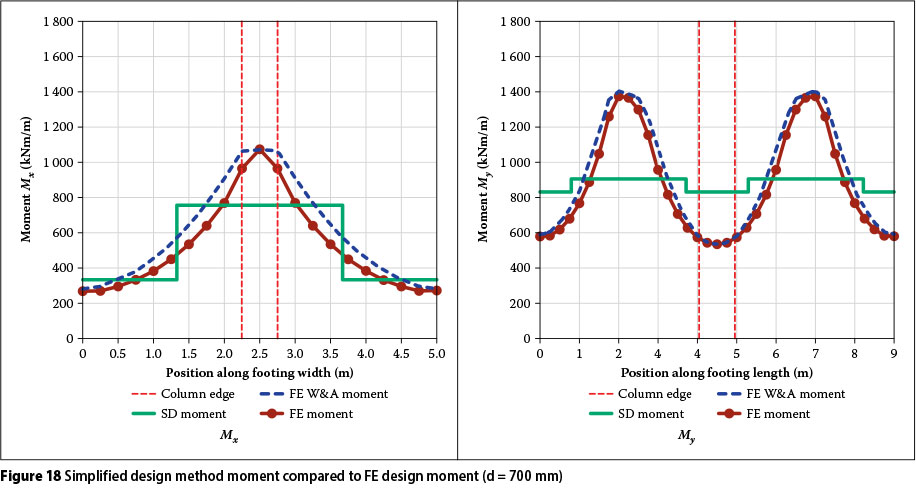
A section taken through the SD and FE bending moment diagrams at the face of the column in the x and y directions for pad foundation depth of 700 mm is shown in Figure 18. Both the FE Mx and My moments and the FE Wood and Armer moment are shown in the graph.
The peak FE My hogging moment occurs on the cantilever side of the column, whereas the peak FE Mx hogging moment is mirrored about the pad foundation centreline, as there is a cantilever on both sides on the column. The Wood and Armer design moments are greater than the SD design moments, as these moments include the twisting Mxy moment. Because of the unique solution and optimisation requirement, the Wood and Armer moment is always greater than the applied moment (Denton & Burgoyne 1996).
The peak FE moment Mpeak (maximum FE hogging moment) was affected by the curvature of the pad foundation. As the stiffness of the footing decreased the peak FE moment increased. The SD method of analysis results in a constant moment which is split into a column strip and edge strip moment. The column strip requirement ensures that as the FE peak moment increases with a footing depth decrease, the SD column strip reduces, resulting in an increased SD moment, thus ensuring that the increase in curvature is provided for.
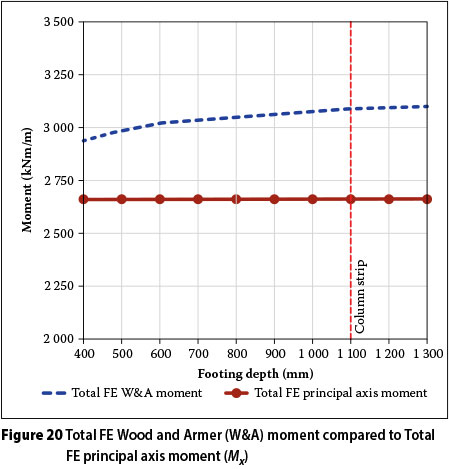
The integration of the area under the moment diagram gives the total SD and FE load effect. The total SD design moment does not vary with the change in pad foundation depth, as the self-weight of the pad foundation does not have an effect on the applied load effect. The total FE Mx and My moments are also constant with respect to change in footing depth, and are the same as the SD design moments. The FE Wood and Armer moments are affected by the twisting moment, which in turn is affected by how the constraints are modelled, and slab geometry. An increase in slab stiffness leads to an increase in the twisting Mxy moment. A comparison of the total FE Mx and My moments (equal to total SD moment) to the total FE Wood and Armer moment for My and Mx is shown in Figures 19 and 20.
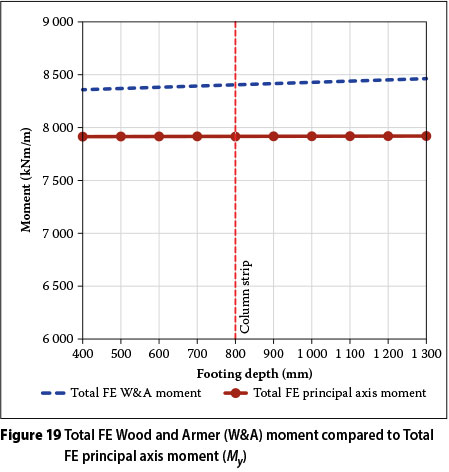
The total FE Wood and Armer moment My (cantilever) was approximately 5.6% greater than the total SD moment at a depth of 400 mm, increasing to approximately 6.9% at a depth of 1 300 mm, i.e. a 23% increase. The principal axis moment was the same as the SD moment.
The total FE Wood and Armer moment Mx (beam) was approximately 10.5% greater than the total SD moment at a depth of 400 mm, increasing to approximately 16.5% at a depth of 1 300 mm. The principal axis moments were the same as the SD moment.
Peak load effects (singularities) in linear FEM
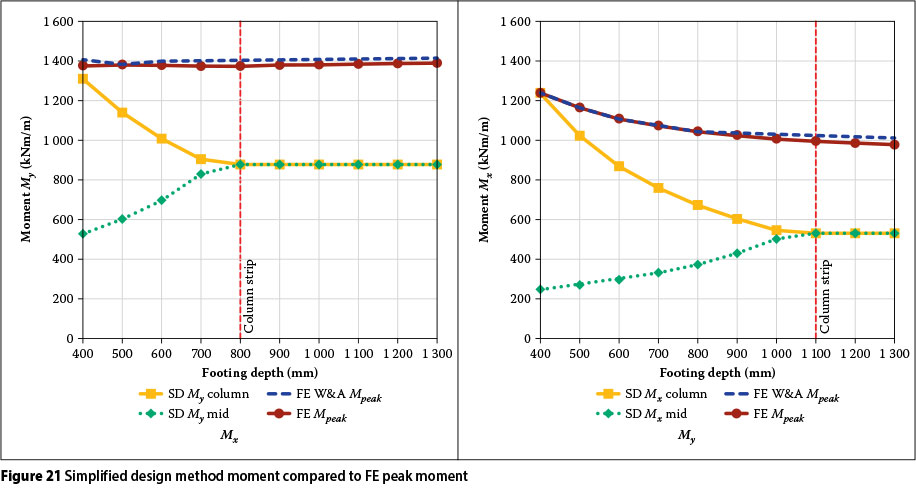
Figure 21 shows the change in the SD moment, column strip and middle strip, compared to the FE peak moment (Mpeak), as the depth of the pad foundation (h) varies. Both the Mx and My moments and Wood and Armer moments were plotted, and the SD requirement of differentiating between the column and middle strip is shown. For a pad foundation width of greater than 1.5 x (bcol + 3h), the transverse distribution of curvature has reduced sufficiently so as to not warrant the differentiation between the column and middle strip.
The Mx FE Mpeak moment remained constant as the footing depth increased. The My FE Mpeak moment decreased with the increase in footing depth, until a footing depth of 1 100 mm, and then levelled out.
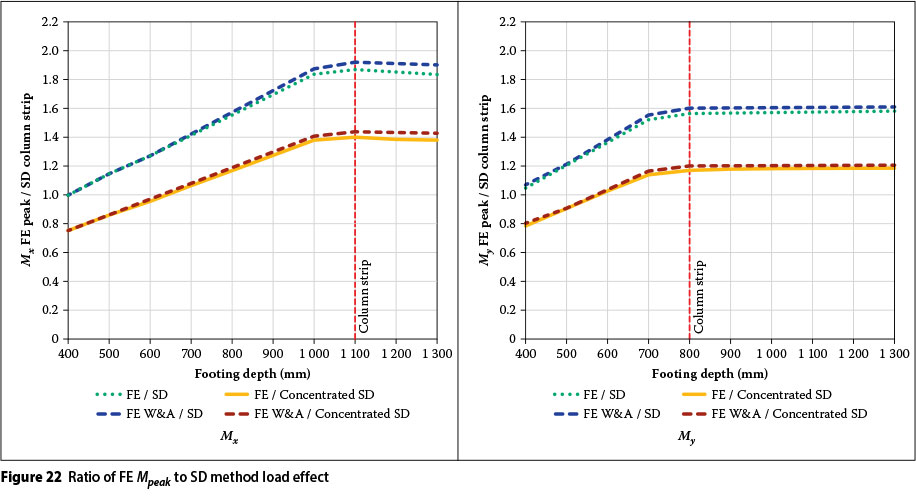
Figure 22 shows a comparison of the ratio of the FE Mpeak to the SD column strip moment and the SD concentrated column strip moment.
Both the Mx and My FE Mpeak / SD Mcolumn ratios approach one as the stiffness of the slab decreases, and levels out to a constant value at a depth consistent with the limit for the column strip of the code. Again, showing that the SD column strip requirement ensures that as the FE peak moment increases with a footing depth decrease, the SD column strip reduces, resulting in an increased SD moment, thus ensuring that the increase in curvature is provided for.
Observations from analysis
From the above numerical analyses the following can be concluded about the simplified method overall strength, finite element peak values and detailing according to linear FE methods:
■ The total FE Mx and My moments are the same as the total SD moment.
■ Both the simplified method and finite element analysis and reinforcement layouts provided adequate and similar flexural capacity.
■ The FE peak Mx or My moment can exceed the column strip moment by a significant amount, depending on how the support constraints are modelled. It is, however, commonly assumed that this peak is reduced by cracking of the concrete and yielding of the reinforcement.
■ The peak and total Wood and Armer moments obtained from a linear FE analysis are significantly influenced by how the supports are modelled. This is because of the change in the twisting moment with the support/constraint model.
■ The peak and total Wood and Armer moments obtained from a linear FE analysis is affected by the change in plate thickness - this is because of the change in the twisting moment.
■ By concentrating two thirds of the column strip reinforcement into an inner column strip the SD design moment approached the FE peak moment.
EXPERIMENTAL INVESTIGATION
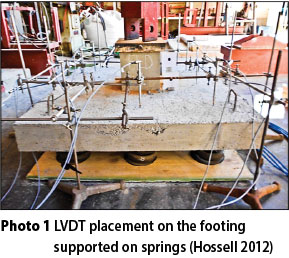
Preliminary experiments carried out at the Department of Civil Engineering at the University of Pretoria support the above numerical analysis. Hossell (2012) undertook tests on reinforced concrete footings supported on springs where two specimens were designed and reinforced, one according to the SD method and the other according to the linear FE method. The influence of the reinforcement layout on the response of the footing to ultimate limit state and serviceability limit state characteristics was observed.
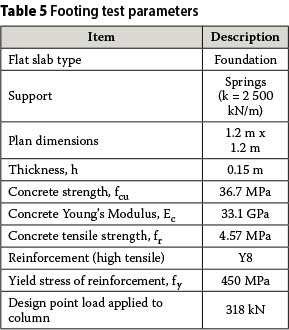
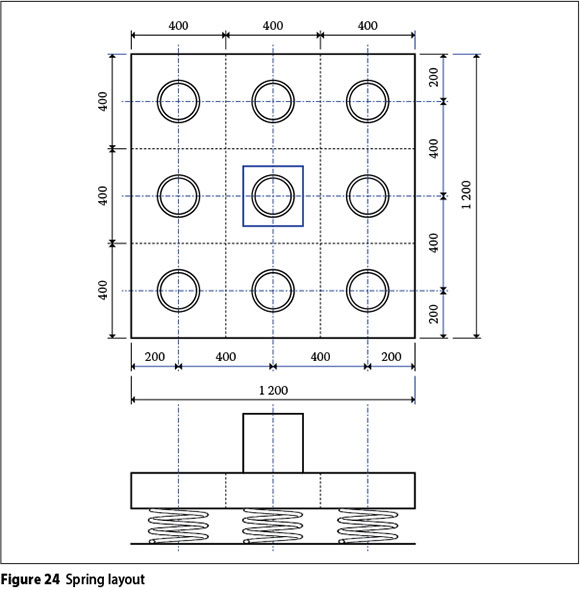
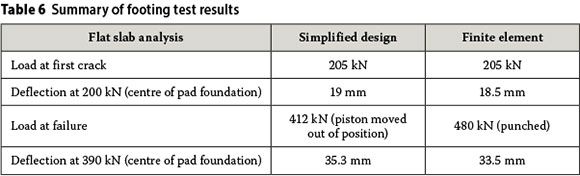
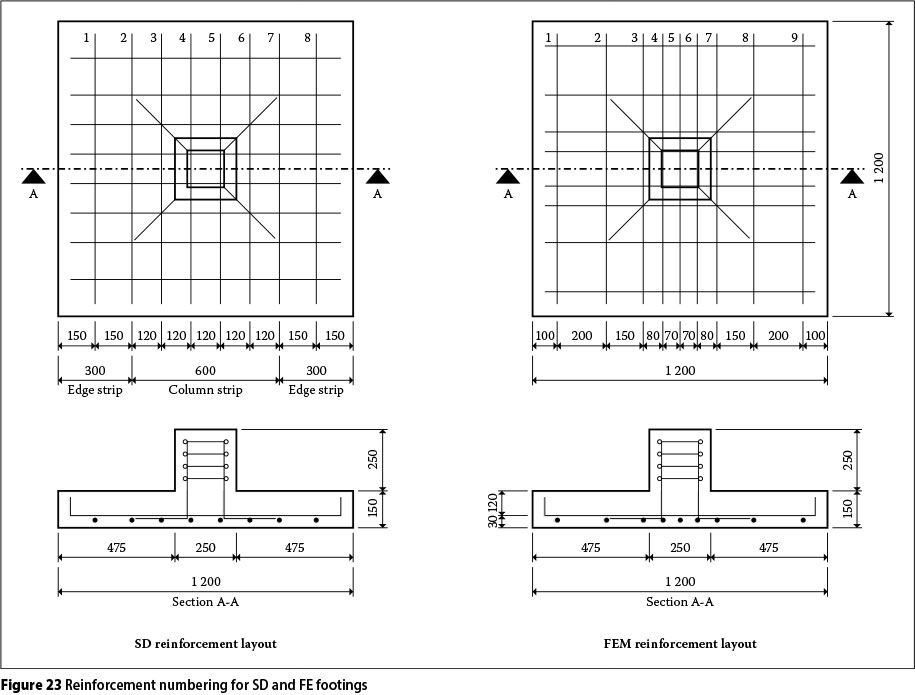
The spring-supported footing test setup is shown in Photo 1, with the springs simulating the founding support conditions. The test parameters are shown in Table 5 and the reinforcement and spring support layouts are shown in Figures 23 and 24. Footing (a) was reinforced according to an SD analysis, and Footing (b) according to an FE analysis. Strain gauges were placed on the flexural reinforcement bars at the critical design section along the face of the column, and LVDTs at the centre of each support spring were used to measure the displacement of the footing. The strain in the reinforcement across the footing was logged at a rate of 1 Hz. The change or variation in strain is shown in Figures 25, 26 and 27; the footing displacement is shown in Figure 28; and a summary of the footings response to the load is included in Table 6. It should be noted that, as a result of using the Wood and Armer moments to calculate the FE reinforcement, the FE footing required slightly more reinforcement than the SM footing.
Strain in reinforcement with load
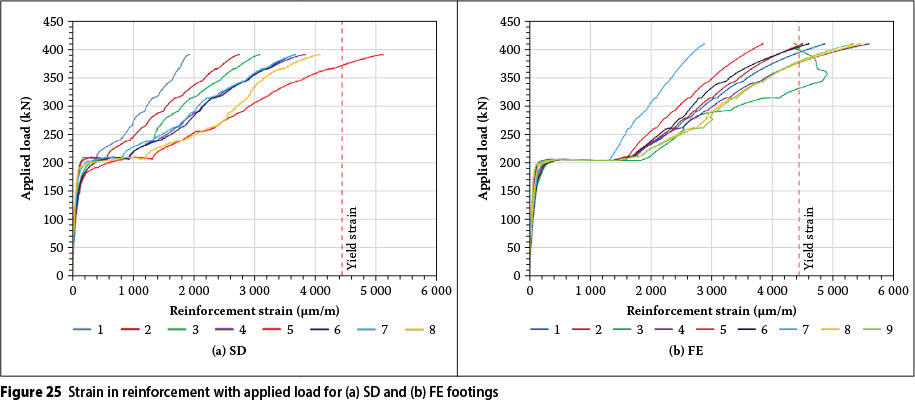
Figure 25 shows that the first crack (sudden "jump" in strain) in both footings occurred at very similar loads, as this is primarily dependent on the tensile strength of the concrete. The SM footing test had to be stopped at a load of 412 kN, before failure, as the testing machine piston moved out of alignment. The FE footing failed in punching at 480 kN. At the design load of 318 kN the reinforcement strain in both footings was well below the yield strain. The yield strain was calculated using the 0.2% proof stress method described in TMH 7 (1989).
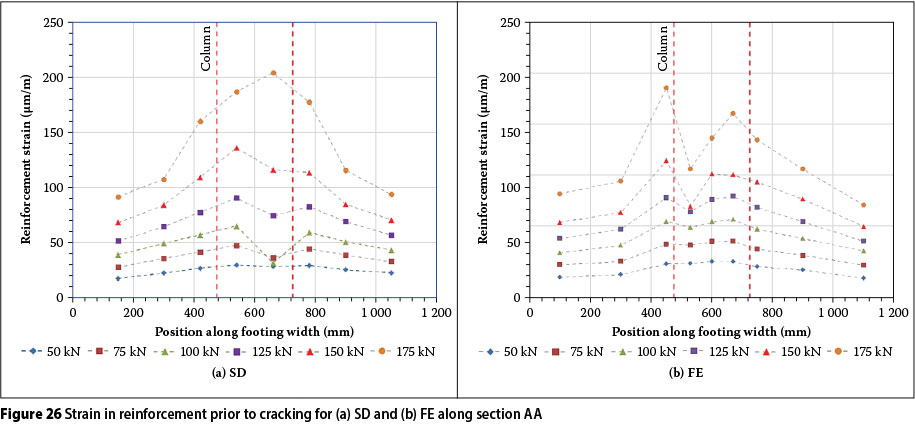
Transverse variation in reinforcement strain prior to cracking
Figure 26 shows that prior to the concrete cracking the reinforcement at the face of the footings (i.e. design section) is strained the most. The SD footing had a greater variation in strain between the reinforcement under the column and the reinforcement at the edge, than the reinforcement in the FE footing. The reinforcement strain in the FE footing appears to be more uniform across the footing width than when compared with the SM footing.
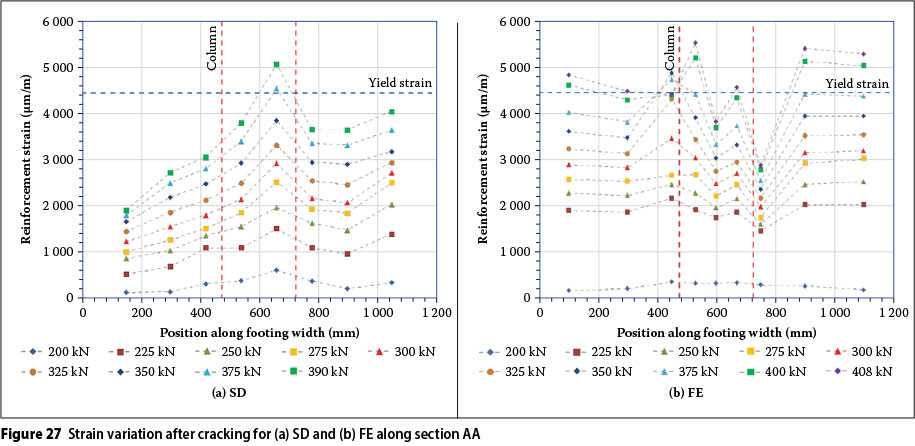
Transverse variation in reinforcement strain after cracking
Flexural cracking occurred at an applied load of approximately 205 kN in both footings, as indicated by the sudden increase in strain in the reinforcement shown in Figure 25. The increase in strain in the central reinforcement shown in Figure 27 indicates the formation of cracks at the face of the column, and shows the transfer of force from the concrete to the reinforcement.
Once the concrete cracked, a greater variation in strain was observed in the SD footing, compared to the FE footing, shown in Figure 27. With a larger variation in strain the reinforcing bars beneath the column in the SD footing strained more than the bars towards the edge; indicating that fewer, but larger, cracks developed when compared to the FE footing. The FE footing showed a more uniform variation in strain, indicating that more cracks had formed, but because of the lower strain levels these cracks were smaller.
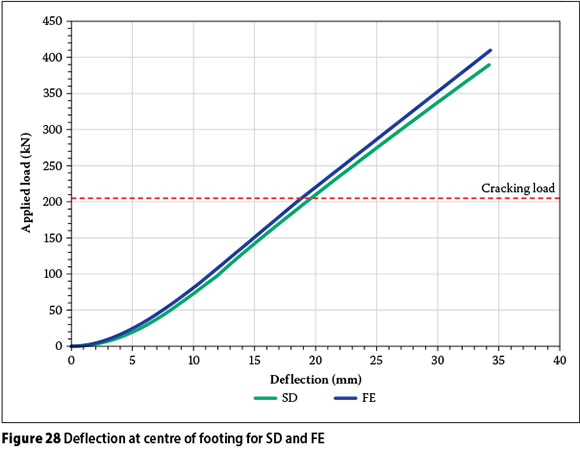
Load-deflection curves
Figure 28 shows the load deflection curves at the centre of the two footings. Cracking and flexural failure can be seen by the change in gradient of the curves. First crack occurred at very similar loads and deflections for both the FE and SD footing.
Observations from experimental work
From the above experimental work the following can be concluded regarding SD and FE analysis and design:
■ Both the simplified method and finite element designs provided adequate and similar flexural capacity.
■ Detailing reinforcement in accordance with the variation in moments produced from a linear finite element analysis results in a more uniform distribution of strains across the width of the footing before and after cracking occurs.
■ Cracking would appear to be controlled by reinforcing to follow the finite element peak moment.
■ There is no apparent benefit in controlling deflection by reinforcing to follow the FE peak moment.
CONCLUSIONS
Total resistance achieved with FE design compared to that of traditional methods
Both the numerical analysis and experimental work support the conclusion that at the ultimate limit state there is very little difference, if any, between a flat plate analysed and reinforced using the SD method and one analysed with an FE model.
For each different flat plate structure modelled, irrespective of the support model, the total FE Mx and My moment was the same as the total SD moment. The total FE Wood and Armer moment was always greater than the SD moment, i.e. design moments which include the Mxy twisting moment.
To what extent the peak moment in an FE analysis can be ignored
The support (constraint) model has a significant effect on peak moments calculated in an FE analysis. If the stiffness of the column/support was taken into account, peak moments were not observed in the FEM analysis and a very realistic moment distribution was obtained (Figure 29). Pinned supports are not advised, as the stiffness of the support must be taken into account.
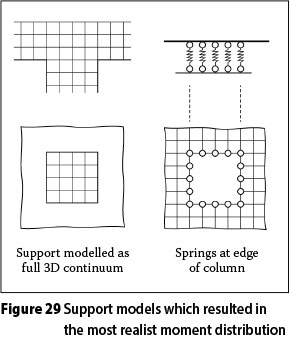
The peak moment from the FE model may exceed the SD column strip moment. However, this peak is reduced by cracking of the concrete and yielding of the reinforcement. This may be compensated for by considering a column strip with a reduced width.
Serviceability performance of an FE design
Detailing reinforcement to follow the FE moments at the serviceability limit state results in a more uniform distribution of strain across the width of the slab, and therefore more, but smaller cracks.
The reinforcement distribution according to the FE method does not have a significant effect on the overall stiffness of the slab, and therefore does not appear to influence the deflection of the slab. This was shown in both the experimental testing performed on the signal column footing and on the flat slab.
Detailing of reinforcement for an FE design that is practical and acceptable to construction companies
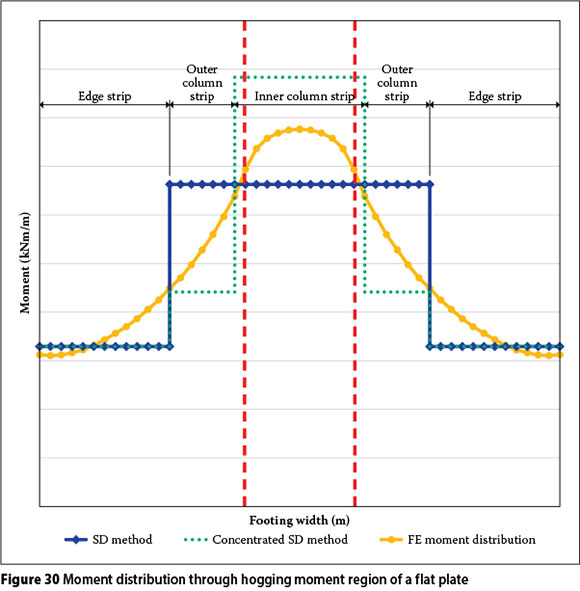
The principal advantage in detailing reinforcement using a linear FEM is related to crack control. In order to maintain a practical reinforcement layout Brooker's (2006) recommendations for using the total bending moment under the FE moment curve and then concentrating the reinforcement as for the inner and outer columns strip detailing rules given in SANS 10100-1 (2000) Clause 4.6.5.4, is supported. In pad foundations where the column strip width is a function of the pad foundation depth, the percentage of reinforcement apportioned to the column and edge strips would need to be adjusted in order to ensure that the outer column strip has sufficient reinforcement (see Figure 30).
ACKNOWLEDGEMENTS
Shane Hossell is gratefully acknowledged for his contribution to this paper.
REFERENCES
BS 1997. BS 8110:1997: Structural use of concrete. Part 1: Code of Practice for Design and Construction. London: British Standards Institution. [ Links ]
Brooker, O 2006. How to design reinforced concrete flat slabs using finite element analysis. Camberley, UK: The Concrete Centre. [ Links ]
Burgoyne, C J 1996. Are structures being repaired unnecessarily? The Structural Engineer, 74(9): 22-26. [ Links ]
Burgoyne, C J & Denton, S R 1996. The assessment of reinforced concrete slabs. The Structural Engineer, 74(9):147-152. [ Links ]
Carlton, D 1993. Application of the finite element method to structural engineering problems. The Structural Engineer, 71(4):55-59. [ Links ]
Eurocode 2 2003. BS EN 1992-1-1:2003. Design of concrete structures. Part 1-1: General - Rules and rules for buildings. Brussels: European Committee for Standardisation. [ Links ]
Hossell, S M 2012. Comparison of different methods of analysis, design and detailing of reinforced concrete footings. Project report for BSc (Civil Engineering), Pretoria: University of Pretoria. [ Links ]
Jones, A & Morrison, J 2005. Flat slab design: Past, present and future. Structures & Buildings, 158(SB2):133-140. [ Links ]
Park, R & Gamble, W L 2000. Reinforced concrete slabs. New York: Wiley. [ Links ]
PROKON Software Consultants Ltd. 2012. PROKON suite of structural analysis programs Pretoria, South Africa: PROKON. [ Links ]
Regan, P E 1981. Behaviour of reinforced concrete flat slabs. London: Construction Industry Research and Information Association (CIRIA), Report 89. [ Links ]
Rombach, G A 2004. Finite element design of concrete structures. London: Thomas Telford. [ Links ]
SANS 1989. SANS 10160:1989. The general procedures and loadings to be adopted in the design of buildings. Pretoria: South African Bureau of Standards, p 123. [ Links ]
SANS 10100:2000 (SANS 2000). The structural use of concrete, Part 1. Pretoria: South African Bureau of Standards. [ Links ]
TMH7 1989 (CSRA - Committee of State Road [ Links ]
Authorities). Code of practice for the design of highway bridges and culverts in South Africa, Part 3. Pretoria: Department of Transport, Technical Manuals for Highways. [ Links ]
Zienkiewicz, O C, Brotton, D M & Morgan, L 1976. A finite element primer for structural engineers, The Structural Engineer, 54(10):389-397. [ Links ]
 Contact details:
Sarah Skorpen
Department of Civil Engineering
University of Pretoria
Pretoria
0002
South Africa
T: +27 12 420 2196
F: +27 12 362 5256
E: sarah.skorpen@up.ac.za
Contact details:
Nick Dekker
Department of Civil Engineering
University of Pretoria
Pretoria
0002
T: +27 12 420 2179
F: +27 12 362 5256
E: ndekker@postino.up.ac.za

SARAH SKORPEN Pr Eng, MSAICE, MIStructE, is a lecturer in the Department of Civil Engineering at the University of Pretoria where she teaches strength of materials and steel design to undergraduates. She spent nine years working for the Buildings and Structures division of SSI (now Royal HaskoningDHV), and joined the University of Pretoria two years ago. She has obtained an MEng in Structural Engineering and is currently working on her PhD.

PROF NICK DEKKER received the degrees BScEng, BEng Hons and MEng from the University of Pretoria and a PhDfrom the University of the Witwatersrand. He spent most of his professional career with BKS (now AECOM) where he was responsible forthe design of a wide range of structures, including bridges, industrial and commercial buildings, shopping centres, sports centres and process buildings. In 1996 he co-founded the practice Dekker & Gelderblom, and was also appointed as Professor of Structural Engineering at the University of Pretoria. He received an NRF (National Research Foundation) rating in 1997. His fields of interest include structural design in steel, pre-stressed concrete and reinforced concrete.

