


Services on Demand
Article
 English (pdf)
 Article in xml format
 Article references
Indicators

Related links
-
 Cited by Google
 -
 Similars in Google
Share

 Permalink
Journal of the South African Institution of Civil Engineering
On-line version ISSN 2309-8775
Print version ISSN 1021-2019
J. S. Afr. Inst. Civ. Eng. vol.56 n.1 Midrand Jan. 2014
TECHNICAL PAPER
Proposed guideline for modelling water demand by suburb
M L Griffioen; J E van Zyl
ABSTRACT
This study investigated factors affecting the average domestic water demand of a large number of suburbs in South Africa. Suburbs form an ideal demand grouping since they tend to have similar stand areas, climatic conditions and user characteristics. In addition, since properties within a suburb are close to one another, it may be reasonably assumed that differences in user demands will cancel one another out so that a designer only has to cater for the average demand of the suburb. A database on measured domestic water demands was used to determine the average of the Annual Average Daily Demand (AADD) for a large number of suburbs in South Africa (i.e. the average AADD per suburb), and this data was linked to census and climate data. The combined data set was then subjected to various regression analyses to identify the most important influencing factors. Stand area was found to be the most important influencing factor, validating the approach followed by the current South African design guidelines. However, the current guidelines were found to exclude a large number of measured data points, and thus a new, more comprehensive design envelope is proposed.
INTRODUCTION
Domestic water demand is stochastic in nature, and is influenced by a large number of factors. These factors may be categorised as socio-economic (household size, income, stand area, social status, number of household appliances, social patterns, public and school holidays, tourism and water price), climatic (temperature, rainfall, humidity, time since last rainfall and the number of preceding hot days) and structural (number of users, water metering, plumbing fitting properties, pressure and network capacity) (Van Zyl et al 2008b).
The most basic descriptor of domestic demand is the Average Annual Daily Demand or AADD. When designing or analysing water distribution systems, parameters such as the design peak demand and reservoir capacity are based on the AADD. Thus it is important for engineers to have accurate estimates for the AADD of a system they are working on. The AADD may be estimated from measured demands of similar areas, or from design guidelines.
The South African design guideline for AADD (the "Red Book") provides an upper and lower bound based on stand area (CSIR 2003) as shown in Figure 1. The design engineer estimates the AADD for a particular area between these bounds by taking factors such as climate, income and local conditions into account.

Municipal data management tools have become common in South African municipalities, and this has given researchers access to large amounts of municipal consumer water meter data. A number of previous studies have been done on domestic water consumption based on this data.
Garlipp (1979) investigated a number of parameters influencing water consumption in Pretoria, Bloemfontein, Cape Town, Port Elizabeth and Durban. Parameters influencing the domestic consumption the most were household size, prolonged high temperatures, stand area and income. In 1996 Stephenson and Turner investigated different income users in 14 areas in Gauteng, and concluded that the stand area exerted the most influence on domestic consumption. This study also found that income, population density and the level of service of water supply, as well as the housing type, were parameters influencing the domestic water consumption. Van Vuuren and Van Beek (1997) investigated both domestic and non-domestic water consumption of areas in Pretoria. The study found that high-income households consumed significantly more water than low-income consumers, and that their demands showed higher sensitivities to climatic variations due to large outdoor consumption. The study also found that the South African design guidelines (CSIR 2003) over-estimated domestic water consumption for Pretoria. A study by Van Zyl et al (2003) found that the price of water, water pressure, household income and stand area influenced residential water consumption. The data consisted of residential areas in Gauteng only.
Van Zyl and Geusteyn (2007) performed an extensive study to develop a national water consumption archive for all South African municipalities that had implemented the SWIFT software. A study by Van Zyl et al (2008a) used the archived data to analyse the demands of individual domestic consumers in South Africa. The study found that inland consumers tend to use more water than those in coastal regions. The study also concluded that stand area was the best parameter to use when predicting domestic water demand.
Jacobs et al (2004) proposed a new guideline for domestic water demand estimation by analysing over 580 000 individual domestic users throughout South Africa. Stand area was used as influencing parameter, and the study found the current South African design guideline to be conservative. Husselmann and Van Zyl (2006) investigated the effect of stand area and stand value (as surrogate for income) on water demand for residential stands in Gauteng. The income (stand value) varied a lot, and stand area was found to be most influential. It was found that the South African design guideline underestimates the water demand for stand areas between 300 and 700 m2, and that it overestimates the water demand for stand areas larger than 700 m2. Finally, Jacobs et al (2012) investigated residential water demand in nine service delivery areas in Ekurhuleni. A design guideline for water demand of 10.4 kl/d/ha was proposed after considering the average residential stand area of 70 suburbs in Ekurhuleni.
Studies of individual water demands are useful, but have limited application to the design of water distribution systems, since supply areas are not uniform, but consist of a mix of higher and lower consumption users. It is necessary to include the typical mix of consumers when estimating the AADD, which was done in this study by considering the AADD of suburbs rather than individual consumers.
Suburbs are seen as a suitable unit for analysing AADD, since they tend to group consumers of similar socio-economic conditions and are similar in many parameters, such as stand area, climate and pressure.
Importantly, since consumers in a suburb are close together and share the same pipe network, variations in demand between individual consumers will tend to cancel one another out.
The aim of this study was to analyse the water demand of residential consumption in a large number of suburbs throughout South Africa, in order to determine the most important factors influencing demand and to propose a new design guideline based on these results. The next section describes the data used, linking of consumption data to climatic and socio-economic parameters, and the measures taken to ensure the integrity of the data. This is followed by a regression analysis of the data and the ranking of the parameters that most affect water demand. Finally, the average water demands by suburb are plotted against the average stand area and used as the basis for a new proposed design guideline for AADD.
DATA
Municipal water bills are based on consumer water meter readings taken at regular intervals. The past decade has seen significant software developments that now give researchers access to water consumption data held in treasury databases (Jacobs et al 2004). One such tool is SWIFT a software package that has been implemented by a number of municipalities throughout South Africa, including most of the metropolitan municipalities (GLS 2007; Jacobs et al 2012).
The data set used as the basis for this study is the same as that used in two previous studies (Van Zyl et al 2008a; Van Zyl et al under review) on domestic and non-domestic water demand respectively. It includes consumption data of forty-eight municipal treasury databases totalling more than 2.5 million records in four metropolitan areas (Johannesburg, Tshwane, Ekurhuleni and Cape Town) and 151 other towns. The data is described in detail in Van Zyl et al (2008a). Only suburban residential stands were considered, and thus non-domestic and high-density developments, such as blocks of flats, were excluded.
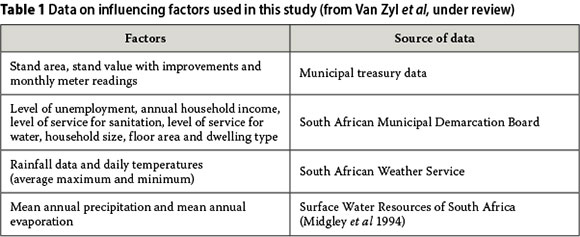
Information on possible factors influencing domestic demand was collected from various sources and linked to the demand data to allow correlations to be analysed. The climatic data, i.e. mean annual precipitation (MAP), mean annual evaporation (MAE) and temperatures, were linked to the water demand data on the basis of municipality, and, where higher resolution was possible, on suburb or group-of-suburbs level. Table 1 shows the factors collected in this study and their sources.
The AADD for each consumer in the database was first determined based on twelve consecutive months' demand values. This means that seasonal demand variations do not influence the values, and errors due to differences in reading dates or erroneous reading would generally be small. The meter readings exclude water supplied from other sources, such as boreholes or grey water, as well as leakage from the distribution system.
To ensure the integrity of the data, three data cleaning phases were implemented. In the first phase, SWIFT adjustment codes (assigned where SWIFT identifies certain anomalies or errors in the data) were used to exclude records with inconsistent readings or dates due to meter replacements or clock-overs, and records with less than 12 consecutive months of data. In addition, records or stands identified as unmetered, vacant, prepaid, duplicate (including more than one type of land use) or non-domestic were excluded. After this phase the database consisted of 1 353 740 records grouped into 1 753 suburbs.
In the second data cleaning phase, stands with unrealistically high or low stand areas/ values were excluded, as described in Table 2. Note that the stand valuations were based on historic values and do not reflect the actual market value of the properties, which is likely to be significantly higher.

After the second phase, the database consisted of 1 218 053 records grouped into 1 497 suburbs.
In the third data cleaning phase, suburbs that could not be linked to census data, or that contained less than 100 consumers, were removed, leaving 744 852 records in 739 suburbs. This data formed the basis for the statistical analysis of water demand by suburb.
Finally, in order to allow a regression analysis to be conducted, suburbs with incomplete data records were removed, leaving 467 026 residential users in 459 suburbs. For each of these suburbs, the following data was available:
■ Location (municipality and suburb)
■ Average AADD
■ Average stand area
■ Average stand value
■ Type of water supply (piped water, borehole, spring, etc)
■ Type of sanitation (sewer line, septic tank, chemical toilet, etc)
■ Type of building
■ Type of area (urban, smallholding, farm, etc)
■ Average income
■ Racial distribution (fractions of consumers that were black, white, Indian, etc)
■ Average number of rooms per house
■ Mean annual precipitation
■ Average maximum daily temperature
■ Average minimum daily temperature
■ Mean annual evaporation
DEMAND CHARACTERISTICS
The demand data resulting from the third cleaning phase was analysed to determine the characteristics of domestic water demand in South Africa when grouped by suburb. Table 3 summarises the main statistical descriptors for both the AADD per property, and AADD per unit area. The latter is important, since outdoor consumption is strongly linked to stand area and forms an important component of domestic consumption.
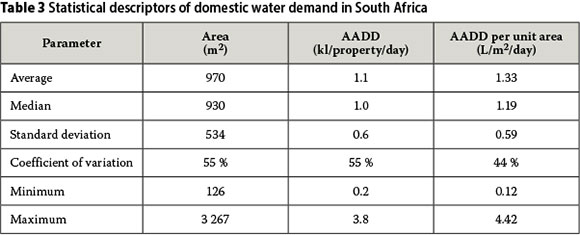
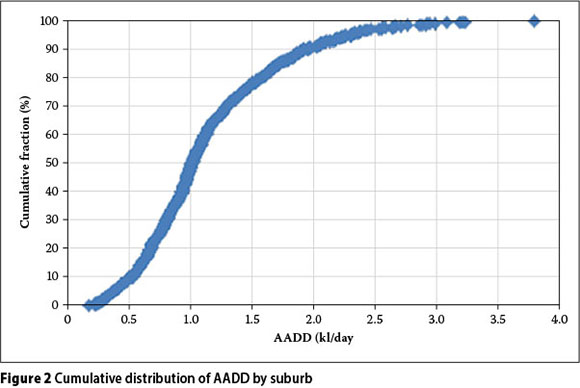
The cumulative distribution of the AADD by suburb is shown in Figure 2. The average AADD is 1 100 ℓ/property/day, which is reasonably close to the median value of 1 000 ℓ/property per day. The AADD data shows a large variation with a coefficient of variation of 55% and ranging between 200 and 3 800 ℓ/property/day. The suburbs with the highest AADD were found to be characterised by high-income consumers on large stands, typically larger than 2 000 m2.
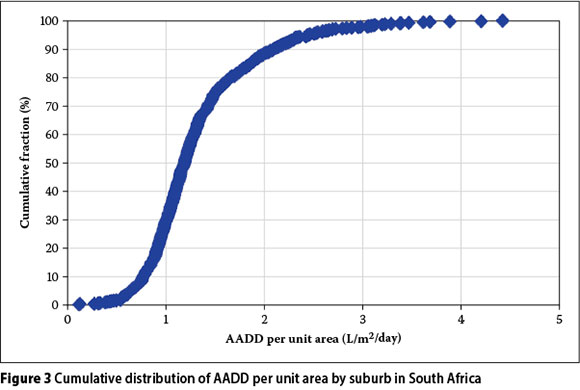
Consumption per unit area has an average value of 1.33 L/m2/day and a median value of 1.19. While it has a smaller coefficient of variation (44%) than AADD per property, the AADD per unit area displays a large range of values, varying between a minimum and maximum of 0.12 and 4.42 L/m2/day respectively. Areas with high AADD per unit area were found to be characterised by low-income consumers on stands typically smaller than 500 m2. The cumulative distribution of the AADD per unit area is shown in Figure 3.
FACTORS AFFECTING DEMAND
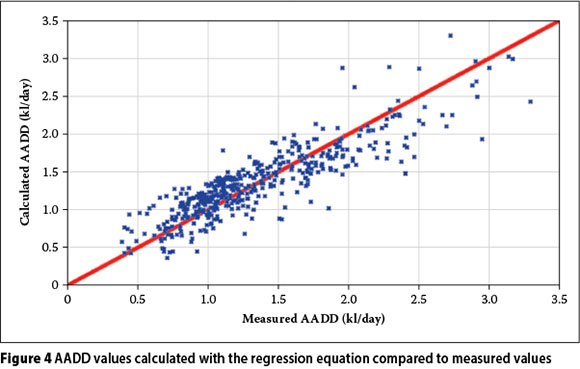
To determine the relative importance of different parameters on domestic water demand grouped by suburb, a regression analysis was conducted on the 459 suburbs with complete data records. The regression coefficients found are given in Table 4 ranked by importance of the parameter (or absolute value of the standardised regression coefficients). The results confirm that stand area is the most important explanatory variable for AADD, and thus supports the continued use of stand area as the basis for estimating the AADD.

The regression equation was applied to the individual suburbs in the data set, and the predicted AADDs are compared to the measured values in Figure 4. While the regression equation clearly shows the right trend, it is far from a perfect correlation, with some calculated values containing substantial errors. This observation, combined with the nearly impossible task of accurately estimating all the model parameters listed in Table 4, means that the regression equation is unlikely to find practical application.
PROPOSED DESIGN GUIDELINE
Suburbs are residential areas that form part of a city or town, typically consisting of a few hundred properties. A given suburb would typically consist of stands of similar size, service levels and value relative to the city as a whole. In addition, the residents of a suburb tend to be similar in their socio-economic status. A basic premise of this paper is that the water consumption behaviour of users in a given suburb is as close to uniform as it is practically possible. In addition, since consumers in a suburb are physically situated close to one another and share the same pipe network, differences between higher- and lower-demand consumers will be cancelled out locally. As a result, it is only necessary to design for the average and not the highest demand in a suburb.
The average AADDs of 739 suburbs throughout South Africa are plotted against their respective average stand areas in Figure 5, also showing the current South African design envelope. The figure shows that many of the measured data points fall outside the current guideline - 4.5% fall above the upper line and 34% below the lower line of the guideline envelope. Thus it is clear that the current guideline should be updated to reflect the true distribution of AADD found in the field.
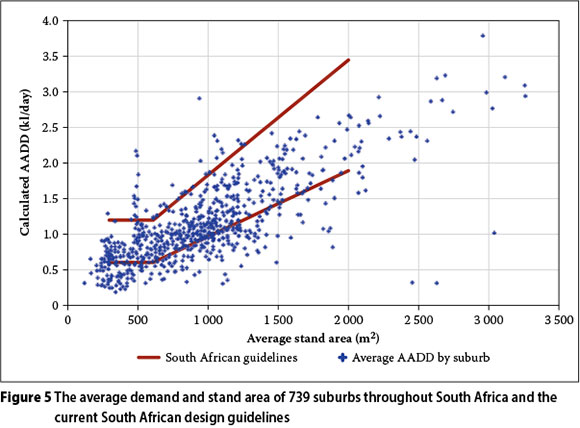
New proposed envelope curves for the design of domestic AADD were developed based on the data. Since the data shows a very large range, envelope curves that include all points would be too wide to make practical sense. An optimisation approach was therefore followed to find envelope lines that would best trade off the following two competing objectives:
1. Minimising the number of data points falling outside the envelope curves.
2. Minimising the sum of the differences between the envelope line and the data points. An envelope line will achieve this objective best by following the shape of the data as closely as possible.
An objective function was developed by first weighting and then adding the results of these two measures. The envelope lines were adjusted to include more or less of the extreme points by modifying the relative weights of the two objectives.
Different line types were tried for the envelope, and linear lines were eventually found to describe the most inclusive and consistent envelope. In addition, a trend line (the blue line) was fitted to all the data included in the envelope. The trend and proposed upper (purple) and lower envelope (red) lines are shown with the data in Figure 6.

Visual inspection of the upper line indicated that a lower upper line (the grey line, also called the alternative upper line) can be applied without changing the operation of the new design guideline by much. This upper boundary includes 96.6% of the points between the upper (purple) and lower (red) lines and narrows down the design guideline to a more user-friendly design tool.
Designers should use local factors such as climate, income and population density to determine an appropriate design AADD between the lower and upper envelope curves. It should also be noted that the measured AADD values per suburb tend to be closer to the mean value trend line for larger stands.
The equations for the trend and upper and lower envelope lines are given by the following equations:

where AADD is the annual average daily demand per property in kℓ/property/day and A is the stand area in m2.
Finally, it is necessary to analyse the points that fall outside the proposed envelope curve to identify the types of properties that are not included in the proposed design envelope. Suburbs for which the AADD is underestimated are most critical, since this may lead to design failure. An analysis of these suburbs identified two categories:
■ Very high-income consumers, mostly in gated developments, such as Kyalami Estate, Benmore Gardens and Dainfern in Johannesburg.
■ Suburbs surrounding Hillbrow in Johannesburg, which is one of the highest population density areas in the country. These suburbs originally developed as higher-income residential areas, and thus consist of relatively large houses. It is suspected that these areas have a much higher population density than similarly sized suburbs, due to their proximity to Hillbrow, and that houses are shared by several families. Suburbs included in this category are Troyeville, Yeoville, Bellevue East and Berea.
A third category is introduced by the inclusion of the 96.6% boundary line (grey line). The areas that fall between the original upper boundary and the 96.6% boundary include:
■ Two areas in Breede Valley, i.e. Langerug, Van Riebeeck/Panorama.
■ Four areas in northern Johannesburg, i.e. Parkview, Maroeladal, Mayfair, Newclare.
■ Six areas in eastern Johannesburg, i.e. Fourways, Parktown North, Parkwood, Bruma, Sydenham, Malvern.
■ One area in southern Johannesburg, i.e. La Rochelle.
■ One area in Ekurhuleni (Germiston), i.e. Ncala.
■ One area in Tshwane, i.e. Wapadrand. Suburbs with demand falling below the lower envelope are less critical since this will not lead to design failure, although the system may be overdesigned. Three categories of suburbs were identified:
■ Suburbs with a high concentration of coastal holiday homes. These suburbs are only fully occupied over peak holiday periods and thus would have AADDs significantly lower than similar suburbs elsewhere. The suburbs identified in this category include Keurboomstrand, Natures Valley, Kwanokuthula, New Horizon and Kayser's Beach.
■ Small and lower-density rural settlements in semi-desert areas, including Napier, Friemersheim, Albertinia (in Langeberg) and Myddleton (near Caledon).
■ Certain small holdings such as Riversdale and Henley on Klip.
CONCLUSION
This study analysed residential water demand based on the premise that a suburb provides the best basis for analysing AADD. Not only are stands in a suburb of similar size and users of similar socio-economic status, but variations in demands cancel one another out due to the close proximity of the users to one another.
An analysis of the average AADD of 739 suburbs spread throughout South Africa showed that the average AADD is 1 100 ℓ/property/day, but a large range of AADDs was observed.
A regression analysis of the AADDs of 340 suburbs resulted in an equation to predict the AADD of a suburb based on various stand, climatic and socio-economic parameters. However, this equation produces significant errors for some suburbs, and is too complex to have practical application. Significantly, the regression analysis showed that the stand area is the most important descriptive parameter of AADD.
Finally, the average AADDs of 739 suburbs were plotted against their average stand area, showing that the current guidelines do not provide a suitable description of the range of AADDs for design purposes. A new envelope curve is proposed that includes the vast majority of suburbs. Suburbs with consumption above the upper envelope curve include very high-income gated communities and specific high-density suburbs bordering Hillbrow in Johannesburg. Suburbs with AADDs below the lower envelope curve consist mainly of holiday destinations and certain low-income rural settlements.
REFERENCES
CSIR (Council for Scientific and Industrial Research) 2003. Guidelines for human settlement planning and design (revised "Red Book"), Chapter 9. Pretoria: CSIR, Report compiled under the patronage of the Department of Housing. [ Links ]
Garlipp, K D C O 1979. Water consumption patterns in urban areas. MSc dissertation, Pretoria: University of Pretoria. [ Links ]
GLS (General Logistics Systems) 2007 Swift. Available at: www.gls.co.za/Gls/pages/swift/overview.html (accessed 27 September 2007). [ Links ]
Husselmann, M L & Van Zyl, J E 2006. Effect of stand area and income on residential water demand. Journal of the South African Institution of Civil Engineering, 48(3):12-16. [ Links ]
Jacobs, H E, Geustyn, L C, Loubser, B F & Van der Merwe, B 2004. Estimating residential water demand in southern Africa. Journal of the South African Institution of Civil Engineering, 46(4):2-13. [ Links ]
Jacobs, H E, Sinske, S A & Scheepers, H M 2012. Effect of land area on average annual suburban water demand. Journal of Urban Water (submitted for publication). [ Links ]
Midgley, D C, Pitman, W V & Middleton B J 1994. Surface water resources of South Africa. WRC Report No 298/1/94, Pretoria, South Africa: Water Research Commission. [ Links ]
Stephenson, D & Turner, K 1996. Water demand patterns in Gauteng. IMIESA (Journal of the Institute of Municipal Engineering of South Africa), 21(1):11-16. [ Links ]
Van Vuuren, S J & Van Beek, J C 1997. Her-evaluering van die bestaande riglyne vir stedelike en industriële watervoorsiening gebaseer op gemete waterverbruike. Fase 1: Pretoria voorsieningsgebied. Pretoria: Water Research Commission, WRC Report No 705/1/97. [ Links ]
Van Zyl, H J, Ilemobade, A A & Van Zyl, J E 2008a. An improved area-based guideline for domestic water demand estimation in South Africa. Water SA, 34(3):381-391. [ Links ]
Van Zyl, J E & Geustyn, L C 2007. Development of a National Water Consumption Archive. Pretoria: Water Research Commission, WRC Report No 1605/1/07. [ Links ]
Van Zyl, J E, Haarhoff, J & Husselman, M L 2003. Potential application of end-use demand modelling in South Africa. Journal of the South African Institution of Civil Engineering, 45(2):9-19. [ Links ]
Van Zyl, J E, Piller, O & Legat, Y 2008b. Sizing municipal storage tanks based on reliability criteria. Journal of Water Resources Planning and Management, 134(6):548-555. [ Links ]
 Contact details:
Mari Etjie Griffioen
SCIP Engineering Group (Pty) Ltd
PO Box 48550
Roosevelt Park
2195
South Africa
T: 082 318 6275
E: marietjie@scip.co.za
Contact details:
Kobus Van Zyl
Department of Civil Engineering
University of Cape Town
South Africa
T: +27 21 650 2325
E: kobus.vanzyl@uct.ac.za

MARI ETJIE GRIFFIOEN Pr Eng completed her Master's Degree in Civil Engineering at the Rand Afrikaans University (now University of Johannesburg) in 2004. She served as a lecturer at this same institution until recently. She is a member of the South African Institution of Civil Engineering (SAICE) and of the International Water Association (IWA). She was part of the organising committee of the Water Distribution System Analysis (WDSA) Conference, held in the Kruger National Park in 1998. In 2003 she was awarded the prize for the best paper in the Journal of the South African Institution of Civil Engineering. Her research fields include water distribution, green buildings, grey water and rainwater harvesting.

PROF KOBUS VAN ZYL Pr Eng holds Bachelor and Master's degrees In Civil Engineering, and a Diploma In Scientific Computing from the Rand Afrikaans University. He obtained a PhD In Civil Engineering from the University of Exeter In 2001. He Is a member of the South African Institution of Civil Engineering (SAICE), the International Water Association (IWA) and the American Society of Civil Engineers (ASCE), and he is also a Fellow of the Water Institute of Southern Africa (WISA). He was chair of the Department of Civil Engineering Science at the University of Johannesburg from 2005 to 2007, and held the Rand Water Chair in Water Utilisation at the same institution. In 1998 he chaired the 10th Water Distribution System Analysis (WDSA) Conference, held in the Kruger National Park. He has twice been awarded the best paper prize in the Journal of the South African Institution of Civil Engineering. He is an Associate Editor of the Journal of Water Resources Planning and Management, and a member of the Editorial Board of the Urban Water Journal. His research focuses on water distribution systems, and his current interests include hydraulic modelling, water losses, stochastic analysis and water demand management.

