


Services on Demand
Article
 English (pdf)
 Article in xml format
 Article references
Indicators

Related links
-
 Cited by Google
 -
 Similars in Google
Share

 Permalink
Journal of the South African Institution of Civil Engineering
On-line version ISSN 2309-8775
Print version ISSN 1021-2019
J. S. Afr. Inst. Civ. Eng. vol.56 n.1 Midrand Jan. 2014
TECHNICAL PAPER
The status of basic design ground motion provisions in seismic design codes of sub-Saharan African countries : A critical review
A Worku
ABSTRACT
Basic provisions for design ground motions in seismic design codes of sub-Saharan African countries are critically reviewed. The seismic codes of Ethiopia, Kenya and Uganda are selected to represent the eastern region, Ghana to represent the west and South Africa to represent the south. The specific provisions considered are those pertaining to site effect and the recurrence period of the design earthquake. The codes are also compared with one another and with selected current international codes from the US and Europe, with respect to selected provisions. The provisions are further viewed from the perspective of the state of the art and the state of the practice. It has been concluded that these basic provisions in most of the sub-Saharan African codes considered are inadequate in guaranteeing safety of human life and limiting damage to property, suggesting a need for immediate updating, an exception being the South African code.
Keywords: seismicity, seismic design, seismic hazard, return period, site effect, design spectra, sub-Saharan Africa
INTRODUCTION
According to the recent compilation of worldwide seismic regulations by the International Association of Earthquake Engineering (IAEE), 63 countries have issued seismic design codes as of October 2008. Five African countries are included in this list: Algeria, Egypt, Ethiopia, Ghana and Uganda. Copies of their seismic regulations are available on the IAEE website (http://www.iaee.or.jp/), although some are not necessarily up to date. This list is obviously not exhaustive, as countries like South Africa, which has had its seismic code in place since 1989, and Kenya, which issued its seismic regulations as early as 1973, are not included.
The most earthquake-prone region of Africa is probably the eastern side, where the more than 3 000 km East African Rift System (EARS) traverses 15 different nations, extending from northern Ethiopia to Malawi and Mozambique. This region is known for its seismic activity and has been visited frequently by strong earthquakes, including the magnitude 7.0 earthquake (moment magnitude, Mw) that rattled Mozambique as recently as 2006 (Sousa et al 2008). In 1990 an earthquake of a surface-wave magnitude of 7.2 shook the southern part of Sudan (currently South Sudan) accompanied by numerous aftershocks with magnitudes as large as 7.0 (Girdler & McConnell 1994). Such sizes of shallow (< 35 km focal depth) earthquakes have a destructive potential to the near field comparable to the 2010 Haiti earthquake that devastated the capital Port au Prince, killing over 300 000 people, displacing 1.3 million and destroying close to 100 000 houses (http://www.usgs.org/). Fortunately the earthquakes of Sudan and Mozambique occurred in uninhabited areas, resulting in only a few causalities. However, the human settlement and infrastructure development pattern in many places of Africa is changing fast. Cases in point are Juba, the capital of South Sudan; the Turkana area of northern Kenya, with recent developments related to oil discoveries; and southern Ethiopia, with on-going huge hydroelectric power, irrigation and oil prospecting projects.
The western half of the African continent is comparatively quieter. Some countries are known for a moderate degree of seismic vulnerability, including Guinea, Sierra Leone, Liberia, Ghana, Cameroon, Gabon and Congo. Ghana is the only nation in this region known to have seismic design regulations. Its first seismic code was issued in as early as 1977. This was revised in 1990, and again recently in 2010, even though the rather high peak ground accelerations (PGA) of up to 0.35 g specified by the latest editions (BRRI 1990, 2010) cast doubts on the reliability of the background seismic hazard assessment work.
An observation common to all sub-Saharan African countries is that awareness on imminent seismic risks in the region is surprisingly low. Countries having their own seismic design regulations are quite few. Moreover, most of the codes are not regularly updated. Some basic provisions of the few codes available are obsolete and some are unrealistic. Cases in point include the Kenyan seismic code, which has never been updated since its issuance in 1973, whereas the knowledge of earthquake engineering has shown significant strides ever since. Also, most of the sub-Saharan African codes employ obsolete site-effect provisions that lead to unsafe design and that are no more in use in most parts of the world.
Quality control in the construction industry is in a dismal state. Building regulations, if available, are not often properly adhered to, even for static gravity loads. Reports of buildings collapsing during and after construction have become common news in Africa. In 2011 alone, the collapse of five buildings in different locations of Kenya was reported (http://www.a4architect.com/). In Kampala, the capital of Uganda, at least 60 people were reported dead from the collapse of 11 buildings within the recent few years (http://www. ugpulse.com/). In February this year, a 16-sto-rey building under construction in Dar es Salaam, Tanzania, collapsed costing close to 40 lives. Equally tragic incidents have become a major concern in Nigeria (Oloyede et al 2010). Similar situations can be expected to exist in many other African countries where the building industry has been wrongly left as an informal economic sector, with negligible public control and enforcement of regulations. Imagining how buildings of such quality would behave during strong earthquakes is extremely scary, to say the least.
A number of shortcomings can be cited of the rather few seismic codes available in some sub-Saharan African countries. Some of the fundamental pitfalls are related to the definition of the design ground motion. Primarily, there exists a lack of uniformity in the return period of the design earthquake specified by the codes. For example, the Ethiopian seismic code, EBCS 8, (MWUD 1995) provides for a return period of 100 years, whereas the South African code (SABS 2010) has adopted 475 years, while none of the other codes explicitly state the return period. An equally important issue is the fact that the approach employed to account for the amplification potential of site soils in almost all these codes is obsolete, with the exception of the recently updated South African code (SABS 2010), which has adopted the recent approach introduced in the European code to account for site amplification.
This paper presents a study of these two fundamental issues related to input ground motion, namely site effect and recurrence period of design earthquake. It focuses on the pertinent provisions of the selected representative seismic codes. The corresponding provisions in these codes are compared with one another and with recent issues of American and European codes.
BASIC GROUND MOTION PROVISIONS OF THE AFRICAN SEISMIC CODES
The selected codes include the Ethiopian, Kenyan and Ugandan codes to represent the most seismic region of the EARS, the Ghanaian code to represent the less seismic western Africa, and the South African code to represent the southern region. The provisions on the two basic issues are briefly presented in the following section, to be followed by comparisons among themselves and with selected recent American and European codes. The National Earthquake Hazard Reduction Program (NEHRP) is selected to represent the American codes (BSSC 2004), whereas the Eurocode (Eurocode 8 2004) automatically qualifies as representative of European codes.
The Kenyan Code - 1973
The Kenyan seismic code, probably one of the pioneers on the continent, was issued in 1973 by the Kenyan Ministry of Works and uses the Modified Mercalli intensity (MMI) scale to map the seismic hazard of the country, as shown in Figure 1 (MWK 1973). The map divides the country into four seismic zones: Zone V, VI, VII and VIII-IX, where the Roman numbers are in accordance with the MMI scale. This method of seismic hazard mapping using earthquake intensity is seldom in use nowadays for design purposes.
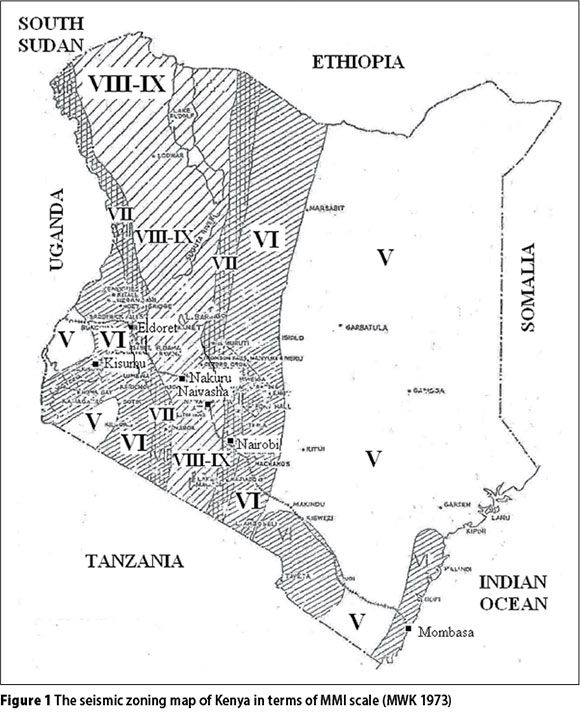
The code neither states the recurrence period of the design earthquake nor its probability of exceedence. Explicit numeric values of parameters like PGA, which are more relevant to engineering design, are not provided. However, these can be inferred from the relation provided by the code for estimating the seismic coefficient (see Equation (1)), and the accompanying explanation that the PGA corresponding to Zones VIII-IX, VII and VI are 0.05 g, 0.025 g and 0.0125 g respectively. According to the map, populous Kenyan cities within the eastern branch of the EARS, like Nakuru, belong to Zone VIII-IX; the capital Nairobi and Eldoret belong to Zone VII; and Kisumu and Mombasa belong to Zone VI. In comparison with seismic coefficients assigned in recent seismic hazard maps based on a return period of 450 years (see Figure 10(a)), the return period of the design earthquake is not likely to be more than 100 years.
The code provides the following expression for the computation of the seismic coefficient in the equivalent static force (ESF) approach for a case it defines as the "basic" case:
where T is the fundamental period of the building.
The "basic" case is defined as flexible-frame buildings built on a hard ground condition in Zone VIII-IX. The seismic coefficient of the "basic" case is halved for Zone VII and quartered for Zone VI. Though not explicitly stated in the code, it can be understood that the numerator in Equation (1) is the seismic factor, C, or the PGA normalised with respect to the gravitational acceleration, g, for the seismic zone under consideration.
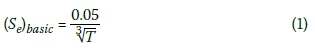
With regard to site effect, the code crudely classifies sites into just two classes: hard and soft ground, without further satisfactory descriptions. The code suggests that Se for hard ground be raised by 30% to account for site amplification due to a soft ground. By doing so, this approach disregards the inherent wide variation in the dynamic behaviour of natural soil deposits, and is not in agreement with even the earliest site-dependent response spectra devised in the 1970s, as will also be discussed later. The seismic coefficient, Se, in Equation (1) normalised with respect to the seismic factor, C, is given in Figure 2 for the two site conditions.
Obviously, the curves do not have resemblance to design spectral curves specified even in old versions of known seismic design codes. The code does not have provisions for dynamic analysis of structures. Also, no account is made for inelastic response of structures. Despite being one of the pioneering seismic codes in Africa, the code has not been updated since it had first been issued about four decades ago. Ironically, Kenya is located well within the eastern branch of the active seismic region of the EARS which is prone to strong earthquakes.
The Ethiopian Code - EBCS 8, 1995
The building design code of Ethiopia was first introduced in 1978. Its seismic provisions have been revised twice since then. The first revision took place in 1983. The current version - the Ethiopian Building Code Standard, EBCS 8: 1995 - dedicates a separate volume for seismic provisions (MWUD 1995). A committee, of which this author is a member, has been formed very recently and entrusted with the task to revise the code for a third time.
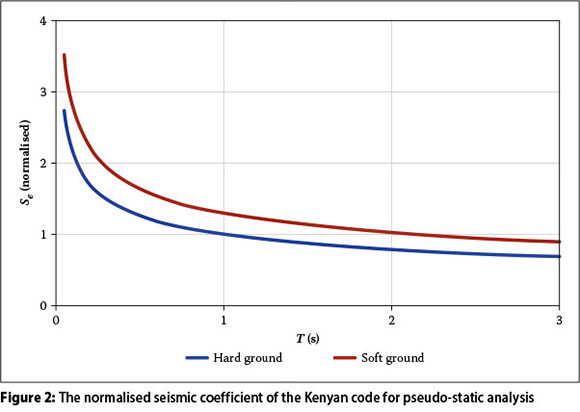
EBCS 8:1995 provides the seismic hazard map of the country given in Figure 3, which is based on a 100-year return period. According to this map, each of Zones 1, 2, 3 and 4 is assigned a constant bedrock acceleration ratio, α0 of 0.03, 0.05, 0.07 or 0.1 respectively, whereas Zone 0 is considered seismic free. The capital, Addis Ababa, home to the headquarters of many international bodies, including the African Union, belongs to Zone 2, with α0 = 0.05. The boundary with the more seismic neighbouring region of Zone 3, with α0 = 0.07, is only 20 km away from the city centre and is already within the city due to the recent rapid urban expansion. The factor α0 is the PGA at bedrock level normalised with respect to the gravitational acceleration g. It is used to scale down the normalised design spectra provided by the code. Several large towns, including capitals of federal states, belong to the most seismic region of Zone 4 with α0 = 0.1.
EBCS 8 specifies the seismic coefficient Sd for the equivalent static force (ESF) method in the form of Equation (2) for the design base shear Fd:
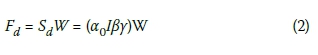
where I is the importance factor of the building that is assigned values of 0.8 to 1.4; W is the weight of the building; β is the design response factor of the structure that accounts for site effect; and y is the behaviour factor which accounts for ductility, nonlinear response and the influence of damping other than 5%.
The influence of the site soil is embedded in the design response factor (or elastic design spectrum) given by
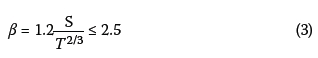
S is the site coefficient, which can assume the values of 1.0, 1.2 or 1.5 for Subsoil Class A, B or C, respectively. Subsoil Class A includes rock or similarly competent formations and dense deposits of sand, gravel or over-consolidated clay characterised by vs > 800 m/s; Subsoil Class B consists of deep deposits of medium dense sand, gravel or medium stiff clays with thicknesses of at least several tens of metres and vs > 200 m/s;
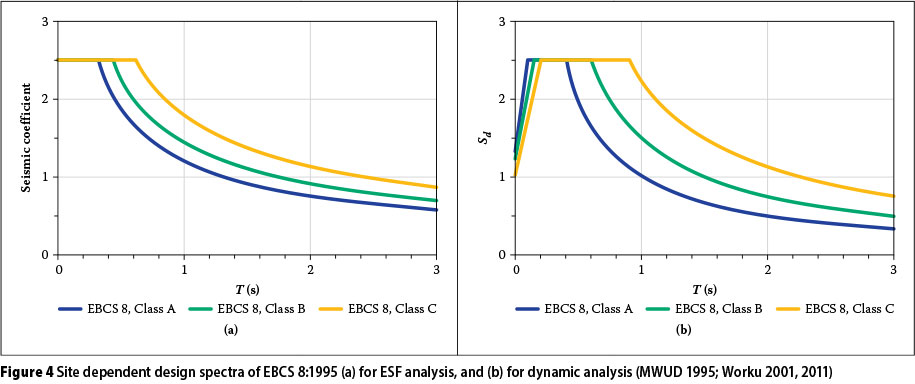
Subsoil Class C comprises loose cohesion-less soil deposits and soft to medium stiff cohesive soils with vs < 200 m/s; and vs is the average shear-wave velocity of the geological formation of the site. Plots of Equation (3) are given in Figure 4(a).
EBCS 8 also provides the site-dependent elastic design spectra of Figure 4(b) for dynamic analysis which are not identical to the spectra of Figure 4(a). Whereas the right-hand segment varies according to 1/T2/3 in Figure 4(a), it varies in accordance with 1/T in the spectra of Figure 4(b). Similarly the amplification factors in Figure 4(b) for Classes B and C are 1.5 and 2.25 instead of 1.2 and 1.5. The curves in Figure 4(b) are almost identical to the ATC-3 Spectra, which are based on the early findings of the empirical studies of Seed et al (1976) presented in Figure (11) and will be discussed later.
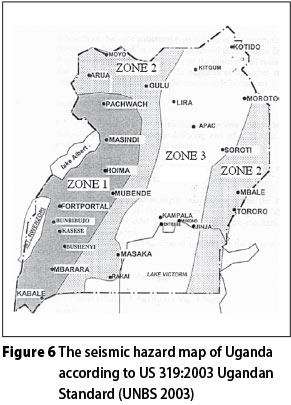
The Ugandan Code - US 319:2003
The seismic code of Uganda, US 319:2003, issued by the Ugandan National Bureau of
Standards in 2003, specifies the following design spectrum, Ca, for both the ESF and modal analysis (UNBS 2003):
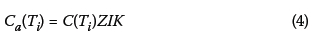
Ca(Ti) = C(Ti)ZIK (4) where C(Ti) is the ordinate of the "basic" response spectrum given for three different soil groups as shown in Figure 5; Z is the seismic zone factor given for the three seismic zones of the country shown in Figure 6 assuming the values of 1, 0.8 and 0.7 for Zones 1, 2 and 3 respectively; I is the structural importance factor that takes values of 1 up to 2; and K is the structural performance factor which is dependent on the type of the structural system and materials. The recommended minimum values of K vary from 1 for the most carefully designed ductile structural systems to 4 for structural systems of minimal ductility.
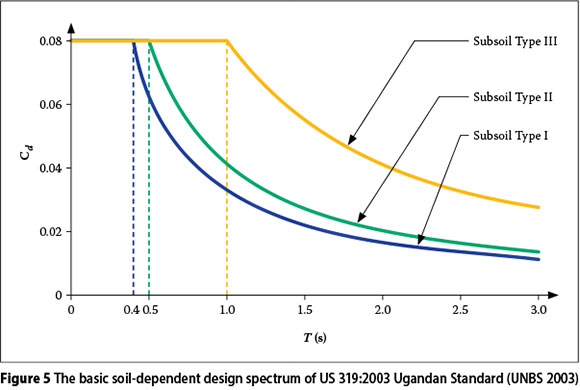
The design spectrum in Figure 5, which is defined as the "basic" design spectrum by the code, is the minimum design inelastic spectrum specified for the most seismic zone, Zone 1, and for the most ductile structural system, for which K is assigned the value of unity. In contrast to this, the basic design spectrum in most seismic design codes is conventionally defined as the elastic design spectrum before any factor is applied to it to account for inelastic response and ductility. This corresponds to the spectrum obtained from Figure 5 by applying the maximum value of the structural performance factor of K = 4 specified for the least ductile system in the same seismic zone.
Thus, the maximum ordinate of the elastic design spectrum corresponding to the flat part of the spectral curves in Figure 5 obtained in this manner will have the value of 0.32. This ordinate is as a rule 2.5 times the rock-level normalised PGA (Newmark & Hall 1969). Therefore, the corresponding minimum rock-level PGA for Zone 1 can easily be back-calculated through dividing 0.32 by 2.5 to obtain 0.13 g. The corresponding minimum PGAs for Zone 2 and Zone 3 are obtained as 0.10 g and 0.09 g by applying the zone factors of 0.8 and 0.7 respectively, given by the code.
Comparison of these values with those in the recent continental GSHAP map of Africa presented in Figure 10 suggest that these PGA values tally with a 475-year return period of the design earthquake, even though the code does not mention the length of the recurrence period.
The code also fails to clearly specify the values of amplification factors associated with Subsoil Types II and III of Figure 5. Nor does it indicate how the descending segments on the right-hand side of the spectral curves vary with period. Nonetheless, using ordinates directly read from the curves at selected points, the amplification factors can be inferred to be 1.25 and 2.5 respectively. Even though these site-dependent design spectral curves look similar in shape to those of ATC-3, they also exhibit some differences in the values of the amplification factors, especially in the case of the softest soil class, for which the Ugandan code assigns a value of 2.5 instead of 2.25.
The Ghanaian Code - 1990
As in most sub-Saharan African countries, recorded strong earthquake ground motions in Ghana are nonexistent. A few studies conducted since recently indicate that the Accra metropolitan area is one of the most seismic-prone areas. Earthquake magnitudes of up to 6.5 on the Richter scale have been recorded (Amponsah 2004; Amponsah et al 2009; Allotey 2010; Oteng-Ababio 2012). Using a hybrid deterministic seismic hazard assessment technique, Amponsah et al (2009) simulated the 6.5 magnitude earthquake to predict peak horizontal and vertical ground accelerations in the ranges of 0.14 g to 0.57 g, and 0.2 g to 0.34 g respectively, with a maximum amplification factor of 4 for the horizontal motion in the period range of 0.2 s to 0.5 s. The highest amplifications are estimated at sites of unconsolidated or poorly consolidated deposits. Such magnitudes of shaking are quite large in the context of the known history of seismic activity in the African continent.
The latest Ghanaian code is the Code for the Seismic Design of Concrete Structures issued in 2010 by the Ghanaian Building and Road Research Institute (BRRI 2010). It provides the seismic hazard map shown in Figure 7(a), which divides the country into three seismic zones of 1, 2 and 3. Each zone is assigned a constant peak rock-surface acceleration of 0.15 g, 0.25 g and 0.35 g respectively. This hazard map seems to have been influenced a lot by the deterministic study of Amponsah et al (2009) that is based on a single event and appears to have already accounted for site amplification. Also, the recurrence period of the design earthquake is not stated, indicating the influence of the deterministic approach employed in the work of Amponsah et al (2009).
The rather large values of PGA specified by the code are comparable to values specified for the highly seismic western coastal region of the US (including California) proposed for a return period of 475 years. It is considered unlikely that these values apply to the comparatively less seismic region of West Africa, unless corroborated by more detailed probabilistic studies that account for the range of earthquake magnitudes expected to occur in the region.
As shown in Figure 10(a) of the GSHAP map for Africa, the maximum PGA in the entire continent for a return period of 475 years is 0.24 g, and the maximum possible PGA specifically for Ghana is 0.16 g, which is applicable to the zone containing Accra and its environs. This is based on a probabilistic seismic hazard assessment study conducted by Grünthal et al (1999).
The design spectra of the Ghanaian code are given in Figure 7(b). The spectra for PGAs less than 0.3 g and the corresponding amplification factors are similar to those of the Ethiopian seismic code, EBCS 8, given in Figure 4(b) or to the ATC 3, 1978 spectrum given in Figure 11(b), though the right-hand segment in the Ghanaian code varies according to 1/T2/3. Apparently the code uses the same spectra for both the ESF and dynamic methods of analysis. The code reduces the ordinate of the constant part from 2.5 to 2 for soil group S3 when the PGA is larger than 0.3 g, as shown in Figure 7(b). This measure seems to have been introduced in order to account for the increased damping in soils during high-intensity shaking that tends to reduce soil amplification, even though such a level of shaking is a very remote possibility in Ghana, as explained above.
The provisions for design ground motions in the 2010 edition (BRRI 2010) described above are practically identical to those in the 1990 edition (BRRI 1990) and do not account for recent findings on site amplification effects, which are discussed in a later section.
The South African Code -SANS 10160-4:2010
The recent revision of the South African standard for seismic actions, SANS 101604:2010 (SABS 2010), was issued in June 2010 and makes up one of the eight parts of the South African National Standard SANS 10160:2010 (Wium 2010), which replaces the older version of SABS 0160:1989.
Seismic hazard in SANS 10160-4:2010 is presented in the form of the seismic hazard map of Figure 8 in terms of the reference peak ground acceleration ag for rock site and a return period of 475 years. Notably, this return period has been introduced in 1989, when the earlier edition, SABS 0160, was issued. Two major zones are distinguishable in the map: Zone I of natural seismic activities and Zone II of predominantly mining-induced seismic activities. Zone I is assigned ag = 0.1 g, whereas Zone II can assume larger values.

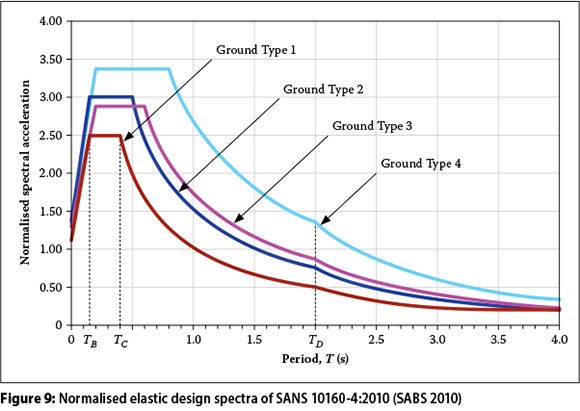
With regard to site effect, the code has directly adopted Type 1 Spectrum of the recent European code (Eurocode 8 2004) together with the four Ground Types A to D, omitting Ground Type E and softer sites. The corresponding elastic design spectra normalised with respect to the PGA are provided in Figure 9. The amplification factor S varies from 1 to 1.35 depending on the ground type. The amplification factors in all cases are constant over the entire period range and are much smaller than those introduced in current US codes. Similarly, the transition periods, TB and TC are dependent on the ground type, whereas TD, the transition to the long-period range, is constant, taken as 2 seconds.
Given the relatively stable seismic nature of South Africa compared to other seismic-prone regions, especially those in the EARS, the stringent requirements of this code are quite exemplary for future revisions of seismic design codes of other sub-Saharan African countries.
Recent seismic hazard map of sub-Saharan Africa
The Global Earthquake Model (GEM) initiative is an on-going collaborative worldwide effort launched in 2009 with the aim of building a heightened public understanding and awareness of seismic risk, leading to increased earthquake resilience worldwide through sharing of earthquake data, models and knowledge; through application of GEM tools and software to inform decision-making for risk mitigation and management; and through expansion of the science and understanding of earthquakes (http://www.globalquakemodel.org). However, tangible results from this programme, like updated seismic hazard maps, will only be available in a couple of years' time.
In contrast, the seismicity of the entire globe was compiled in the 1990s for the first time as part of the Global Seismic Hazard Assessment Program (GSHAP), which was launched by the International Lithosphere Program (ILP) and endorsed as a demonstration programme in the framework of the United Nations International Decade for Natural Disaster Reduction (UN/IDNDR). The project was active from 1992 to 1999 (http://www.seismo.ethz.ch/).
The GSHAP global seismic hazard map is given in terms of rock-surface PGA for a 10% exceedence in 50 years, which is equivalent to a return period of 475 years for the design earthquake. This level of hazard has been introduced in US codes since more than three decades ago, and subsequently adopted as a standard design-level hazard worldwide.
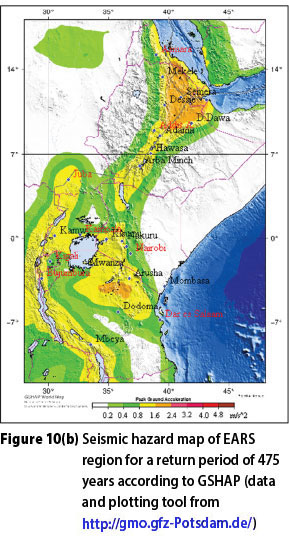
The data base of GSHAP is accessible to users (http://www.seismo.ethz.ch/). A seismic hazard map of Africa prepared using an online tool (http://gmo.gfz-Potsdam.de/) is given in Figure 10(a). A similar map of the EARS region - the most earthquake-prone region of Africa - is also given in Figure 10(b). Compared with these regional maps, the current local seismic hazard maps of some East African countries like Ethiopia and Kenya, given in Figures 1 and 3, underestimate the seismicity of their cities and towns by an average of about a half. PGAs of up to 0.24 g are assigned by GSHAP to some localities in East Africa, particularly to the Afar region of Ethiopia and to an area around Arusha in Tanzania. A number of populous towns and cities are also assigned PGAs up to 0.16 g (coloured yellow).

Kisumu, located on the northeastern shore of Lake Victoria and the third most populous city in Kenya, has probably seen one of the extreme discrepancies - from 0.0125 g in the local Kenyan code to 0.12 g in the GSHAP map - with a nearly tenfold difference. This would imply that, whereas seismic loading is practically negligible for the design of structures in Kisumu according to the existing Kenyan code, it is an important consideration if the GSHAP map is to be followed.
One of the reasons for such discrepancies is obviously the difference in the adopted return period of design earthquakes. Even though no return period is stated in the Kenyan code, it can be inferred to be not more than 100 years. In the Ethiopian code the return period is explicitly stated as 100 years. In contrast, the local seismic hazard map of Uganda in US 319:200 provides PGAs comparable with GSHAP hinting that the return period in this code is most likely 475 years, though not explicitly stated in the code.
According to the GSHAP map, the western side of the sub-Saharan Africa is not as seismic as the eastern side. The maximum PGA in the western region is 0.16 g, which is assigned to limited areas in countries like Gabon, Congo, Cameroon and Ghana (Figure 10(a)). Thus, the PGA of 0.15 g, 0.25 g and 0.35 g specified in the Ghanaian local code for its three seismic zones are obviously too large for a return period of 475 years. This indicates that the present local seismic map of Ghana significantly overestimates the seismicity and would result in unnecessarily conservative and expensive design. Obviously, the seismic hazard map of Ghana needs reassessment, even though it was updated very recently, in 2010.
The return period in the South African code of SANS 10160-4:2010 is explicitly stated as 475 years. In fact, the seismic hazard map given in Figure 9 specifies PGA values a little in excess of those recommended by the GSHAP map (on the average by 25%).
SITE EFFECT ON DESIGN SPECTRA
Site-dependent design spectra: early studies
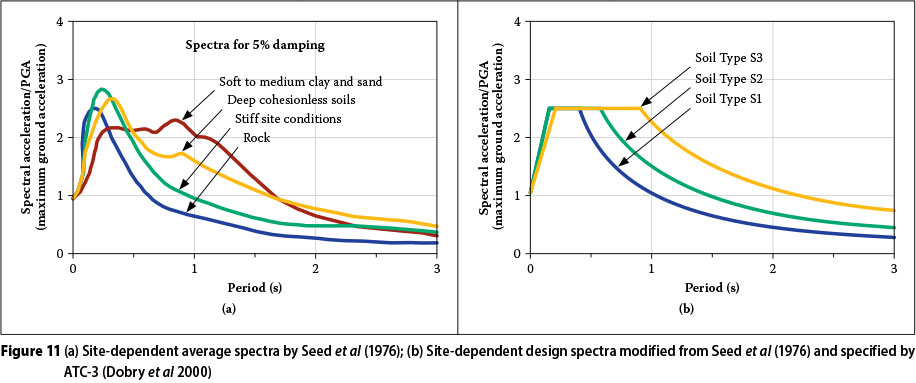
Figure 11(a) shows some of the earliest site-dependent average spectra from the pioneering work of Seed et al (1976). Figure 11(b) gives the ATC-3 simplified spectra introduced in 1978 for routine design purposes based on the curves of Seed et al (1976), whereby the fourth site class is omitted, as the associated data were not of satisfactory quality, as cautioned by the authors themselves.
The spectral curves for Soil Types S2 and S3 of Figure 11(b) in the descending branch are obtained by simply raising the spectral curve of Soil Type S1 (rock) by a single factor in each case. This factor, referred to as the ratio of response spectra (RRS), takes the values of 1.5 and 2.2 for Soil Types S2 and S3 respectively. The descending segments corresponding to the velocity-sensitive period range decline according to T-1 (Dobry etal 2000). (The velocity-sensitive period range is the period range in which the velocity of the single-mass oscillator model, due to the ground motion, is amplified most, compared to its acceleration and displacement.)
The ATC-3 spectra were later integrated in the series of editions of US seismic codes including the National Earthquake Hazard Reduction Program (NEHRP) up to 1994, and in the Uniform Building Code (UBC) series up until 1997. In 1988 a fourth soil type, S4 for deep soft clays, was included with an increased amplification factor with the aim to address the rather high amplification potential of soft soils as observed in the 1985 Mexico City earthquake (Dobry et al 2000; Dobry & Susumu 2000; Ghosh 2001). Almost all of the current sub-Saharan African seismic codes are still using these spectra, which have meanwhile been replaced by new ones in the US and Europe, an exception being the South African code.
Site-dependent design spectra: recent studies
During the 7.1 magnitude Loma-Prieta earthquake of 1989, most of the damages linked to site-soil amplification and liquefaction took place in the Bay Area of San Francisco and Oakland located about 100 km NW of the epicentre. A great deal of recorded evidence was obtained from this area (Borcherdt 1994; Dobry et al 2000; Dobry & Susumu 2000).
One of the most important outcomes of post-Loma-Prieta empirical site-effect studies is the more pronounced amplification of response spectra by soft soil sites than observed ever before. Average spectral accelerations of numerous ground motion records from thick soil sites near the San Francisco Bay Area and Oakland are reproduced in Figure 12 for a damping of 5%, together with the average spectra from adjoining rock sites after the works of Dobry et al (2000) and Dobry & Susumu (2000).
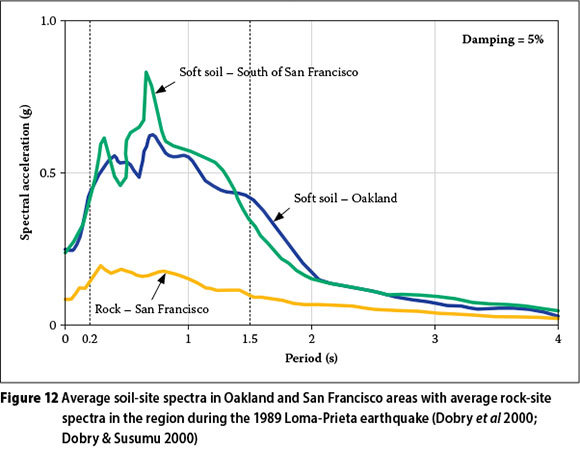
Figure 12 shows that the rock-surface spectra are at least doubled by the soil in the short-period range of up to 0.2 s. In the velocity-sensitive period range of 0.2 to 1.5 s, the spectra are amplified to a much larger degree. Similar trends were also observed at stiffer soil sites, though to a lesser degree (Dobry et al 2000; Dobry & Susumu 2000).
Comparison of the spectral curves in Figure 12 with those in Figure 11(a) shows that the short-period amplifications were not revealed in the pre-Loma-Prieta studies. Also, the amplifications in the velocity-sensitive region were not as large as those in Figure 12. This may be attributable to the limited data base available at the time of the earlier studies. For this obvious reason, the older single-factor approach is no longer found adequate to account for site-soil effects. This fact led to the introduction of improved site-dependent design spectra in US seismic codes since 1994, and in other design codes worldwide afterwards.
Systematic evaluation of improved amplification factors
A number of systematic empirical studies conducted after the Loma-Prieta earthquake suggested that the soil amplification is proportional to the mean shear-wave velocity, vs of the upper 30 m thickness raised to a certain negative exponent, which is dependent on the period band and the intensity of the rock acceleration (Borcherdt 1994; Rodriguez-Marek et al 1999; Borcherdt & Fumal, 2000; Dobry et al 2000; Dobry & Susumu 2000; Borcherdt 2002; Crouse & McGuire 2002; Stewart et al 2003). It was thus found important that site soils are classified on the basis of this important parameter.
The empirical studies of Borcherdt (1994; 2002) in particular showed that, for the low-amplitude rock accelerations not exceeding 0.1 g recorded in California Bay Area during the 1989 Loma-Prieta earthquake, the amplification factors for the acceleration-sensitive and velocity-sensitive period regions, denoted by Fa and Fv, are approximately proportional to vs-0.4 and vs-0.6 respectively. The statistically established values of Fa and Fv for low-intensity ground motions were used to calibrate one-dimensional analytical site response analysis programmes, which in turn were used to extrapolate the values of Fa and Fv for the higher range of rock accelerations of up to 0.4 to 0.5 g through analytical parametric studies (Borcherdt 1994; Dobry & Susumu 2000; Dobry et al 2000).
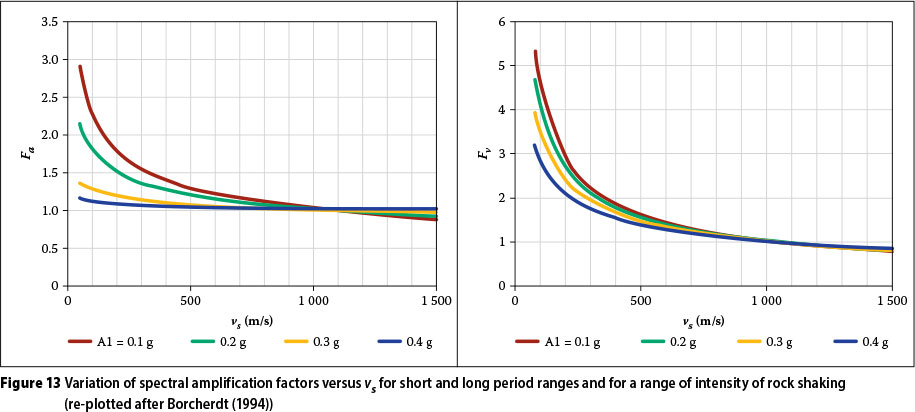
By combining the results of the empirical and analytic studies, Borcherdt (1994) arrived at the following best-fit generic relations for the two amplification factors that are applicable to a wide range of shaking intensity:
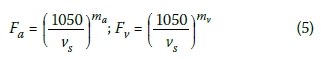
The factor Fa is proposed for the period range of about 0.1 to 0.5 s and Fv for the range of about 0.4 to 2 s. The values of the exponents ma and mv are also provided by Borcherdt (1994) as functions of the intensity of the rock acceleration. The plots of Equation (5) are given in Figure 13, showing that Fv is consistently larger than Fa for vs up to around 1 000 m/s-Vs of the reference rock site. Both factors tend to unity, with vS approaching 1 000 m/s, and decrease with increasing intensity of rock shaking, as this is associated with increased damping.
Current system of soil classification
For a generally stratified formation of n layers, each having a thickness of hi and a shear-wave velocity of vSi within the upper 30 m thickness, the representative vS can be established using the following relationship (BSSC 1995, 1998, 2004; EN 1998-1 2004; SANS 2010; Dobry & Susumu 2000; Dobry etal 2000):
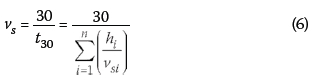
Each term in the summation represents the time taken for the shear wave to travel through the respective individual layer. The shear-wave velocity computed in this manner is based on the time, t30, taken by the shear wave to travel from a depth of 30 m to the ground surface, and is thus not computed as the arithmetic average of the shear-wave velocities of the individual layers.
This approach also allows for the use of more readily measurable quantities in the field such as the standard penetration test blow count, N, for granular deposits, or the undrained shear strength, Su, for saturated cohesive soils, though they are less reliable due apparently to the inherent double correlations.
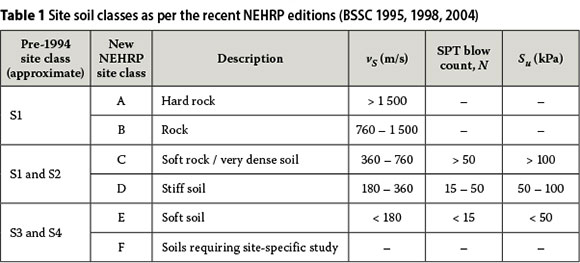
Based on a landmark consensus reached by geotechnical engineers and earth scientists in the USA in the early 1990s, five distinct soil and rock classes, A to E, are introduced in accordance with this approach, as provided in Table 1. Corresponding approximate soil classes as per the older method (pre-1994) are also provided in the first column for comparison. A sixth much softer site class, F, is also defined that requires site-specific studies. This important subject is explained in more details in the works of Dobry et al (2000) and in the commentary volumes of NEHRP (BSSC 1995, 1998, 2004).
New site amplification factors
Using the representative vs of each soil class given in Table 1, one can establish the site amplification factors from Figure 13 for the appropriate value of rock-motion intensity considered. The discrete values so obtained according to Borcherdt (1994) and adopted by NEHRP (BSSC 1995, 1998, 2004) are given in Table 2. The effective peak acceleration, Aa, and the effective velocity-related acceleration, Av, in the table are rock-level seismic hazard parameters employed to characterise site seismicity in the USA for a 475-year return period (BSSC 1995). The two effective ground accelerations have in the meantime been replaced by response-spectral parameters at two selected periods - 0.2 s and 1 s - in the more recent issues.
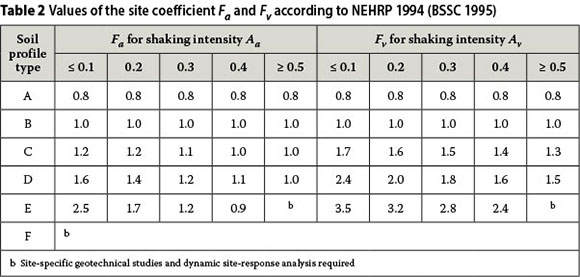
The tabular values show that soil classes C to E amplify the rock motion significantly, especially when the rock-shaking intensity is small, which is associated with reduced soil damping. The amplification is much larger in the velocity-sensitive period range than in the acceleration-sensitive period range for the non-rock soil classes, i.e. Fv is larger than Fa. The short-period amplification factor, Fa, is insignificant for rock-motion intensity larger than about 0.25 g, but is very significant for smaller-shaking intensity. This fact was not revealed in the earlier studies of Seed et al (1976).
In summary, the new amplification factors exhibit the following salient features (Ghosh 2001, 2004; Worku 2001):
1. The original three (later four) site categories are replaced by six new categories A to F.
2. The older qualitative site classification method is replaced by a new unambiguous and more rational classification method using a unique value of vs of the upper 30 m geological formation. Alternatively, average SPT blow counts and/or undrained shear strength can be used.
3. Two seismicity-dependent site coefficients, Fa and Fv, replace the single site coefficient, S, of the old system. Both factors increase with decreasing shaking level due to the associated decreased damping. This leads to larger seismic design forces for many classes of structures in low-seismic regions, like in Africa, founded on soft formations.
It is important to point out that results of more recent studies based on an enlarged database including records from more recent earthquakes, like Northridge 1994, have not indicated significant changes to the values of the above site amplification factors (Borcherdt & Fumal 2000; Borcherdt 2002; BSSC 2004). For this reason, no major changes have been made so far to these values since their first introduction in 1994.
SITE-DEPENDENT DESIGN SPECTRA IN RECENT US AND EUROPEAN CODES
Site effect provisions in the recent NEHRP series
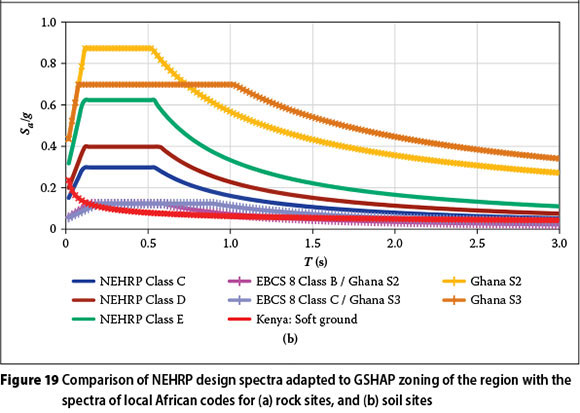
The recent site amplification factors described in the foregoing sections were first introduced in conjunction with the basic design spectrum of NEHRP 1994 given by the following relationship (BSSC 2004);
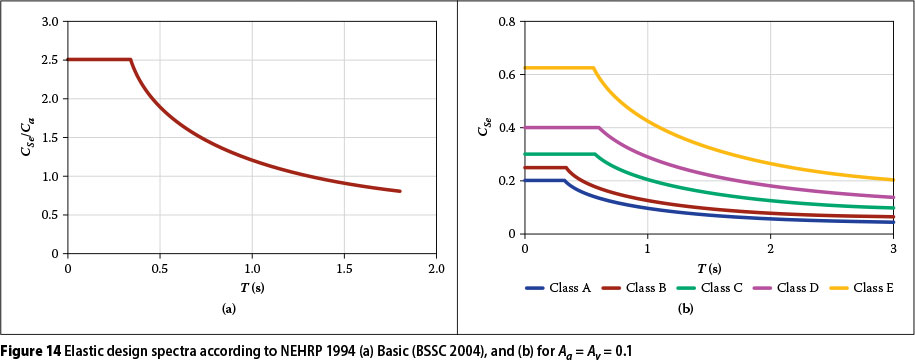
The short-period amplification factor Fa is applied on the constant part of the spectra, whereas the intermediate-period amplification factor Fv is applied on the descending segment. In order to show the basic shape of the elastic design spectrum, a plot of Equation (7) against period normalised with respect to Ca is given in Figure 14(a) for Cv/Ca = 1.
Equation (7) is plotted in Figure 14(b) for the five soil classes A to E for a seismic zone characterised by Aa = Av = 0.1. As pointed out earlier, the amplification occurs over the entire period range. Similar sets of spectral curves can be prepared for other seismic zones. These spectral curves for various soil classes are entirely different from those proposed by ATC-3, as given in Figure 11(b), especially in the short-period region.
In more recent versions of NEHRP, the amplification factors remained basically the same, whereas some changes have been introduced related to the seismic hazard parameters, namely Aa and Av, which have meanwhile been replaced by spectral accelerations at short period and at 1-second period, SS and S1 respectively. Subsequent changes made to the basic shape of the design spectrum shown in Figure 14(a) include the reintroduction of the linearly rising left part and the change made to the descending right side from T-2/3 to T-1.
Site effect provisions in the recent Eurocode
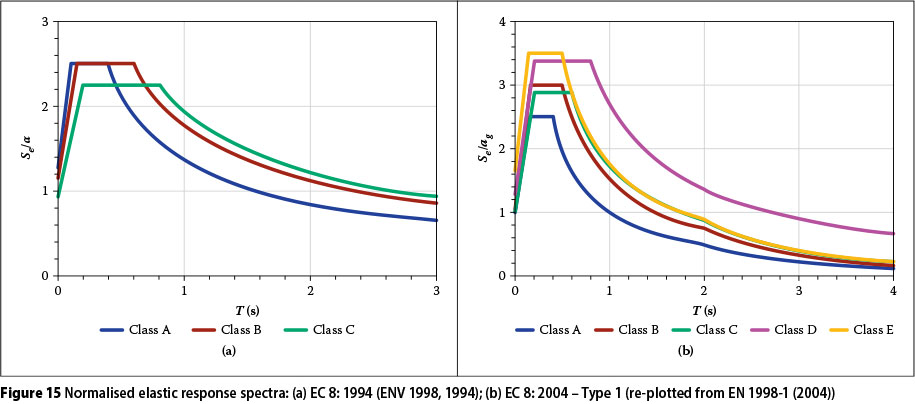
The first edition of the European seismic code (Eurocode 8 1994) employed only three site classes, A, B and C, similar to those in ATC-3, 1978, which were also adapted by almost all African codes as presented above. EC 8 1994 strangely specifies a smaller maximum value for the softest site class C than for the stiffer sites A and B, as shown in Figure 15(a), and an underestimated amplification potential in the entire velocitysensitive range. In light of the foregoing discussion, such a representation of the dynamic behaviour of the softest class of formations casts some doubt on its reliability. Similar doubts have also been expressed by Rey et al (2002), who attributed this pitfall to lack of sufficient ad hoc studies prior to the publication of the document at the time. These spectra are now obsolete and are presented here for comparison purposes only.
The recent edition of Eurocode 8 (2004), issued in 2004, introduced five soil classes A to E with an additional class requiring site-specific studies. The system has many features in common with the recent NEHRP editions and other American codes, but also exhibits important differences. According to the new system, all rock and rock-like geological formations with vs > 800 m/s are categorised under the single group of Ground Type A. Unlike in the former edition of Eurocode 8 (1994), each soil class in Eurocode 8 (2004) is assigned an amplification factor larger than unity, applied uniformly over the entire period range, though the code does not employ two different amplification factors for the acceleration and velocity-sensitive regions.
The values of the amplification factors vary in the range of 1 to 1.4, and 1 to 1.6 for Type 1 and Type 2 spectra, which are specified for regions of earthquakes of surfacewave magnitudes larger than 5.5 and less than 5.5 respectively. Type 1 spectral curves are shown in Figure 15(b). To be noted is that the new amplification factors are significantly smaller than the new NEHRP factors, Fa and Fv, which can assume values up to 2.5 and 3.5 respectively. Note that in Figure 15(b) a segment descending according to T-2 is included for periods longer than 2 seconds.
The number of independent research works that led to the curves of Figure 15(b) do not seem to be as many as those that led to the NEHRP spectra. This can partly be due to the difference in the size of the database available to the researchers. Type 2 spectra are similar to Type 1 spectra, but with consistently increased amplification factors and reduced control periods. Note that Type 1 spectra are almost identical to those of SANS (SABS 2010).
COMPARISON OF SITE-DEPENDENT DESIGN SPECTRA
In this section, a comparison of the design spectra of the sub-Saharan African codes with those in selected recent codes of the US and Europe is presented. NEHRP 2003 (BSSC 2004) is selected as representative of the NEHRP series, which serves as the main resource document to many US seismic codes. Eurocode 8 (2004) automatically qualifies as the current seismic code in Europe, which replaced the older version (Eurocode 8 1994).
African versus NEHRP and Eurocode 8 design spectra: rock sites
Figure 16 compares the basic normalised design spectra for rock or firm ground condition of all codes considered. The normalisation is important in order to exclude the influence of seismicity and the return-period of the design earthquake.

With the exception of the spectra of the Kenyan code and NEHRP's Class A, the plots show that the spectra for rock sites in the other codes are almost identical, with minor differences. This is not unexpected, as most of them are based on the findings of the pioneering works of Newmark & Hall (1969, 1982). The Kenyan spectrum is different in shape from the rest and smaller by up to 54% in the important period region of up to 1 second, and its background is unknown. As a large class of buildings in the big cities like Nairobi falls in this period range, the deficiency of the code must be of serious concern. Since Class A of NEHRP represents a stronger class of rock (vs > 1 500 m/s) than the others, the corresponding spectral curve exhibits the lowest spectral ordinates for the most part. This class of rock is included to account for the strong crustal rock formation prevalent in the central and eastern part of the US. Many codes worldwide, including the European code, do not include this class of rock.
African versus NEHRP spectra: soil sites
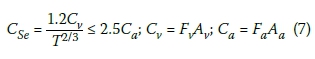
The design spectra of the NEHRP 2003 (BSSC 2004) for soil classes C to E are plotted in Figure 17 for a selected PGA of 0.05 g together with the design spectra of the African codes for soil sites. This particular value of PGA is selected for consistency, with the comparison made in the next section to study the influence of return period. To avoid further congestion, and because of their similarities, the South African and the Eurocode spectra are plotted separately in the next section.
The plots in Figure 17 show that the spectra of most sub-Saharan African codes can be smaller by up to 60% of those of NEHRP. The spectra of the Kenyan code are even much smaller, being only 25% of NEHRP spectra in an important range of periods typical of commonly built types of buildings.
In general, the spectra of the sub-Saharan African codes are deficient over a wide range of period up to at least 1 second. This range encompasses most common-purpose structures built in African cities, including individual residential houses, schools, apartments, office flats, public offices, hotels, hospitals, etc, with heights reaching up to around 15 storeys. In the case of Soil Class E, buildings of almost any height would be under-designed by the provisions of sub-Saharan African codes.
The spectral discrepancies in Figure 17 clearly show the inadequacy of the old approach, on which most African codes are based, to account for site effect. Comparisons for other seismic zones can be made analogously, but the trend remains similar.
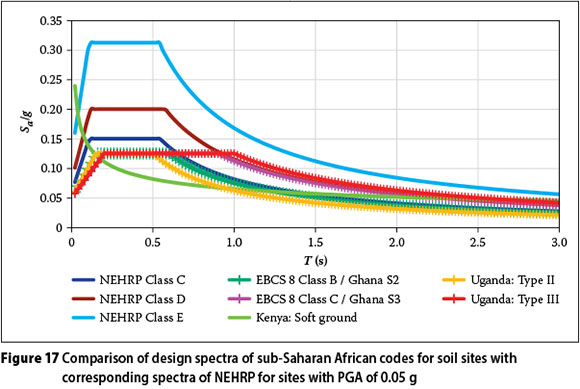
African versus Eurocode 8 spectra: soil sites
Comparison of the design spectra in the sub-Saharan African codes with the spectra of the European code is more direct forward, as all of them use PGA to characterise seismicity. This fact enables the comparison of normalised spectra regardless of the seismicity of regions. Comparison with Type 1 spectra of Eurocode 8 (2004) are given in Figure 18.
The plots show that the spectra of most sub-Saharan African codes can be smaller by up to 30% of Type 1 spectra of Eurocode 8, whereas in the Kenyan case, this can reach 58%. These discrepancies are still substantial, but comparatively smaller than the discrepancies observed with respect to the NEHRP spectra, whose amplification factors are consistently larger than those of Eurocode 8.
It should be emphasised that, compared to the Eurocode 8 amplification factors, the amplification factors of NEHRP are supported by evidence from a significant number of independent research works on a larger database enriched by ground motion records from the 1989 Loma-Prieta and the 1994 Northridge strong earthquakes (Borcherdt 1994; Rodriguez-Marek et al 1999; Borcherdt & Fumal 2000; Dobry et al 2000; Dobry & Susumu 2000; Borcherdt 2002; Crouse & McGuire 2002; Stewart et al 2003).
The combined influence of return period and site soil
Of the five seismic codes of sub-Saharan African nations considered in this study, the South African and Ugandan codes adopted a return period of 475 years for the design earthquake, though the latter does not state this explicitly. On the other hand, the Ethiopian code unambiguously states a return period of 100 years only. The return period employed by the Kenyan code is not clearly stated, but one can infer from its seismic map and the associated zone factors that its return period cannot be more than 100 years. Similarly, the Ghanaian code does not explicitly state its return period. However, when compared to the GSHAP map of Figure 10(a), the PGAs reaching up to 0.35 g in this local code suggest that the corresponding return period should be much larger than 475 years.
In order to study the combined effect of return period and site effect, we shall focus on the Ethiopian, Kenyan and Ghanaian codes, which adopt a return period different from 475 years. For this purpose, a site is selected in each of these countries within the same zone of the GSHAP map of Figures 10(a) and 10(b). This zone is selected as the one shaded in yellow with PGAs of 0.08 to 0.16 g. Addis Ababa of Ethiopia, Nakuru of Kenya and Accra of Ghana belonging to this zone are selected for comparison purposes of the combined influence of site soil and return period.
According to the GSHAP map of Figures 11(a) and 11(b), a representative PGA of 0.1 g may be assumed for the design earthquake in all of these places. In contrast, according to the respective local codes, Addis Ababa belongs to Zone 2 with a PGA of 0.05 g, Nakuru belongs to Zone VIII-IX with a PGA of 0.05 g, and Accra belongs to Zone 3 with a PGA of 0.35 g.
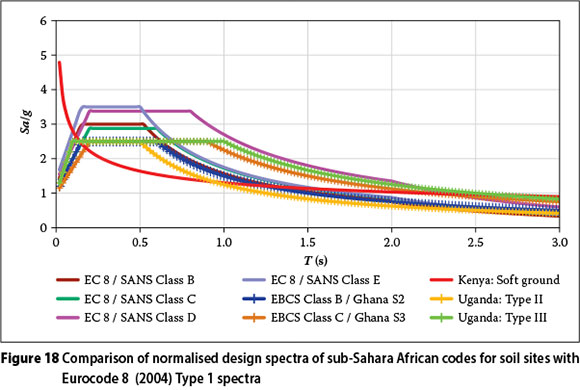
The NEHRP spectra corresponding to a PGA of 0.1 g for soil sites are presented in Figure 19 in comparison with the spectra for soil sites according to the African local codes. The comparisons are made for rock and soil sites separately.

The plots in Figure 19(a) for rock sites show that the design spectra of the East African codes of Ethiopia and Kenya can result in less than 50% of the spectra of NEHRP adapted to the GSHAP seismic hazard map. Since the site effect is zero for rock sites, the differences in these spectral curves reflect the influence of the return period of the design earthquake only. On the other hand, the spectra of the Ghanaian code can be close to threefold of the NEHRP spectra and five to tenfold of the Ethiopian and Kenyan spectra respectively.
Similarly, the plots in Figure 19(b) for soil sites exhibit a more pronounced difference between the NEHRP spectra and those of the East African countries of Ethiopia and Kenya. The NEHRP spectra could be as large as fivefold of the East African spectra. This suggests that the design ground motion provisions of the East African codes are highly inadequate to ensure safety. The Ghanaian spectra are still larger than the NEHRP spectra. This is despite the small site amplification factors of a maximum of 1.5 employed by this code, compared to up to 3.5 proposed by NEHRP. The results are indicative of flaws likely to have occurred in the background work of seismic hazard assessment that led to the local seismic hazard map of Ghana.
According to the plots in Figure (19), nearly all ranges of buildings (T of up to 3 s) built on any soil formation would be severely under-designed by the inadequate provisions of the East African codes of Ethiopia and Kenya. On the extreme opposite end, the Ghanaian code demands unjustifiably too large design forces for structures of all types on all categories of soil sites.
CONCLUSION
The status of the design ground motion provisions of representative sub-Saharan African codes has been assessed in terms of two basic issues of site effect and return period. The provisions are compared among the five selected codes and against NEHRP and the current European code. With the exception of the Ethiopian and the South African codes, the return periods are not clearly stated in the codes. The Ethiopian code clearly states 100 years as its return period for the design earthquake, whereas the South African code explicitly states 475 years. Through inference, the Kenyan and Ugandan codes seem to employ 100 years and 475 years, respectively. The Ghanaian code seems to have a major flaw in its seismic hazard map, because its zone factors are too large to suit the seismicity of the region.
In terms of site effect provisions, all, except for the recent South African code, use site-dependent design spectra that are based on the outdated average spectra proposed by Seed et al (1976). The South African code directly adopted the design spectra specified by the current European code by simply omitting the softest site group. It is interesting to note that the recently revised Ghanaian and Ugandan codes have not incorporated the state of the art in site amplification potential. For this reason, most of the sub-Saharan African site-dependent design spectra can result in design seismic forces that are 30% to 75% smaller than would be obtained in accordance with the provisions of American and European codes. This is without considering the effect of the return period.
A comparison of the design spectra for rock sites reveals that the use of a return period of the design earthquake less than 475 years results in further underestimation of the design seismic forces. For example, the use of 100-years return period, which is the case in the Ethiopian code, would cause a further reduction of around 50% of the design force.
In most of the sub-Saharan codes considered, combined deficiencies from both site effect and return period are prevalent. When both shortcomings are considered, design seismic forces could be smaller than 20% of what would be calculated based on provisions of recent codes in Europe and USA.
The South African code has properly incorporated the state of the art of both site effect and return period. However, it is not clear why the European site-dependent spectra are favoured over the NEHRP spectra, while the NEHRP spectra and the corresponding site classification and amplification factors are supported by a larger number of independent studies on a large database, compared to the European spectra.
Apparently both the 1990 and 2010 editions of the Ghanaian code equally suffer from flaws in the background seismic hazard assessment study that led to the unrealistic seismic zone factors equivalent to PGA values ranging from 0.15 g to 0.35 g. In addition, even the 2010 edition failed to incorporate the current state of knowledge of site effect.
Based on the observations made above from the perspective of design ground motion alone, it may be concluded that most of the sub-Saharan seismic codes need careful revision, and in some cases a thorough overhaul, to provide adequate safety to human life and to the badly needed infrastructure and building structures. It is hoped that the GEM initiative will come up soon with important tools to rectify most of the identified shortcomings observed in the local codes and to provide a common platform that can lead to a continental harmonisation of approaches.
REFERENCES
Allotev, N K, Arku, G & Amponsah, P E 2010. Earthquake-disaster preparedness: The case of Accra. International Journal of Disaster Resilience in the Built Environment, 1:140-156. [ Links ]
Amponsah, P E 2004. Seismic activity in Ghana: Past, present and future. Annals of Geophysics, 47(2/3):539-543. [ Links ]
Amponsah, P E, Banoeng-Yakubo, B K, Panza, G F & Vaccari, F 2009. Deterministic seismic ground motion modeling of the greater Accra metropolitan area, southeastern Ghana. South African Journal of Geology, 112:317-328. [ Links ]
Borcherdt, R 1994. Estimates of site-dependent spectra for design - Methodology and justification. Earthquake Spectra, 10(4):617-653. [ Links ]
Borcherdt, R & Fumal, T 2000. Empirical evidence from the Northridge earthquake for site-specific amplification factors used in US building codes. Proceedings, 12th World Conference on Earthquake Engineering, Auckland, New Zealand, pp 1-6. [ Links ]
Borcherdt, R 2002. Empirical evidence for site coefficients in building code provisions. Earthquake Spectra, 18(2):189-217. [ Links ]
BRRI (Building and Road Research Institute) 1990. Code for the Seismic Design of Concrete Structures. Kumasi, Ghana: Council for Scientific and Industrial Research (CSIR-INSTI). [ Links ]
BRRI (Building and Road Research Institute) 2010. [ Links ]
The Seismic Design of Concrete Structures. Kumasi, Ghana: Council for Scientific and Industrial Research (CSIR-INSTI). [ Links ]
BSSC (Building Seismic Safety Council) 1995. National Earthquake Hazard Reduction Program (NEHRP): Recommended Provisions for Seismic Regulations for New Buildings. Washington DC: BSSC, FEMA 222A and 223A (Provisions and Commentary). [ Links ]
BSSC (Building Seismic Safety Council) 1998. National Earthquake Hazard Reduction Program (NEHRP): Recommended Provisions for Seismic Regulations for New Buildings and Other Structures. Washington DC: BSSC, FEMA 302 and 303 (Provisions and Commentary). [ Links ]
BSSC (Building Seismic Safety Council) 2004. National Earthquake Hazard Reduction Program (NEHRP): Recommended Provisions for Seismic Regulations for New Buildings and Other Structures, Washington DC: BSSC, FEMA 450. [ Links ]
Crouse, C & McGuire, J 2002. Site-response studies for the purpose of revising the NEHRP seismic provisions. Earthquake Spectra, 12(2):407-439. [ Links ]
Dobry, R, Borcherdt, R, Crouse, B, Idriss, I, Joyner et al 2000. New site coefficients and site classification system used in recent building seismic code provisions. Earthquake Spectra, 16(1):41-67. [ Links ]
Dobry, R & Susumu, I 2000. Recent development in the understanding of earthquake site response and associated seismic code implementation. Proceedings, GeoEng2000, International Conference on Geotechnical & Geological Engineering, Melbourne, Australia, pp 186-129. [ Links ]
Eurocode 8: 1994. Design Provisions for Earthquake Resistance for Structures. Brussels: European Committee for Standardisation. [ Links ]
Eurocode 8: 2004. Design of Structures for Earthquake Resistance. Brussels: European Committee for Standardisation. [ Links ]
Girdler, R W & McConnell, D A 1994. The 1990 to 1991 Sudan earthquake sequence and the extent of the East African Rift System. Science Magazine, 264(5155):67-70. [ Links ]
Ghosh, S 2001. Trends in the seismic design provisions of US building codes. PCI Journal, Sept-Oct:98-102. [ Links ]
Ghosh, S 2004. Update on the NEHRP provisions: The resource document for seismic design. PCI Journal,
May-June:96-102.
Grünthal, G, Bosse, C, Sellami, S, Mayer-Rosa, D & Giardini, D 1999. Compilation of the GSHAP regional seismic hazard for Europe, Africa and the Middle East. Annals of Geophysics, 42:1215-1223. http://www.a4architect.com/2011/09/18/why-buildings-collapse-in-kenya/ http://www.globalquakemodel.org/ http://gmo.gfz-Potsdam.de/pub/GSHAP_Map_Online/gshap_map_online_frame.html http://www.iaee.or.jp/ http://www.seismo.ethz.ch/static/gshap/Gshap98-stc.html http://www.ugpulse.com/uganda-news/business/ engineers-concerned-about-collapsing-buildings/9053.aspx http://www.usgs.org/ [ Links ]
MWK (Ministry of Works of Kenya) 1973. Code of Practice - Earthquake Design for Kenya. Nairobi: MWK. [ Links ]
MWUD (Ministry of Works and Urban Development of Ethiopia) 1995. EBCS 8: Design of Structures for Earthquake Resistance. Addis Ababa: MWUD, Ethiopian Building Code Standard. [ Links ]
Newmark, N M & Hall, W J 1969. Seismic design criteria for nuclear reactor facilities. Proceedings, 4WCEE, Santiago, Chile, Vol. II, B5, pp 1-12. [ Links ]
Newmark, N M & Hall, W J 1982. Earthquake spectra and design. Engineering Monographs on Earthquake Criteria, Structural Design and Strong Motion Records, Vol 3, Oakland, CA: Earthquake Engineering Research Institute (EERI). [ Links ]
Oloyede, S A, Omoogun, C B & Akinjare, O A 2010. Tackling causes of frequent building collapse in Nigeria. Journal of Sustainable Development, 3(3):127-132. [ Links ]
Oteng-Ababio, M. 2012. Neglected vulnerabilities in a rapidly urbanizing city: Reflections on earthquake risks in Accra. Journal of Housing and the Built Environment, 27:187-205. [ Links ]
Rey, J, Faccioli, E & Bommer, J 2002. Derivation of design soil coefficients (S) and response spectral shapes for Eurocode 8 using the European Strong-Motion Database. Journal of Seismology, 6:547-555. [ Links ]
Rodriguez-Marek, A, Bray, J & Abrahamson, N 1999. Characterization of site response general categories. Berkley, CA: University of California, Pacific Earthquake Engineering Research Center, PEER Report 1999/2003. [ Links ]
SABS (South African Bureau of Standards) 2010. SANS 10160-1: Basis of Structural Design and Actions for Buildings and Industrial Structures. Pretoria: SABS. [ Links ]
Seed, H B, Ugas, C & Lysmer, J 1976. Site-dependent spectra for earthquake-resistant design. Bulletin of the Seismological Society of America, 66(1):221-244. [ Links ]
Sousa, P M, Barros, R C & Bommer J J 2008. Assessment of seismic hazard and structural safety of buildings in Beira and Chimoio. Proceedings, 14th World Conference on Earthquake Engineering, 12-17 October, Beijing, China. [ Links ]
Stewart, J, Liu, A & Choi, Y 2003. Amplification factors for spectral acceleration in tectonically active regions. Bulletin of the Seismological Society of America, 93(1):332-352. [ Links ]
UNBS (Uganda National Bureau of Standards) 2003. US 319:2003: Seismic Code of Practice for Structural Designs. Kampala, Uganda: UNBS. [ Links ]
Wium, J 2010. Background to SANS 10160 (2009). Part 4: Seismic loading. Journal of the South African Institution of Civil Engineering, 52(1):20-27. [ Links ]
Worku, A 2001. Comparison of seismic provisions of EBCS 8 and current major building codes pertinent to the equivalent static force analysis. Zede, Journal of the Ethiopian Engineers and Architects, 18:11-25. [ Links ]
Worku, A 2011. Recent developments in the definition of design earthquake ground motions calling for a revision of the current Ethiopian Seismic Code - EBCS 8: 1995. Zede, Journal of the Ethiopian Engineers and Architects, 28:1-15. [ Links ]
 Contact details
Asrat Worku
PO Box 3 0 020
Nairobi 00100
Kenya
T: +254 20 225 1880/0577
M: +254 725 617420
F: +254 20 221 0694 / +254 20 224 4493
E: aworku@gibbinternational.com
E: asratie@gmail.com

PROF ASRAT WORKU is an Associate Professor of Civil Engineering at Addis Ababa University (AAU), Ethiopia, and is currently also working as Operations Manager for Geotechnics at Gibb International in Nairobi. He completed his BSc degree in Civil Engineering in 1983, and, specialising in geotechnics, his MSc degree in 1989, both from AAU, IN 1996 he earned his DrIng degree from Wuppertal University, Germany, with a dissertation on seismic soil structure interaction. He has practised in both structural and geotechnical engineering. His industry experience in geotechnics spans various types of major projects in several African countries.

