


Serviços Personalizados
Artigo
 Inglês (pdf)
 Artigo em XML
 Referências do artigo
Indicadores

Links relacionados
-
 Citado por Google
 -
 Similares em Google
Compartilhar

 Permalink
Journal of the South African Institution of Civil Engineering
versão On-line ISSN 2309-8775
versão impressa ISSN 1021-2019
J. S. Afr. Inst. Civ. Eng. vol.55 no.3 Midrand Jan. 2013
TECHNICAL PAPER
Exploring the flow number (FN) index as a means to characterise the HMA permanent deformation response under FN testing
L F Walubita; J Zhang; A E Alvarez; X Hi
ABSTRACT
Permanent deformation (PD), or rutting, is one of the common distresses occurring in hot-mix asphalt (HMA) pavements. As part of the HMA mix- and structural-design processes to optimise field performance, various laboratory tests, including the Hamburg wheel tracking test (HWTT) and flow number (FN), have been developed to characterise the HMA mix rutting resistance potential. With this background, this study was conducted to explore the potential of routinely using the FN test to characterise the PD response of Texas HMA mixes as a supplement to the HWTT. Towards this goal, a new PD parameter - the FN index - was developed to differentiate and screen the HMA mixes. The research methodology incorporated a two-phase approach, namely: (1) laboratory testing and (2) field correlations. Overall, the findings indicated that the FN index, computed from the FN test data, has the ability to statistically differentiate the HMA mixes evaluated, as well as promising potential to supplement the HWTT for routine HMA mix-design and screening. In addition, the FN test has a practically reasonable test time (about three hours per specimen) and is cost-effective. However, the inability to readily test thin field cores and the need for field validation with long-term performance data remain some of the key challenges to be addressed with the FN test method.
Keywords: hot mix-asphalt (HMA), rutting, permanent deformation (PD), flow number (FN), FN test, FN index, Hamburg wheel tracking test
INTRODUCTION
Permanent deformation (PD) - also termed rutting - is one of the major distresses occurring in hot-mix asphalt (HMA) pavements. While the total PD in the HMA pavement structure can either be due to the HMA mix, subgrade or other structural layers, or contributions from all these, surface rutting is predominantly due to issues with the surface HMA mix rather than PD of the underlying layers -see Figure 1. Therefore, the focus of this study was on the PD of the HMA mix, assumed to be predominantly related to materials selection and HMA mix-design. However, this is not to discount the effects of poor structural design, poor construction practices, environmental effects, and/ or excessive traffic loading (Walubita et al 2012; WsDOT 2011).
As illustrated in Figure 1, the primary mechanism of PD in the HMA mix is shear deformation caused by large stresses in the upper portions of the HMA layers under traffic loading, particularly at elevated temperatures ( Walubita et al 2012). Thus, this type of PD occurs mostly in high shear locations, in particular at intersections where braking, accelerating/decelerating and slow moving traffic take place repeatedly. In addition, the PD distress is accelerated during the summer seasons, where the extreme high pavement temperatures contribute to the instability rutting of the HMA mix, particularly under high traffic loading and/or where softer asphalt binders have been used. On the pavement structure, rutting typically manifests itself as surface depressions in the wheel paths (Figure 1).
Properly designed HMA mixes, that are identified and screened by appropriate laboratory testing, are thus required to minimise the PD on the pavement surface and/or within the pavement structure when HMA mixes are used as intermediate layers. Rutting is considered a structural failure that undesirably distorts the pavement ride quality, and water pooling after rains often causes vehicle hydroplaning with a high potential for traffic accidents. Also, pavement maintenance or rehabilitation activities are financially straining. Thus, the selection of sufficiently rut-resistant HMA mixes during the HMA mix-design stage, based on appropriate laboratory testing, is crucial (Walubita et al 2012).
Currently existing HMA PD-related tests
Various laboratory tests are currently in use to characterise the HMA mix PD response, including field PD performance prediction. These tests include the Hamburg wheel tracking test (HWTT), asphalt pavement analyser (APA), dynamic modulus (DM), repeated load permanent deformation (RLPD), flow time (FT) and flow number (FN) (AASHTO 2001; Abdallah & Nazarial 2011; Archilla et al 2007; Goh et al 2011; Mohammad et al 2006; Walubita et al 2012; Witczak et al 2002; Witczak 2007; Zhou & Scullion 2001). Walubita et al (2012) comparatively evaluated the HWTT, DM and RLPD tests and concluded that each test has its own merits and demerits, and that the onus is to be cautious as to which test to use depending on the specific engineering needs. Although there are inherent issues of high sample confinement and the inability to readily capture the HMA mix shear properties, the overall conclusions were that, of the three tests that were evaluated (Walubita et al 2012), the HWTT is the most practical test for daily routine HMA mix-design and screening. The RLPD and DM tests were found to be better suited for structural design applications, such as generating input data for mechanistic-empirical models (Walubita et al 2012). In fact, the Texas Department of Transportation (TxDOT) currently uses the HWTT, as Test Procedure designation Tex-242-F (TxDOT 2011), for routine HMA mix-design and screening in the laboratory, as well as an indicator of field rutting performance.
Study objective and scope of work
With the above background in mind, this study was undertaken to explore the potential of routinely using the FN test to characterise the PD resistance of Texas HMA mixes as a supplement to the standard HWTT test method (TxDOT 2011). Various Texas HMA mixes were comparatively tested in both the FN test and HWTT, and also related to in situ field performance (for some selected mixes). The observed advantages and disadvantages of the FN test in comparison to the HWTT are also discussed in the paper.
In terms of the paper organisation, following this introduction is a description of the FN test, along with the FN analysis models and output parameters, and the HWTT. The experimental design is then presented, followed by the laboratory test results and analysis and preliminary correlations with field performance data. The paper then concludes with a comparison of the laboratory test methods and a summary of key findings and recommendations.
THE FLOW NUMBER (FN) TEST METHOD
The FN is one of the laboratory PD tests that show promise for rutting performance evaluation of HMA mixes, which can be used as a supplement to the HWTT (Archilla et al 2007; Goh et al 2011; Mohammad et al 2006; Witczak et al 2002; Witczak 2007; Zhou & Scullion 2002; Zhou & Scullion 2003; Zhou et al 2004). As shown in Figure 2, the FN test involves application of a specific vertical compressive (dynamic) stress level to measure the HMA accumulated vertical deformations as a function of time or load cycles. As Figure 2 shows, the Universal Testing Machine (UTM-25) was used to conduct the FN test.
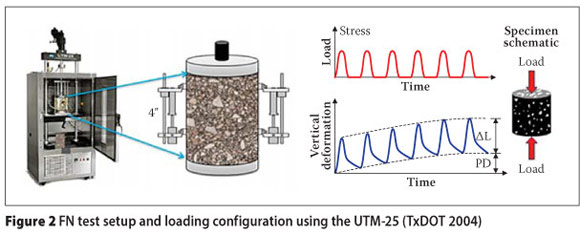
In this study, the FN test was conducted at 50°C (122°F) for temperature consistency with the HWTT test - which is subsequently discussed - and to closely simulate the average Texas high summer pavement surface temperatures (when HMA mix rutting is generally more critical). A compressive repeated Haversine stress-controlled loading mode at 1 Hz (0.1 seconds loading plus 0.9 seconds rest period = 1 cycle) was applied using the UTM (see Figure 2). Based on several trial tests by these researchers at 50°C, the applied stress was selected as 207 kPa (30 psi) in magnitude with zero confinement stress for all the mixes evaluated in this study. The FN test was set to terminate at 10 000 load cycles or after accumulation of 30 000 micro-strains, whichever came first (i.e. after about 3 hours of testing time or 166.7 minutes to be exact).
With these test parameters, a single FN test on an HMA mix cylindrical specimen - 100 mm (4 inches) diameter by 150 mm (6 inches) in height - lasted for at most three hours. The HMA mix specimens were temperature-preconditioned for a period of approximately three hours prior to testing, with the temperature monitored via a thermocouple probe inserted inside a dummy HMA mix specimen also placed in the same temperature chamber as the test specimens.
Data analysis models and output parameters
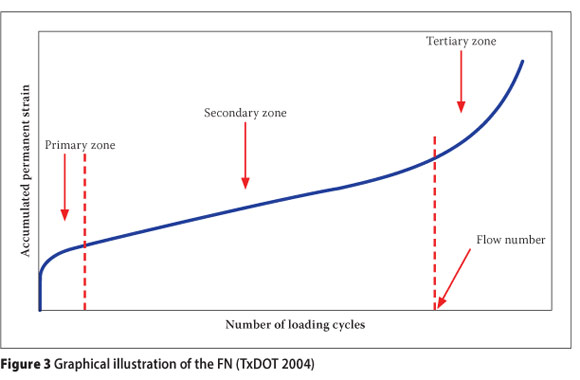
During FN testing, the primary output data include the load (stress), number of load cycles (or load cycles), deformation (strain) and time per load cycle. Based on a plot of accumulated permanent strain versus load cycles, the following PD parameters are generated and used as indicators of the HMA mix rutting resistance potential:
■ Flow number (FN), in cycles
■ Accumulated permanent strain (or permanent strain) at tertiary flow (imagemaquiEp(F)), in microns
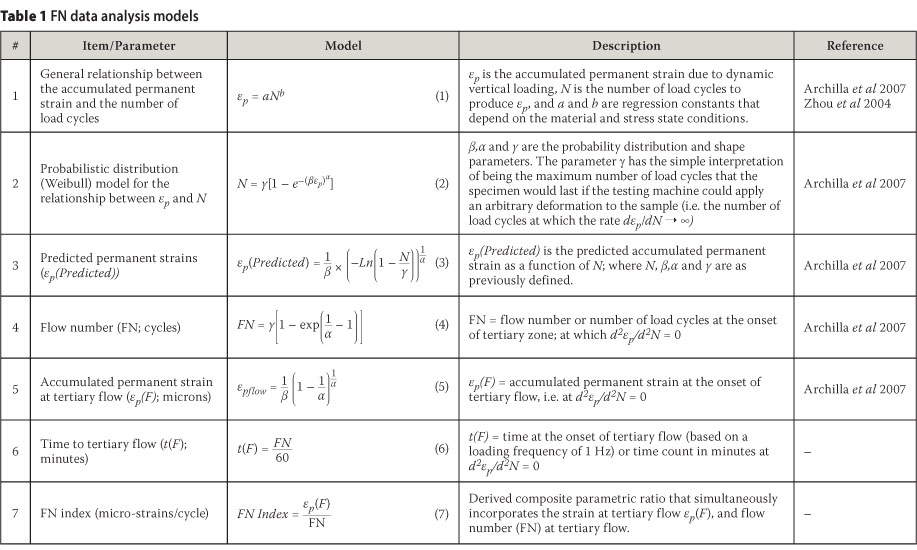
■ Time to tertiary flow (t(F)), in minutes. The respective analysis models for computing these parameters are listed in Table 1. The FN is defined as the number of load cycles for which the slope of the curve of accumulated permanent strain versus load cycles is minimum (Archilla et al 2007; WsDOT 2011) or as the number of load cycles at which tertiary flow (i.e. tertiary zone) begins (Figure 3). As shown in Figure 3, tertiary flow is differentiated from secondary flow by a distinctive departure from the linear relationship between the cumulative permanent strain and number of load cycles in the secondary zone. Thus, the "PD failure" of the HMA mix was defined as the point of onset of tertiary flow.
The flow number (FN) index concept
In addition to the traditional FN (cycles), εp(F), and t(F) parameters, the FN index was introduced (Table 1) as an exploratory concept to fully capture the HMA mix PD response and is defined as the ratio of εp(F) to FN (cycles) at tertiary flow. Theoretically, lower FN index values are related to HMA mixes that are more stable and resistant to PD. The opposite should also theoretically hold. As a supplement and/or surrogate to the individual classical PD parameters, the basic idea was to investigate if a simple composite parameter or a derivative (the FN index) that combines the classical individual PD parameters, provided superior and/or more distinctive differentiation and screening capabilities of the HMA mixes.
THE HAMBURG WHEEL TRACKING TEST (HWTT)
In Texas, the HWTT is the standardised routine test used for characterising both the rutting resistance potential and stripping susceptibility (i.e. moisture damage potential) of HMA mixes in the laboratory (TxDOT 2011).
The standard HWTT test parameters that were used are 703 N (158 lbs) vertical loading, applied at a rate of 52 passes per minute in a 50°C (122°F) water bath; with 150 mm (6-inch) diameter by 62.5 mm (2.5-inch) in height paired specimens loaded up to 20 000 HWTT load passes for about 6 hours 25 minutes (about twice the FN test time) (TxDOT 2011). The primary output data is the HMA mix rut depth as a function of the number of load passes. The terminal HWTT rutting failure criterion in the State of Texas is 12.5 mm ( 1/2-inch) rut depth, i.e. RutHWTT <12.5 mm (TxDOT 2011; Zhou & Scullion 2001).
EXPERIMENTAL DESIGN
Six Texas HMA mixes were evaluated, including crack attenuating mixtures (CAM), permeable friction course (PFC), Type B (coarse-graded), Type D- and F-dense graded mixes, and stone matrix asphalt (SMA) mixes; Table 2 presents the corresponding mix design characteristics. For each HMA mix, a minimum of three replicate samples were molded from HMA plant-mix materials and tested per each test type. With the exception of the PFC mix samples that were molded to a final density of 80±2%, all the other HMA samples were molded to a final target density of 93±1% as specified by the TxDOT standards (TxDOT 2004).
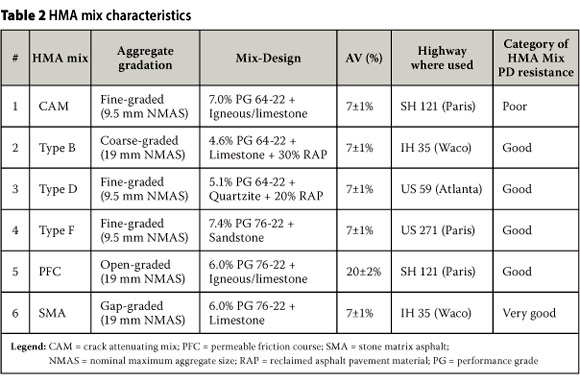
The categorisation of mix PD resistance in the last column of Table 2 was based on the rutting resistance performance and stiffness of the mixes from previous laboratory testing (i.e. HWTT, RLPD and DM) and historical field performance observations (Walubita et al 2012). However, this categorisation should not be taken as a standard, but was merely used as a reference guide for this study.
LABORATORY TEST RESULTS AND ANALYSES
This section presents the results and the corresponding data analyses, based on a minimum of three replicate samples (or sample sets) per mix per test type. However, it should be noted that these test results pertain only to the HMA mixes and the laboratory test conditions defined in this study. Therefore, the overall findings and conclusions may not be exhaustive.
FN test results
Figure 4 shows an example of a plot of the accumulated permanent strain and strain rate (slope) determined from the FN test data using the models listed in Table 1 (i.e. Equation 3) and the MS Excel spreadsheet optimisation technique based on minimising the sum of square error method (Archilla et al 2007).
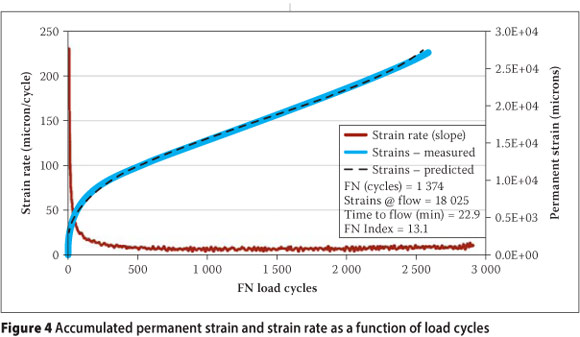
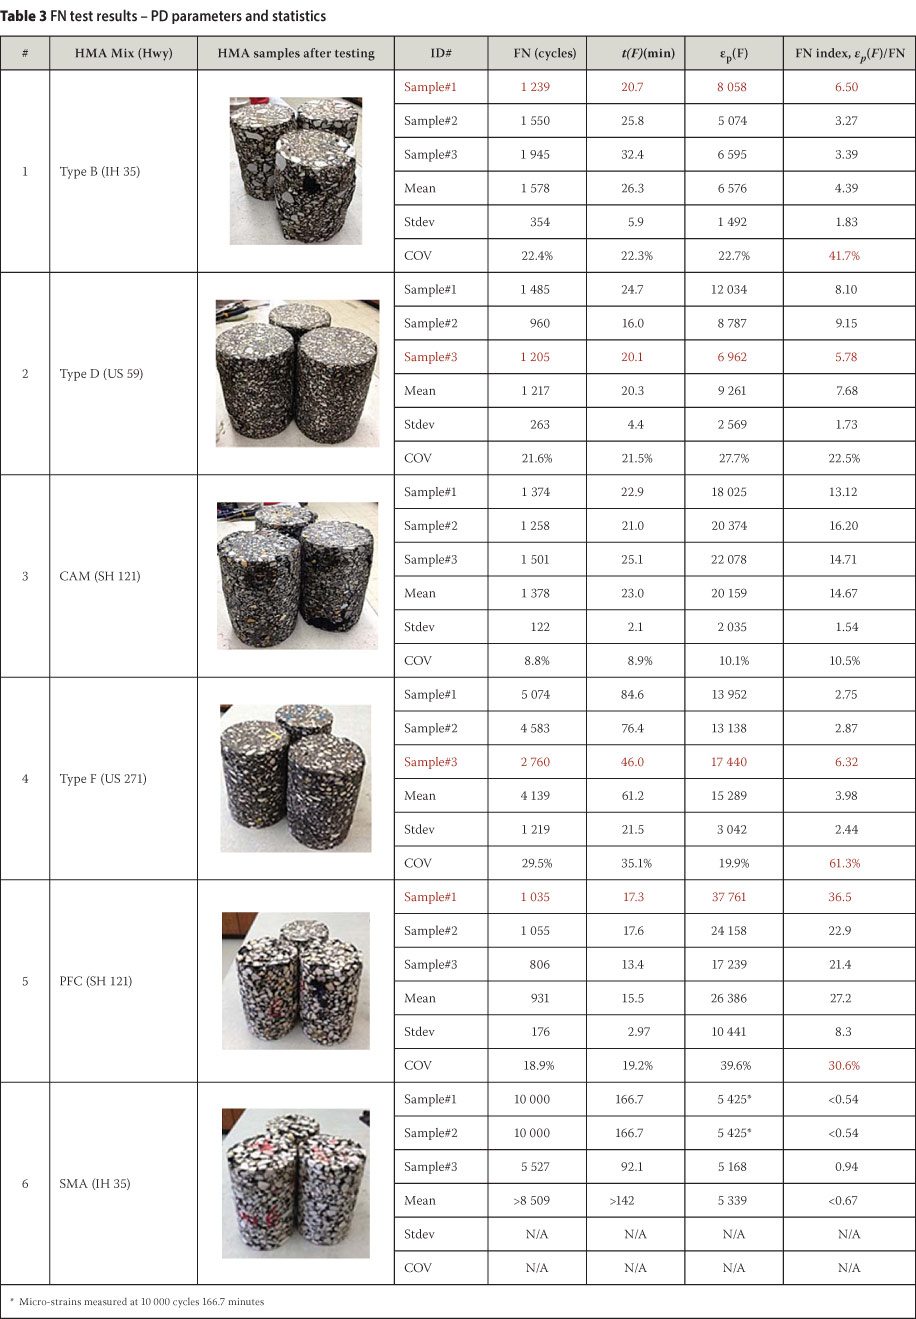
Table 3 presents the FN test results -computed for each HMA mix as exemplified in Figure 4 - and the corresponding statistics expressed in terms of the mean, standard deviation (Stdev), and coefficient of variation (COV) values. In addition, Figure 5 shows a comparison of the computed FN test parameters. This comparison suggests that the ep(F) parameter exhibits no trend and will thus be unable to effectively differentiate and screen the HMA mixes. On the other hand, both the FN (cycles) and t(F) parameters are showing the theoretically expected opposite trend to that of the FN index, except for the deviation in the trend by the CAM mix; i.e. the higher the FN (cycles) and t(F) parameters in magnitude, the lower the FN Index.
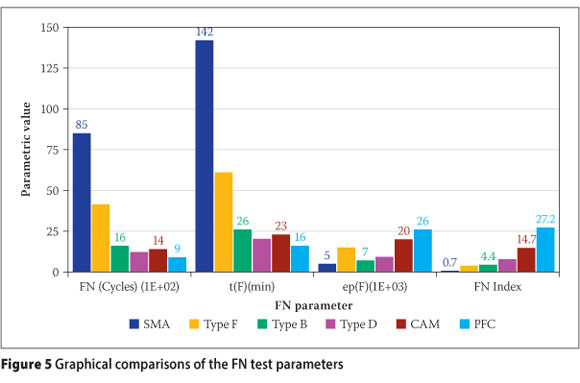
Theoretically, the lower the FN index in magnitude, the more resistant to PD the HMA mix is. Thus, the ranking of the HMA mixes based on the FN index would be as follows: SMA (best) → Type F → Type B → Type D → CAM (second poorest) → PFC (poorest). As indicated in Table 3, two specimens of the SMA mix even lasted up to 10 000 load cycles (i.e. FN index
In addition, it should be noted that while the TxDOT specification (TxDOT 2004) calls for use of PG 76-22 asphalt-binder for all the CAM mix-designs, the contractor mistakenly used a lower soft-grade PG 64-22 asphalt-binder on the SH 121 project. This could have partially contributed to this mix's fifth ranking (or second poorest) performance based on the FN index. In the field (i.e. highway SH 121 project, Table 2), however, and as discussed subsequently, the 1.5 inch thick cover of the PFC surfacing mix, overlaying the 2 inch thick CAM layer, is theoretically expected to mitigate the potential PD problems of the CAM layer.
The inferior performance of the PFC mix (i.e. poorest in the ranking) was partly due to its high total AV content (i.e. 20±2%) and the fact that the FN test was conducted in an unconfined mode. Considering the fact that the PFC mix develops stone-on-stone contact for rutting resistance, similar to the SMA, and has generally performed well in the field (McDaniel et al 2010), this result may suggest that the unconfined FN test is not ideal for the high AV content PFC mixes. These mixes should probably be tested in a confined FN test loading configuration.
Discrimination and screening of HMA mixes based on the FN test parameters
Figure 6 provides an assessment of the potential of the FN parameters to screen and discriminate the PD resistance of the mixes. A concept of discriminatory ratio (DR) was used, where the FN parametric value (i.e. FN (cycles), t(F), εp(F), and FN index) of a good mix is divided by that of the corresponding value of a poor mix. The larger the DR value in magnitude, the greater the difference between the mixes and the better the FN parameter to discriminate mixes. For this analysis, and based on the results in Figure 5 and Table 3, the SMA mix was adapted to be the best mix in terms of PD resistance and the CAM the poorest. The PFC mix was excluded from this analysis on account that the unconfined FN test appears to be unsuitable for these high AV mixes.
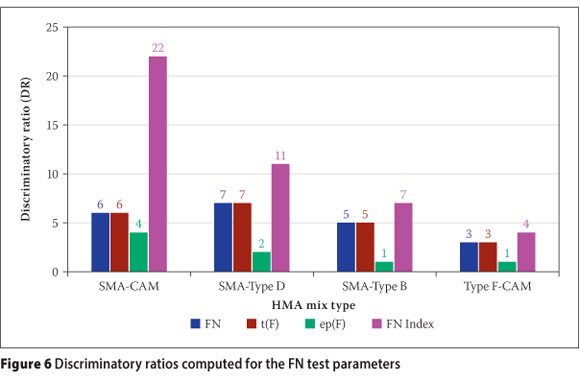
The DR values shown in Figure 6 indicate that the FN index provides a more distinctive differentiation and ranking capability of the mixes compared to the other parameters evaluated (i.e. high DR values in magnitude for the FN index). In particular, the ratio difference of the SMA-CAM (i.e. best versus poorest) with a DR value of 22 is visibly distinct. The εp(F) parameter on the other hand, with a DR of 1.0, shows no difference between the SMA versus Type B, and the Type F versus CAM, which is not the case with the other parameters evaluated. That is, the εp(F) parameter failed to sufficiently capture the differences in PD performance between these HMA mixes. Under this scenario (εp(F) parameter), the design engineer would not be able to readily differentiate the mixes when faced with a choice for design recommendations and may even end up selecting an inferior mix, because the laboratory PD performance prediction is hardly different.
Statistical analysis of the FN test parameters
Analysis of variance (ANOVA) and Tukey's Honestly Significant Differences (HSD) multiple comparison procedure (Tukey 1953) were used to statistically investigate the ability of the FN test parameters to differentiate the PD resistance of the HMA mixes. The results of these analyses, at a 95% confidence level, are summarised in Table 4.
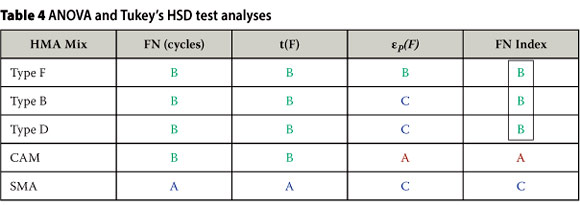
The statistical interpretation of the results in Table 4, for example the last column for the FN index, is as follows: the CAM mix has the highest FN index value and is statistically listed in Group A (poorest in terms of the PD resistance), whereas the SMA - with the lowest FN index value - is categorised as Group C (best in terms of the PD resistance). The Type F, B and D mixes on the other hand, have statistically indifferent FN index values that lie in-between Groups A and C, and are subsequently listed in the same Group B.
At a 95% confidence level, Table 4 shows that only the FN index is able to statistically differentiate the SMA (best) and the CAM (poorest) from the other mixes. Statistically, the FN index is inferring that the Type F, B and D mixes have insignificantly different PD resistance properties and that SMA and CAM mixes have significantly different PD resistance properties. By contrast, the FN (cycles) and t(F) parameters are unable to capture any statistical difference in the PD resistance potential among the Type F, Type B, Type D and CAM mixes, but are able to single out the SMA as being significantly different. The εp(F) parameter, on the other hand, considers the SMA to be statistically similar to the Type B and D mixes, while the Type F and CAM mixes are categorised as being statistically different. Thus, only the FN index is able to provide a reasonable statistical differentiation of the mixes.
For comparative studies of this nature, the εp(F) parameter would normally be analysed and interpreted in conjunction with FN (cycles) and/or t(F) or vice versa. Otherwise, one of the parameters must be held constant. That is, to meaningfully compare these mixes using the εp(F) parameter for instance, they must be evaluated at the same FN (cycles) or t(F) level. As evident in Table 3, the problem is that tertiary failure occurs at different FN (cycles) and εp(F) values for different mixes. Therefore, this logic would not apply unless the tertiary failure criterion is ignored. As supported by the preceding results, the FN index, which is a function of εp(F) and FN (cycles), takes care of this quandary.
Looking at the preceding analyses and discussions, it is evident that while some parameters may give a similar mix performance ranking (i.e. FN [cycles] versus FN index), the FN index exhibits statistically superior discrimination and screening capabilities for the HMA mixes evaluated in this study. However, evaluating more mixes and exploring means to minimise variability in the determination of this parameter will further serve to substantiate the FN index concept.
FN test parameters and HMA tertiary flow occurrence
As indicated in Table 3 and in the preceding discussions, two specimens (samples # 1 and 2) of the SMA mix lasted up to 10 000 load cycles without any tertiary failure, i.e. flow. For the FN test conditions prescribed in this study, if flow or tertiary failure does not occur within the specified 10 000 cycles after 166.7 minutes of FN testing time, the following two options are proposed:
a. The FN index should be calculated at 10 000 cycles as a function of the actual measured micro-strains at 10 000 cycles (166.7 minutes) and the final FN index result should be reported as being less than this calculated value, i.e. "FN index < Calculated Value". For the two SMA samples #1 and 2 in Table 3, the FN index calculated at 10 000 cycles corresponding to the measured micro-strains of 5 425 at 10 000 cycles is 0.54; so, the FN index results would be reported as "FN index < 0.54" (see Table 3).
b. Perform extrapolative data analysis to estimate the flow parameters using the models listed in Table 1, and then compute the FN index. In the case of the SMA sample #2 for instance, the extrapolated "flow parameters" would be as follows: FN = 544 326 cycles; t(F) = 9 072.1 minutes; εp(F) = 18 713 micro-strains. So, the estimated and corresponding FN index would be "FN index = 0.03 (extrapolated)".
However, extrapolation inherently introduces some uncertainties in the results obtained (i.e. there is no complete certainty to indicate that sample #2 would actually have reached flow at 544 326 cycles and 9 072.1 minutes).
Therefore, these researchers recommend adapting the former approach in situations where flow does not occur within the 10 000 cycles test conditions. Thus, the FN index results for the SMA mix would be reported and interpreted as follows:
1. FN index (sample # 1)
2. FN index (sample # 2)
3. FN index (sample # 3) = 0.94
4. FN index (SMA)
Comparison of FN test and HWTT results
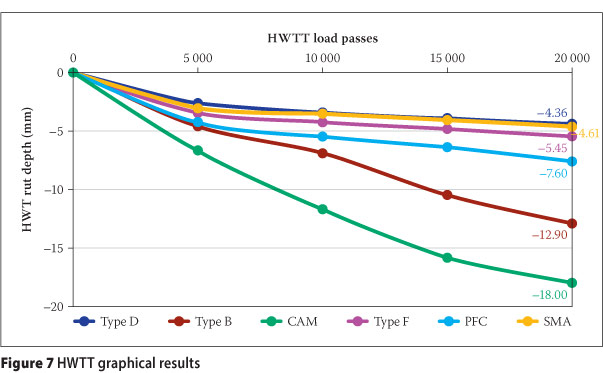
The average HWTT results based on three replicate test sets per mix type are shown in Figure 7, and the resistance to PD of the HMA mixes ranked as follows: Type D (4.36 mm) → SMA (4.61 mm) → Type F (5.45 mm) → PFC (7.60 mm) → Type B (12.90 mm) → CAM (18.00 mm; poorest). The difference in the ranking compared to the FN test results is partially attributed to the differences in the loading configuration and high sample confinement in the HWTT setup, unlike in the unconfined FN test. Even the high AV content PFC mix outperformed the Type B mix in the HWTT, which is not the case with the unconfined FN test. The possibility of moisture damage (i.e. stripping of the Type B mix) could have been another factor, with the inflexion point seemingly occurring after 10 000 HWTT load passes in Figure 7. In either case, however, the CAM mix still remains at the bottom of the ranking. Lower asphalt-binder PG grade, high asphaltbinder content, and fine aggregate gradation (Table 2) could be some of the contributing factors for this particular result.
Like for the FN index, a DR analysis of the HWTT data also exhibited a distinctive difference in the laboratory rutting performance between the SMA and CAM mix, with a DR value of 4.0. However, the DR trends for the other mix comparisons did not correlate with the FN test results - possibly on account of the differences in the test loading configuration and sample confinement as previously discussed. The extreme HWTT sample confinement may be over-scoring the true PD performance of some of these mixes. As lately experienced in the State of Texas, some HMA mixes that passed the HWTT in the laboratory are failing in the field. These field failures could be related to poor screening during the mix-design process, partially due to this high specimen confinement. Excluding the PFC mix, the HMA mix ranking comparison is as shown in Table 5.
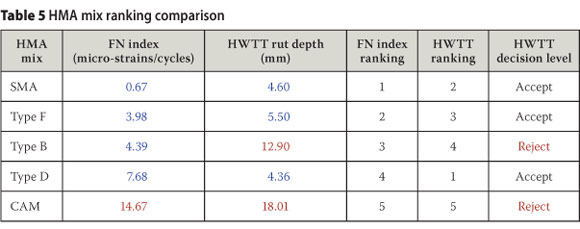
From Table 5, both test methods rank the CAM as the least PD-resistant mix, which like the Type B mix, would have been rejected under the HWTT screening criterion (i.e. rut depth greater than 0.5 inches). As evident in Table 5, the values of the HWTT rut depths for the SMA, Type F and Type D are statistically indifferent and could hypothetically be equated to the FN index ranking. The Type D mix, although having a lower asphalt-binder PG grade (PG 64-22; see Table 2) compared to its companions SMA and Type F (with PG 76-22), is composed of 20% RAP that adds to its PD resistance properties.
PRELIMINARY CORRELATIONS WITH FIELD PERFORMANCE DATA
As predicated by both the FN and HWTT laboratory test results, the 1¾ inch thick Type D surfacing mix on the US 59 highway has performed satisfactorily after being in service for over two years, while subjected to an average daily truck traffic (ADTT) of 1 500 vehicles at an average vehicle speed of 72.6 mph. As shown in Figure 8, the measured average surface rutting in 2012 was only 0.19 inches; thereby substantiating the laboratory test predictions.
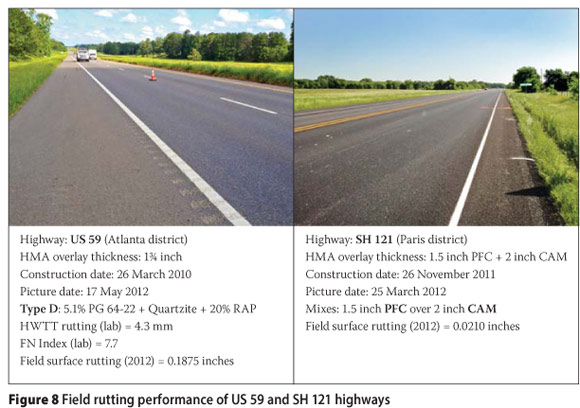
The SH 121 with a 2 inch thick CAM, overlaid by a 1.5 inch thick PFC surfacing mix, was constructed in November 2011 and is still performing well as shown in Figure 8. The measured average surface rutting after 8 months of service, at the time of writing this paper (i.e. under an ADTT of 427 vehicles, at an average vehicle speed of 70 mph) was only 0.02 inches, thus correlating the laboratory HWTT predictions for the PFC mix, and further providing evidence that the unconfined FN test is not ideal for PFC mixes.
The new 4 inch thick Type B mix on IH 35 is covered with a 1.5 inch thick SMA surfacing mix, and the 2 inch thick Type F on US 271 is covered with 1.5 inch thick PFC surfacing mix. These highways were constructed in late 2011 and are still performing well with no surface rutting observed in November 2012 at the time of writing this paper.
It should be noted that PD of HMA mixes, unlike other distresses, most often occurs in the early life of the pavement just after construction under traffic densification, particularly under extreme temperatures. Nonetheless, this is not to indicate that this distress will not occur in the design and service life of the pavement (i.e. continued conventional traffic loading, increase in traffic volume, overloading, subsequent summers, etc). However, the ongoing long-term performance monitoring of these highway sections will aid to further verify and validate these laboratory test results.
COMPARISON OF THE LABORATORY TEST METHODS
Table 6 provides a subjective itemisation of the characteristic attributes of the two rutting test methods based solely on the HMA mixes evaluated in this study and on the authors' experience with these test methods.
Overall, while the HWTT is the simplest, most practical and readily applicable for routine daily mix-design and screening, its major challenges include the adaptability to generate multiple HMA material properties (e.g. modulus) and high specimen confinement that tends to over-score the PD resistance performance of the mixes.
The FN shorter test time, as compared to that of the HWTT, means that the test is both cost-effective and applicable for daily routine use, particularly with the FN index parameter that exhibited potential to sufficiently discriminate and screen mixes. Inability to readily test thin field cores and the need for field validation are some of the key challenges associated with the FN test. In addition, the unconfined FN test setup appears unsuitable for testing PFC mixes.
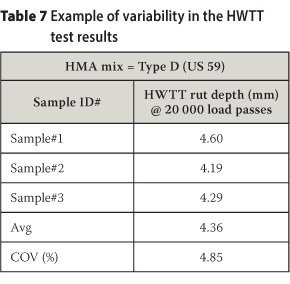
Compared to the FN variability and repeatability, with an overall average COV of 33% in the test results (Table 3), the HWTT exhibited statistical superiority with COV values less than 10% in the test results; see the example in Table 7 (Walubita et al 2012; Zhou & Scullion 2002).
As evident in Table 3, some of the HMA mixes (Type B, Type F and PFC) have FN parameters and statistics with COV values that are unacceptably on the higher side (i.e. greater than 30% in the case of the FN index). Although HMA, due to its visco-elastic nature, is generally associated with high variability at high test temperatures such as 50°C (particularly for unconfined tests like the FN), this high variability in Table 3 is primarily due to some outliers that may warrant exclusion from the overall analysis of the test results. Based on the FN index parameter in Table 3, Sample #1 (Type B), Sample #3 (Type D), Sample #3 (Type F), and Sample #1 (PFC) would be considered as outliers. If these outliers are discarded from the analysis, the statistics would be as shown in Table 8, which is considered to be reasonably acceptable and comparable to the HWTT. These statistics are also consistent with the AASHTO TP 79-12 recommendations for FN testing using the Asphalt Mixture Performance Tester (AMPT) (ASSHTO 2012).
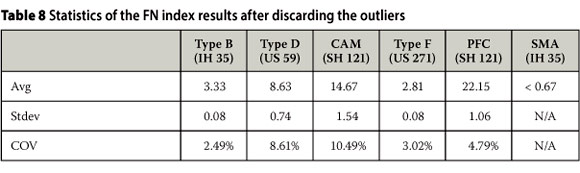
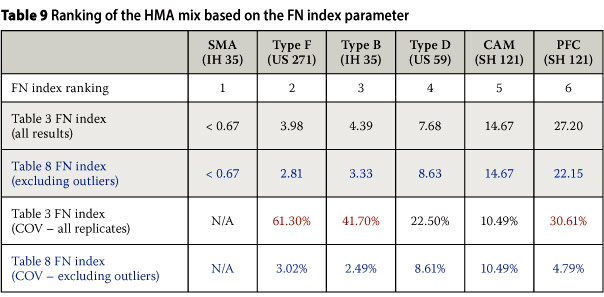
Statistically, Table 8 suggests that outliers should be excluded from the final analysis and interpretation of the FN index results. Furthermore, excluding the outliers, while having a significant impact on the statistical variability (COV), did not seem to significantly affect the HMA mix ranking and/or screening potential of the FN index parameter. As evident in Table 9, both Tables 3 and 8 show a similar ranking of the HMA mixes; but significantly different COV values for the Type B, Type D, Type F and PFC mixes. Nonetheless, more HMA mix testing is still warranted to substantiate these results and findings in future studies.
Like the HWTT (TxDOT 2011), the FN test was conducted at a single test temperature of 50°C. This single test temperature may not truly reflect the prevailing high (summer) and fluctuating field temperatures that would otherwise warrant the use of high asphalt-binder PG grades such as PG 76-22 on some highways. As such, there is need to explore the possibilities of conducting these tests at different and/or multiple test temperatures in future studies.
CONCLUSIONS AND RECOMMENDATIONS
In order to compare two PD-performance predictive laboratory tests, namely the FN test and HWTT, six types of HMA mixes were evaluated. The laboratory test data was accordingly supplemented with some limited field performance data from in-service highways where the same HMA mixes were used.
Based on the test methods and HMA mixes evaluated, the key findings, conclusions and recommendations drawn from this study are summarised as follows:
■ The FN index, computed from the FN test data, offers promising potential as parameter to use for differentiating and screening in the laboratory the resistance to PD of HMA mixes during the HMA mix-design stage. This fact and the shorter test time of the FN test, as compared to the HWTT, indicates that the FN test (i.e. based on the FN index computation) offers promise for routine HMA mixdesign in the laboratory as a surrogate and/or supplementary rutting test to the HWTT. However, caution must be exercised to watch out for outliers as these have the potential to statistically distort the final FN index results. Nonetheless, there is still a need to test more HMA mixes to supplement and validate these results/findings.
■ The conventional parameters computed based on the FN test - including the FN (cycles), t(F) and εp(F) - as individual parameters do not provide an effective, nor statistically significant, differentiation and screening of resistance to PD for the HMA mixes that were evaluated in this study. Therefore, application of these parameters for routine HMA mix-design and screening of PD resistance should be approached with caution. Unconfined FN testing should not be applied to PFC mixes as this tends to underestimate the potential PD resistance of these mixes, due predominately to their high AV content nature.
■ For baseline comparison with the HWTT, whose samples are tested under a tightly confining mold (i.e. no lateral or horizontal deformation), future FN tests should also be conducted in confined loading mode with no lateral deformation (i.e. bulging) of the samples. In general, test conditions should, as far as possible, be close to one another in comparative studies of this nature. Furthermore, conducting the confined FN testing will also help to further validate the laboratory performance of PFC mixes. With more test data, other options would be to explore the use of FN (cycles) to a predefined plastic strain limit (or set value) for easy comparison with the HWTT results.
■ For the highway sections evaluated, the FN index exhibited a promising correlation with field performance data. However, this was only limited data and as such, long-term performance monitoring with more field sections is strongly recommended to further validate the findings of this study and to establish some screening criterion/ threshold values for the FN index, as well as future applications of the FN index for pavement design and analysis.
Overall, this study showed the necessity of caution when selecting HMA rutting tests; depending on the specific needs, each test method has its own merits and demerits. In general, the following are some of the key challenges associated with selecting the appropriate laboratory rutting test: sample fabrication, simplicity and practicality of the test, cost-effectiveness, reasonable test time, applicability for routine HMA mix-design and screening, ability to generate multiple data, and correlation with field performance.
Specifically for the FN test, some of the primary challenges to be addressed in future research studies include the following:
■ HMA mix sample configuration and preparation
■ HMA mix sample confinement for further comparisons with the HWTT
■ Exploring multiple test temperatures
■ Addressing and minimising variability in the FN index computations
■ Exploring the computation of the FN cycles to a predefined plastic strain limit through modification of regression constants in the strain-cycle model (Equation 1).
■ Evaluating and testing more HMA mixes
■ Validation with field performance data.
ACKNOWLEDGEMENTS
The authors thank TxDOT and the Federal Highway Administration (FHWA) for their financial support and all those who helped during the course of this research work. In particular, a special word of thanks goes to the following individuals: Jacob Hoeffner (TTI), Jason Huddleston (TTI), Abu N M Faruk (TTI), Dr Geoffrey S Simate (University of the Witwatersrand) and Charles Mushota (RDA).
DISCLAIMER
This paper reflects the views of the authors who are responsible for the facts and accuracy of the data presented herein, and does not necessarily reflect the official views or policies of any agency or institute. This paper does not constitute a standard, specification, nor is it intended for design, construction, bidding, contracting, tendering or permit purposes. Trade names were used solely for information purposes and not for product endorsement.
REFERENCES
Abdallah, I & Nazarial, S 2011. Strategies to improve and preserve flexible pavement at intersections. CTIS, University of Texas at El Paso, Texas, US, Research Report No. FHWA/TX 10.0-5566-1. [ Links ]
Archilla, A R, Diaz, L G & Carpenter, S H 2007. Proposed method to determine the flow number in bituminous mixtures from repeated axial load tests. Journal of Transportation Engineering - ASCE, 133(11): 610-617. [ Links ]
AASHTO (American Association of State Highway and Transportation Officials) 2001. Standard Specifications for Transportation Materials and Methods of Sampling and Testing. Standard TP 62-03: Standard Method of Test for Determining Dynamic Modulus of Hot Mix Asphalt Concrete Mixtures. Washington DC: AASHTO. [ Links ]
AASHTO (American Association of State Highway and Transportation Officials) 2012. Standard TP 79-12: Standard Method of Testing for Determining the Dynamic Modulus and Flow Number for Hot Mix Asphalt (HMA) using the Asphalt Micture Performance Tester (AMPT). Washington DC: AASHTO. [ Links ]
Goh, S W, You, Z, Williams, R C & Li, X 2011. Preliminary dynamic modulus criteria of HMA for field rutting of asphalt pavements: Michigan's experience. Journal of Transportation Engineering - ASCE, 137(1): 37-45. [ Links ]
McDaniel, R S, Kowalski, K J, Shah, A, Olek, J & Bernhard, R J 2010. Long-term performance of a porous friction course. Joint Transportation Research Program, Indiana Department of Transportation and Purdue University, Report FHWA/IN/JTRP-2009/22. [ Links ]
Mohammad, L N, Wu, Z, Obulareddy, Cooper, S & Abadie, C D 2006. Permanent deformation analysis of hot-mix asphalt mixtures using simple performance tests and 2002 mechanistic-empirical pavement design software. Transportation Research Record, 1970: 133-142. [ Links ]
Tukey, J W 1953. The problem of multiple comparisons. Princeton, NJ: Princeton University, Unpublished manuscript. [ Links ]
TxDOT (Texas Department of Transport) 2004. Standard Specifications for Construction and Maintenance of Highways, Streets, and Bridges. Austin, Texas: TxDOT. [ Links ]
TxDOT (Texas Department of Transport) 2012. 200-F: Bituminous Test Procedures Manual. 2011. Available at: http://www.txdot.gov/business/con-tractors_consultants/test_procedures/tms_series.htm?series=200-F (accessed in October 2012). [ Links ]
Walubita, L F, Zhang, J, Das, G, Hu, X, Mushota, C, Alvarez, A E & Scullion, T 2012. Comparison of the Hamburg, dynamic modulus, and repeated load tests for evaluation of HMA permanent deformation. Paper presented at the 91st Transportation Research Board Annual Meeting, Washington DC. [ Links ]
Witczak, M W, Kaloush, K, Pellinen, T, El-Basyouny, M & Quintus, H V 2002. Simple performance test for superpave mix design. National Cooperative Highway Research Program, NCHRP Report 465. [ Links ]
Witczak, M W 2007. Specification criteria for simple performance tests for rutting 2007. National Cooperative Highway Research Program, NCHRP Report 580. [ Links ]
WsDOT (Washington State Department of Transportation) 2011. WsDOT online manuals 2011. Available at: http://training.ce.washington.edu/wsdot/modules/09_pavement_evaluation/09-7_body.htm#rutting (accessed 1 June 2011). [ Links ]
Zhou, F & Scullion, T 2001. Laboratory results from heavy duty asphalt mixes. Texas Department of Transport, Technical Memorandum to TxDOT. [ Links ]
Zhou, F & Scullion, T 2002. Three stages of permanent deformation curve and rutting model. International Journal of Pavement Engineering, 3(4): 251-260. [ Links ]
Zhou, F & Scullion, T 2003. Preliminary field validation of simple performance tests for permanent deformation. Transportation Research Record, 1832: 209-216. [ Links ]
Zhou, F, Scullion, T & Sun, L 2004. Verification and modeling of three-stage permanent deformation behavior of asphalt mixes. Journal of Transportation Engineering - ASCE, 130 (4): 486-494. [ Links ]
 Contact details:
TTI - The Texas A&M University System
CE-TTI Bldg, Room 303C, 3135 TAMU
College Station, TX 77843, United States of America
T: +1 979 862 3356
F: +1 979 845 1710
E: lfwalubita@hotmail.com
Contact details:
TTI - The Texas A&M University System
CE-TTI Bldg, Room 303E, 3135 TAMU
College Station, TX 77843, United States of America
T: +1 979 458 5729
E: jznj126@gmail.com
Contact details:
University of Magdalena
Carrera 32 No 22-08, Santa Marta, Colombia
T: +57 5 430 1292
F: +57 5 430 1292
E: allexalvarez@yahoo.com
Contact details:
Transportation Research Centre
Wuhan Institute of Technology, 693 Xiongchu Avenue
Wuhan, Hubei Provience 430073, China
T: +86 1 582 719 9471
E: huxiaodi625@hotmail.com

DR LUBINDA F WALUBITA holds a PhD, an MSc (Eng), and a BEng degree in Civil Engineering from the Texas A&M University, the University of Stellenbosch, and the University of Zambia, respectively. He currently works as a Research Scientist for the Texas Transportation Institute (TTI) of The Texas A&M University System, USA. His area of specialisation is roads, materials, and pavement engineering. His other research interests include nanotechnology, where he currently serves as the Vice-President for the Global Network of NanoTechnology and its Applications to Road Materials and Pavements (GNN-RMP). He is an author of over 100 publications ncluding editing an ASCE-GSP book. Dr Walubita also has substantia ndustrial experience as a roads engineer in South Africa and Zambia.

JUN ZHANG graduated from the University of Nebraska-Lincoln with a Masters degree in Civil Engineering in 2010. He has been working as a Research Associate for the Texas Transportation Institute (TTI) of the Texas A&M University System since 2011. His area of specialisation is pavement engineering and pavement materials.

PROF ALLEX E ALVAREZ holds a PhD, an MSc (Eng), and a BEng degree in Civil Engineering from the Texas A&M University, the University of Los Andes, and the National University of Colombia respectively. He currently works as Associate Professor for the University of Magdalena in Santa Marta, Colombia, where he leads the GIIC research group. His area of specialisation is pavement engineering, paving materials, and roads.

PROF XIAODIHU holds a PhD and an MSc (Eng) and a BEng degree in Civil Engineering from the Tongji University, and the Huazhong University of Science and Technology. He worked for almost five years as a Research Associate for the Texas Transportation Institute (TTI) oftheTexas A&M University System, USA; and now he works as an Associate Professor for the Transportation Research Center of the Wuhan Institute of Technology, China. His area of specialisation is roads, materials and pavement engineering. His research work is internationally acknowledged and he has authored over 30 publications. Xiaodi also has substantial industrial experience as a roads engineer in China.

