


Services on Demand
Article
 English (pdf)
 Article in xml format
 Article references
Indicators

Related links
-
 Cited by Google
 -
 Similars in Google
Share

 Permalink
Journal of the South African Institution of Civil Engineering
On-line version ISSN 2309-8775
Print version ISSN 1021-2019
J. S. Afr. Inst. Civ. Eng. vol.55 n.3 Midrand Jan. 2013
TECHNICAL PAPER
The use of ground-penetrating radar to develop a track substructure characterisation model
D J Vorster; P J Gräbe
ABSTRACT
The characterisation of track substructure is an integral component of track maintenance and rehabilitation. Traditionally this is done by determining the geotechnical properties of the discrete track formation layers by excavating test pits and sampling the substructure layers. The development of geophysical investigation techniques such as ground-penetrating radar (GPR) allows continuous assessment of the condition of the track substructure. The research described in this paper uses GPR to develop a track substructure characterisation model and provides classifications for both the ballast and formation layers. The ballast and formation were classified into four classes, namely very good, good, moderate and poor. When applying the model to two sections of track (with generally good and poor quality) 82% and 100% of classes had only one class difference compared to the traditional characterisation tests for the formation and ballast layers respectively. The GPR track substructure characterisation model that was developed therefore compares well with traditional characterisation techniques and will result in significant cost and time reduction. The characterisation of the track using GPR provides a continuous classification and enhances the accuracy of the data on which a maintenance engineer can base decisions.
Keywords: track substructure, characterisation, ground-penetrating radar, ballast fouling, earthworks
INTRODUCTION
The aim of a railway substructure investigation is to characterise the track substructure based on its geotechnical properties. Care should be taken when conducting a substructure investigation to establish the correct remedial action (Brough et al 2003). Traditionally, for a typical rail line investigation, a linear investigation is conducted with in situ testing at 200 m intervals (SAICE 2010). To classify the soil and ballast, test pits are excavated for profiling and sampling. Dynamic cone penetrometer (DCP) tests are also conducted to further classify the soil and the layer depths (Clayton et al 1995).
However, with the development of geophysical techniques during the last two decades, methods such as ground-penetrating radar (GPR) have increasingly been used for track substructure investigations (Saarenketo 2006). These techniques have several benefits. Firstly, GPR is a non-destructive geophysical technique that uses electromagnetic waves to investigate nonconductive materials (Daniels 1996). It is used in road, railway and geotechnical environments to detect concealed objects or to determine the internal structure of materials (Saarenketo 2006).
Secondly, the use of GPR to develop a track substructure characterisation model would allow a fast and cost-effective way to classify the track substructure. The capabilities of GPR allow the classification of the ballast and the formation conditions separately. This study uses typical GPR deliverables to develop a GPR track substructure characterisation model and to verify the model with traditional track investigation techniques. The GPR deliverables include the subballast and subgrade layer profiles, the GPR ballast fouling index and the GPR moisture condition of the track. The traditional testing techniques used for the verification of the model are in situ ballast and soil sampling and profiling.
The GPR survey data and characterisation was further compared with the results of specialist geotechnical techniques. These tests included the light-weight deflectometer (LWD), remote video monitoring (RVM) and multi-depth deflectometers (MDD). These tests are not part of the scope of the development of the GPR substructure characterisation model and will be discussed in a future publication.
GROUND-PENETRATING RADAR
Over the years, the uses of GPR have been explored in various ways. The first developments in GPR railway classification were the determination of ballast layer thickness and locating mud holes and ballast pockets
(Göbel et al 1994). Further developments allowed ballast fouling determination (Silvast et al 2010; Al-Qadi et al 2008; Leng & Al-Qadi 2010). Sussman et al (2002) developed material properties for railway track materials based on GPR and reported on railway track condition indicators using GPR (Sussman et al 2003). Smekal et al (2003) used GPR and a track loading vehicle for track substructure investigations, and Berggren et al (2006) used GPR for substructure condition assessment. Olhoeft and Selig (2002) used GPR to evaluate railway track substructure conditions.
Principles
The basic principles of and factors influencing the functioning of GPR are discussed in this section. GPR originated from electromagnetic (EM) theory and uses the transmission and reflection of EM pulses into different mediums, as shown in Figure 1 (Daniels 1996). The reflected energy is displayed in waveform where the difference in amplitude shows the interfaces between wave pulses (Daniels 1996; Saarenketo 2006). A ground profile can be generated by repeating the measurements while moving the antenna across a target area with a continuous series of radar pulses (Saarenketo 2006; Sussman et al 2003; Hyslip et al 2003).
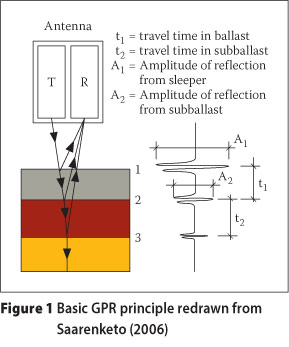
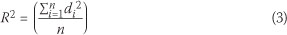
The material properties that influence the propagation and reflection of the radar pulses are the dielectric permittivity, the electrical conductivity and the magnetic permeability, as described by constitutive relationships (Daniels 2004; Jol 2009). Dielectric permittivity and its effect on GPR signal velocity in materials is the most important property that affects GPR survey results. It is important to know how this value relates to the medium being tested in order to calculate the depth of the target. The pulse travels slower through material with a high dielectric permittivity and faster through material with a low dielectric permittivity (Saarenketo 2006). The formulae used to calculate the dielectric permittivity are shown in Equation 1 and Equation 2.
where:
v = wave propagation speed (m/ns)
c = speed of light in a vacuum (0.3 m/ns)
s = interface depth (m) from the surface of the medium
t = two-way travel time from the soil surface to the interface depth (ns =10-9)
Er = relative dielectric permittivity of the soil
The dielectric permittivity used in GPR surveys ranges from 1 for air to 81 for free polar water (Saarenketo 2006). The dielectric permittivity of ballast and subgrade material varies between 3.0 and 38.5 for clean dry ballast and saturated fouled ballast respectively (Clark et al 2001). However, the effect of moisture on dielectric permittivity is greater than that of the material type itself (Clark et al 2001; Leng & Al-Qadi 2010). Information on the material quality can be determined by using the time domain GPR data and converting it to the frequency domain with the use a Fourier transform (Silvast et al 2006). This is used to determine the ballast fouling and the moisture condition and is calibrated with field measurements (Silvast et al 2010).
Equipment and data processing
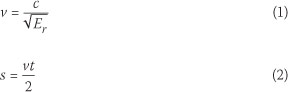
The above process requires specific equipment and tools. A typical railway track GPR survey is carried out with a 400 MHz aircoupled antennae system that can penetrate up to 1 m and can be performed at rail operating speeds. With the suspension of the antennae 300 mm above the surface of the ballast, repeatable results can be obtained regardless of the changes in surface height (Saarenketo 2006). By using a multiple antennae configuration, a cross-section of track can be obtained (Morey 1998; Clark et al 2001). A typical sampling density (10 scans/m) is used for railways (Saarenketo 2006). Figure 2 shows a typical layout of this type of instrumentation.
A range of accessories can be used in conjunction with GPR systems. However, digital video and global positioning systems (GPS) are most commonly used. A sample drilling rig (Saarenketo 2006), as well as infrared thermography (Clark et al 2003, 2004), can also be integrated with GPR data. Smekal et al (2003) used a track loading vehicle in conjunction with GPR results. Digital video recordings allow the interpreter to evaluate the surroundings of the GPR survey after the initial survey (Clark et al 2004). By using these accessories together with the GPR survey data, a comprehensive understanding of the site can be achieved (Saarenketo 2006).
GPR processing software is used to detect layer interfaces and individual objects within the ground from GPR data and to transform the data from the time domain into depth scale (Saarenketo 2006). Accurate estimates of layer dielectric values are important for GPR data processing. Traditionally, dielectric values are back-calculated from reference sampling. Another method in use is the surface reflection method (Maser & Scullion 1991). If the dielectric values are not available for a GPR survey, general dielectric values can be used or calculated from laboratory tests. These values are required for the successful interpretation of the railway structure, defining the substructure layers, ballast fouling and determining the moisture content.
GPR survey data contain reflections from various components within the entire surveyed structure. Therefore, to interpret GPR survey data, a thorough understanding of the surveyed structure is needed. In some cases reflection from components next to the track may influence the data. The interpreter should therefore interpret the main components first. It should also be noted that GPR survey data could be linked to other survey methods in order to get a better understanding of the GPR data itself (Clark et al 2003,
2004; Saarenketo 2006).
Results
The use of GPR for railway track investigations has advanced over the years to deliver the following results:
■ Substructure layer thicknesses up to 1.5 m deep
■ A ballast fouling index
■ The relative moisture condition of the substructure.
Typical results from a GPR survey are shown in Figure 3. Video, GPS and other interpretation results can also be added and used for post-processing and validation of the GPR results.
GPR RAILWAY LINE SURVEY
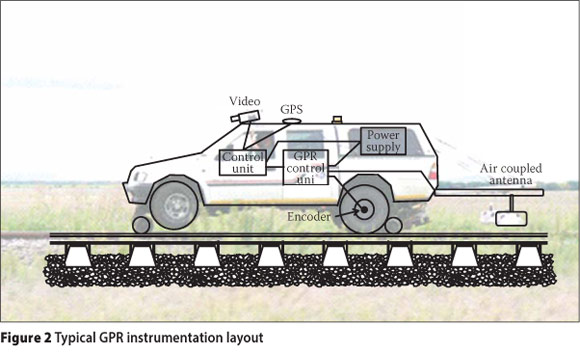
To develop a track substructure investigation tool or model from GPR data, a comparative study was conducted between GPR and other railway track substructure investigation tools. Laboratory tests as well as a field survey were conducted in the present study. Two test sections with different foundation properties were selected for the study. A flow diagram of the processes followed to characterise the track substructure using GPR is shown in Figure 4. The tasks involved in each step of the survey and characterisation process are detailed below.
In situ test selection
Standard geotechnical field test results were compared to the GPR survey results to complete the comparative study. The tests were done on both test sections of track at the sites that were identified from the GPR results. Six test sites were investigated at each of the two test sections. The sampling and profiling of the layerworks provided the following deliverables:
■ Ballast fouling index
■ California Bearing Ratio (CBR)
■ Foundation indicators (FI)
■ In situ moisture content.
Site selection
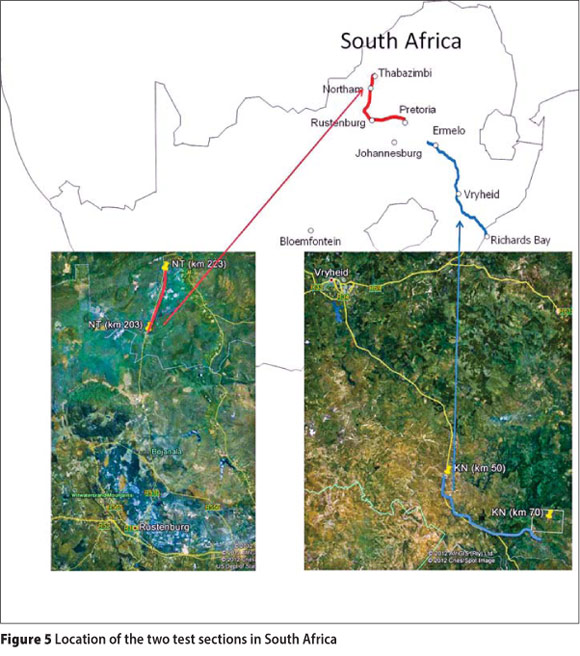
The two test sections for this study, each with unique substructure properties, were selected from the South African rail network. This included a section on the heavy-haul coal export line near Vryheid between Komvoorhoogte and Nhlazatshe (km 50 to km 70). This was considered as a good section of track because the substructure was reconstructed in 2005 according to Transnet's S410 earthworks specification. A second site was selected on the railway line near Rustenburg between Northam and Thabazimbi (km 203 to km 223). This was considered as a track with a poor foundation since the formation consisted predominantly of clay and was constructed in 1934. The test sections are shown in Figure 5. The abbreviations KN (Komvoorhoogte-Nhlazatshe) and NT (Northam-Thabazimbe) will be used in the remainder of this report. Having two sections with different quality track allowed a range of track substructure conditions to be identified for the characterisation model.
Laboratory testing
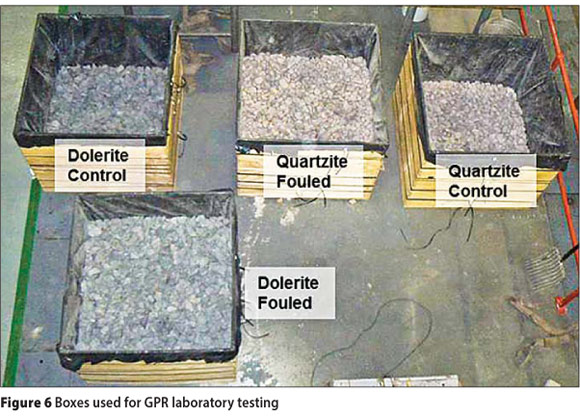
Laboratory tests at the Civil Engineering Laboratory, University of Pretoria, using GPR equipment were conducted on ballast materials typical of those found in the two test sections. The materials used were quartzite obtained from a quarry near Pretoria and dolerite obtained from a quarry near Vryheid. The ballast material was fouled using clay from the Bushveld Igneous Complex near Thabazimbi. A laboratory testing method similar to that of Leng and Al-Qadi (2010) was followed. This required the construction of wooden boxes joined together without metal nails as this would have influenced the GPR signal. Four boxes were constructed, two for each type of material but with different ballast thicknesses.
The ballast boxes used for the GPR laboratory tests are shown in Figure 6.
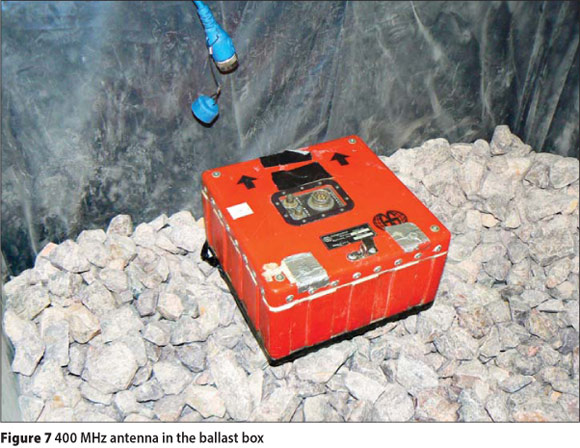
Three tests were conducted on each box with a 400 MHz antenna (Figure 7): a static test 300 mm above the surface of the material, a lifting test from 300 mm and a moving test across the width of the box. The first two tests were conducted to remove background noise. The third was used to determine the dielectric permittivity of the ballast material with the addition of moisture (water) to the boxes. The moisture content of the ballast in the boxes with no fouling material could only be increased to 10% due to drainage of the boxes. The moisture content in the boxes with fouled material was increased to 27.0% and 33.5% for the quartz-ite and dolerite respectively due to moisture retention by the clayey material. The moisture levels were verified by piezometers.
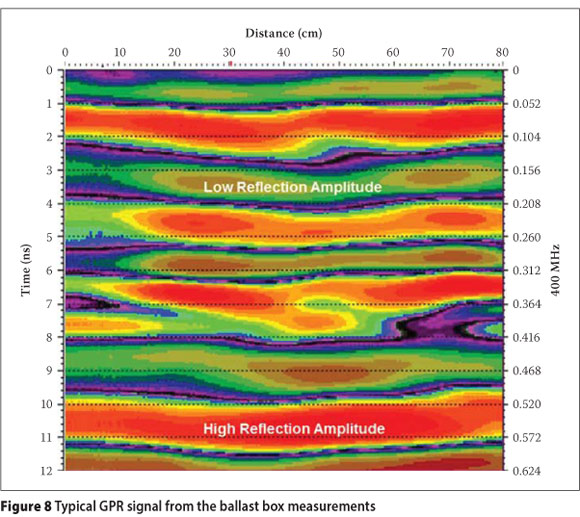
The main deliverable from the laboratory study was the dielectric permittivity of the ballast materials. This was done by analysis of the GPR signal obtained with the moving test. A typical cross-section of a test is shown in Figure 8. The colour scheme used for the interpretation shows the largest reflections in red or white and the smallest reflections in purple. The green lines are areas between large and small reflections. The processed data from each of the boxes was visually inspected to determine the travel time of the signal between the antenna and the layer interfaces. This process was repeated three times to obtain an average. A clear distinction was observed between the ballast rock and the concrete floor on which the ballast boxes were placed.
From the ballast GPR laboratory test results, it was found that the dielectric permittivity of the dolerite was higher than that of the quartzite. It was also determined that once the ballast material was moist, the dielectric permittivity would increase by about 0.8 to 2.2. Furthermore, the dielectric permittivity of the quartzite ballast was influenced more significantly by the fouling than the influence of the fouling on the dielectric permittivity of the dolerite.
Field testing
A full GPR line survey was conducted on both test sections in South Africa. The tests were conducted using a road-rail vehicle as shown in Figure 2. The GPR equipment was attached to the vehicle before testing. The equipment used for the GPR survey consisted of the following:
■ GSSI SIR-20 amplifier
■ Two GSSI 400 MHz antennae (model 5103A)
■ Three industrial cameras (Firewire camera, resolution 1 024 x 768)
■ Railway Doctor (RD) Camlink software
■ GPS system (used with RD Camlink)
■ Distance measurement device.
The GPR antennae were attached 1 m behind the vehicle with one antenna 300 mm above the edge of the sleeper and the other 300 mm above the centre of the sleeper. The three video cameras and the GPS antenna were placed on the roof of the vehicle. One camera faced directly in front of the vehicle and the other two covered the two adjacent sides inclined to the front. The placement of the cameras therefore created a panoramic view of the track and its surroundings. In addition, the distance measurement device was attached to one of the rear wheels and was calibrated according to a known distance.
The GPR survey was carried out at a speed of 40 km/h. While the vehicle was travelling, datum points were taken at each kilometre interval. This was done to establish the corrections required for long and short chainages (i.e. marked kilometre posts covering distances of not exactly 1 000 m). At the end of the section, if possible, the vehicle was turned around facing the opposite direction. If this was not possible, the antenna on the left-hand side was moved to the right-hand side, 300 mm above the edge of the sleeper. The position of the antennae is shown in Figure 2. The vehicle then travelled back to the starting location at 40 km/h. After completion, the equipment was removed from the road-rail vehicle, packed away and the vehicle was manoeuvred off the tracks.
The GPR data, GPS data, the video of the track, as well as the distance measurements, were then processed by the GPR contractor. The processed data included the following:
■ GPR data interpretation
■ GPR layer thickness interpretation
■ GPR ballast fouling index
■ Relative moisture condition with depth
■ Survey inventory
■ Video feed
■ GPS placement.
Ballast fouling and soil classification
Ballast fouling is determined by the amount of fouling material and is usually expressed as the percentage fines contained in the ballast (Selig & Waters 1994). The ballast fouling index can be determined by doing a grading analysis or by using specific methods recommended by the various railroads in the world (Arangie 1997). South Africa uses a method proposed by Pretorius (1993), based on the percentage material passing the 19.0 mm, 6.7 mm, 1.18 mm and 0.15 mm sieves.
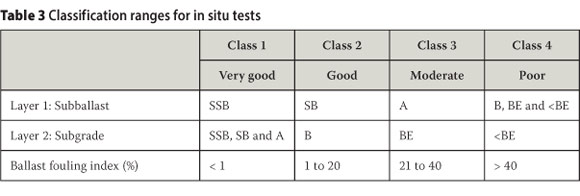
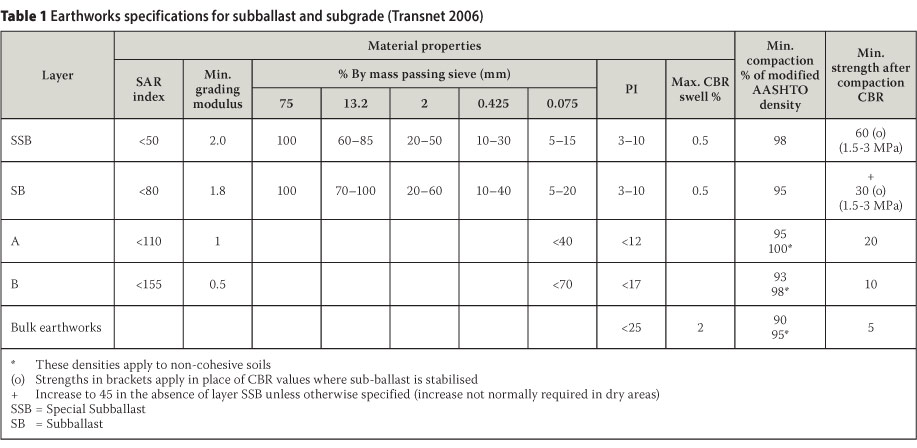
The substructure layerworks is classified by excavating a test pit where samples are taken from each discernable layer that was profiled. The profiling is done according to the method proposed by Jennings et al (1973), where the layers are described in terms of moisture condition, colour, consistency, structure, soil type and origin. The gradation, soil type, California Bearing Ratio (CBR) and foundation indicators (FI) are obtained from laboratory tests on disturbed samples (Clayton et al 1995). The gradation and other deliverables can then be used to classify the track subballast and subgrade layers according to an earthworks specification. The specification proposed by Transnet (2006) is shown in Table 1.
GPR SUBSTRUCTURE CHARACTERISATION MODEL
The standard results from the GPR line survey were used to develop a GPR substructure characterisation model. These included the subballast and subgrade layer profiles, the
GPR ballast fouling (GBF) index and the GPR moisture condition. The results were first analysed and interpreted to determine the potential of each deliverable to be used as a characterisation parameter. The data were then divided into ranges that best suited the conditions of the two test sections. The exact classification ranges were then obtained from these ranges. The individual steps followed through each of these procedures are discussed in this section.
GPR data interpretation
Firstly, the interpretation of the GPR signal from the field survey, as shown in Figure 3, was exported for further analysis. This process was repeated for the subballast profile, subgrade profile, GBF index and GPR moisture condition. The reason for this is that the GPR software only allows basic GPR signal interpretation, such as depth determination, from the dielectric permittivity of the material. The GBF index and the GPR moisture condition are determined by FFT algorithms applied by the GPR survey contractor.
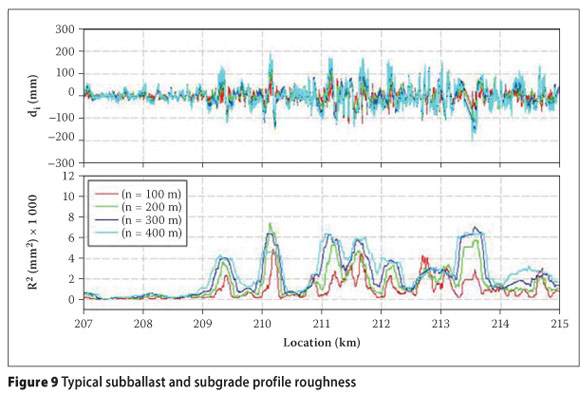
Next, the subballast and subgrade profile roughness values were determined using the root mean square method (RMS) as described by Equation 3. The roughness of the track will allow classification of the subballast and subgrade due to differential settlement of the track.
where:
R2 = roughness, route mean square calculation or variance
n = number of measurements in the length of track under consideration
di = difference between the elevation of the point being measured and mean filtered elevation
The roughness calculation exponentially increases or decreases the magnitude of the results, and the difference between small and larger values then becomes more pronounced. Different lengths for the determination of the profile roughness were considered (100 m,
200 m, 300 m and 400 m), and it was found that the 200 m length provided acceptable results for the classification as shown in Figure 9. The roughness values had magnitudes of thousands and were therefore divided by a factor of a thousand for the classification.
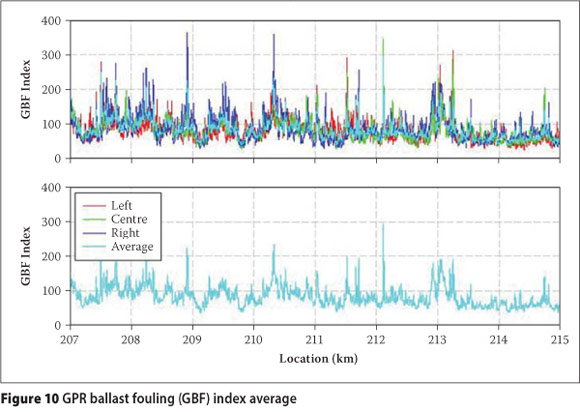
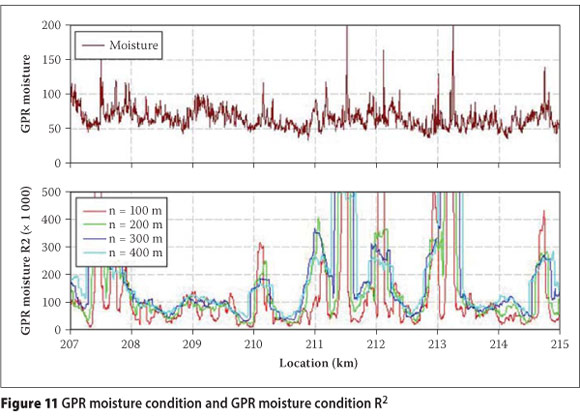
The average of the GBF index results of the GPR survey across the width of the track was calculated, allowing easier interpretation, as shown in Figure 10. The GPR moisture condition was determined by first averaging moisture condition with depth, as the total moisture condition of the track influences the GPR signal. Thereafter, the RMS method was used over a 200 m length to calculate the GPR moisture index. This was done to create more discernable values for the substructure classification. These values were also factored by a thousand as shown in Figure 11.
Characterisation model
To develop the characterisation model, the results from the GPR field survey were analysed and grouped into four classes. The classes were, from 1 to 4, very good, good, moderate and poor. The different GPR deliverables were each classified separately and then combined in the characterisation model.
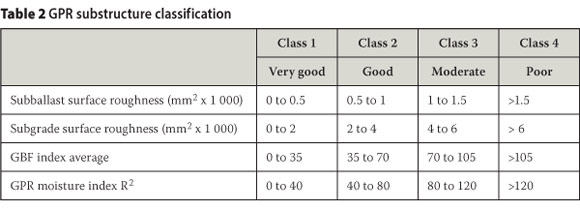
The same process was followed for the determination of the classification ranges of the GPR deliverables. The process required the average value of each section to be determined, assuming that the KN test section was good and the NT section was poor. The average of the total data set was then determined, which provided an indication of the magnitude of the moderate value. These three values were then adjusted to obtain clear ranges for the four classes. The classification ranges for the subballast surface roughness, subgrade surface roughness, GBF index average and GPR moisture index are given in Table 2.
The subballast and subgrade roughness values were further combined to give one classification for the track formation. The GBF index and the GPR moisture index were also combined for the classification of the ballast condition, as the GPR moisture readings were influenced mostly by the ballast layer. When combining two classifications, the most critical class was used for the final classification. Combining the classifications then provided two main classification criteria, one for the classification of the ballast material and the other for the classification of the track foundation. In doing so, rehabilitation or maintenance of the different components can be planned separately.
It is realised that the characterisation model incorporates a significant amount of averaging to arrive at the final classifications. This is required for a broad and practical classification. However, the un-averaged data plots are ideal for identifying critical and problem areas for future or more detailed investigations.
APPLICATION OF GPR CHARACTERISATION MODEL
The classification of the two test sections was done in accordance with the GPR characterisation model. The classification results were further simplified for future maintenance planning. This was done by limiting the classified section length to 2 km unless there was a bridge, tunnel or any other discernable structure that would influence the GPR signal. The classifications of the KN test section and the NT test section are shown in Figure 12 and Figure 13 respectively.
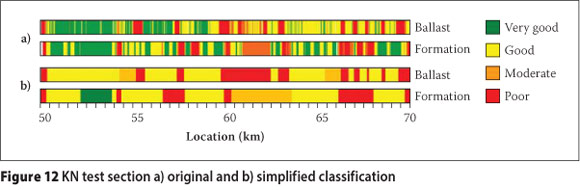
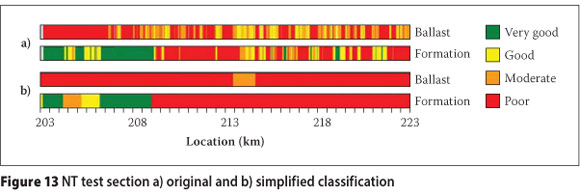
By applying the simplified classification, which takes the length of the classified sections into account, the final classification percentages of the two test sections were determined and are shown in Figure 14.
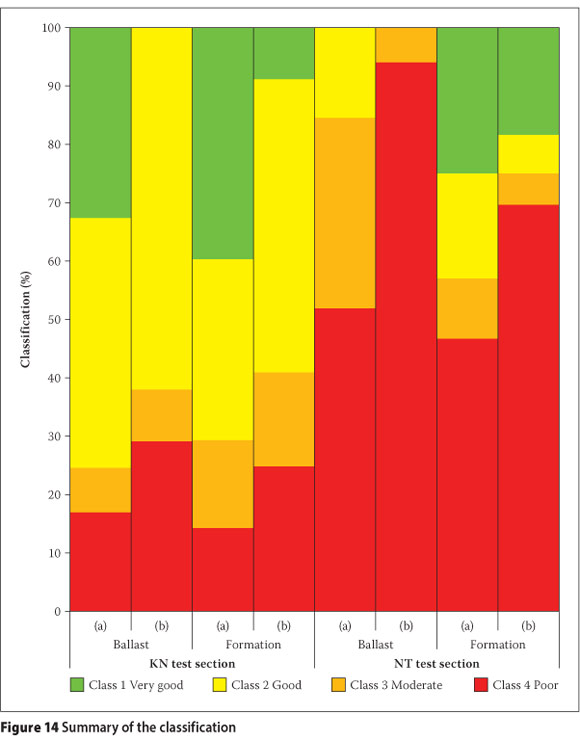
The percentages of the different classes for the two test sections highlight the difference in quality between them. Before the simplification of the classification, the KN test section had 75.4% of the ballast and 70.8% of the track formation in the good and very good classification ranges. On the NT test section, 15.6% of the ballast and 43.0% of the track formation was good to very good. The change in classification percentages after the simplification showed a decrease in good to very good sections of the track. For the KN test section it decreased to 62.0% for the ballast classification and 59.2% for the formation classification. For the NT test section the good to very good track sections decreased to 0% and 25.0% for the ballast and formation respectively.
VERIFICATION OF THE MODEL
The classification of the track with the GPR substructure characterisation model and the results of the traditional in situ testing were compared for verification of the model. The in situ soil tests were classified in accordance with the Transnet (2006) S410 earthworks specification and the ballast fouling index according to the method proposed by Arangie (1997). The classification is shown in Table 3.
The traditional earthworks classification could only be used at the 10 test sites where sampling and in situ testing were done. The comparison of the earthworks classification and the ballast fouling index is shown in Table 4.
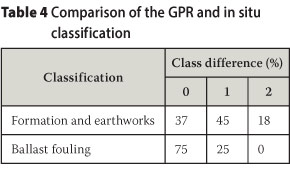
Comparing the railway earthworks classification with the GPR formation classification, it was found that 37% of the classifications matched exactly, 45% differed with one class and only 18% differed with two classes. The ballast fouling classification showed that 75% of the classifications matched exactly while 25% differed with one class only. The comparison of the classification classes shows the accuracy of the GPR substructure characterisation model. Use of the model will therefore provide a clear classification with respect to traditional classification and will also provide an even better understanding of the track condition when compared over time.
EVALUATION OF THE MODEL
To fully investigate the track substructure condition for broad classification purposes by using in situ tests, a test pit has to be excavated at least every 200 m. The two test sections comprised a total of 40 km and therefore 200 test pits would have to be excavated. The tests carried out at each test pit would be as follows:
■ Profiling of the test pit
■ Two foundation indicator samples
■ Two CBR samples that include Mod AASHTO testing
■ Ballast fouling sample.
In situ tests would also be required for the GPR substructure characterisation to calibrate the GPR results. Each classification section would need at least one test pit per section and one every 2 km in the section. From this it was determined that 22 test pits would be required for the GPR survey.
For the most effective substructure characterisation, it is recommended that GPR substructure characterisation be used in conjunction with traditional in situ classification. The aim would then be to obtain a continuous characterisation of the substructure from the GPR characterisation model and a more in-depth classification from the in situ testing at problematic sections. This will provide engineers making decisions on track substructure rehabilitation with a complete and comprehensive overview and understanding of the condition of the track. A complete track condition maintenance plan can be developed by using the substructure characterisation data from GPR results in conjunction with the continuous geometric classification of the track roughness.
CONCLUSION
This study proves that it is possible to develop an effective and accurate GPR substructure characterisation model. This was done by using typical GPR survey deliverables, namely layer thickness, GPR ballast fouling and GPR moisture content. These deliverables were further analysed for ease of classification in the model. The subballast and subgrade profile roughness values were used for foundation classification and the GBF index and the GPR moisture condition index roughness values were used for the ballast classification. The GPR substructure characterisation model was evaluated by comparing its classification with the classification obtained by using in situ investigation techniques.
The comparison of the GPR substructure characterisation model with typical in situ classification techniques showed good correlation. Only 18% of the formation and earthworks classifications differed by a maximum of two classes, while 100% of the ballast classification differed by one class or less.
In conclusion, the use of GPR in a substructure characterisation model is not only possible but also provides a continuous characterisation compared to the fragmented nature of a traditional in situ railway track investigation. The most effective use of the GPR substructure characterisation model is in conjunction with in situ investigation techniques and track surface geometry. The GPR model provides continuous characterisation of the substructure, whereas in situ tests will provide a more in-depth classification at problematic areas. The authors are of the opinion that GPR, in conjunction with other standard in situ and laboratory tests, will in future become the preferred method for substructure investigations, especially of existing railway lines that have to be upgraded for increased tonnages and axle loading.
ACKNOWLEDGEMENTS
The following organisations are gratefully acknowledged for their invaluable contributions to this research:
■ Roadscanners for carrying out the GPR survey and initial data interpretation.
■ Aveng Manufacturing Lennings Rail Services for providing the road-rail vehicle and field testing, and Aurecon assisting with the arrangements.
■ Geostrada for the soil and laboratory testing.
■ Transnet Freight Rail for sponsoring the research carried out by the Chair in Railway Engineering and for allowing access to their network for the field tests.
■ The University of Pretoria laboratory and staff for assistance with laboratory and field testing.
REFERENCES
Al-Qadi, I L, Xie, W & Roberts, R 2008. Scattering analysis of ground penetrating radar data to quantify railroad ballast contamination. NDT & E International, 41: 441-447. [ Links ]
Arangie, P B D 1997. The influence of ballast fouling on resilient behaviour of the ballast pavement layer. Proceedings, 6th International Heavy Haul Conference, Cape Town: IHHA, pp 241-256. [ Links ]
Berggren, E G, Smekal, A & Silvast, M 2006. Monitoring and substructure condition assessment of existing railway lines for upgrading to higher axle loads and speeds. Paper presented at the 7th World Congress on Railway Research, 4-8 June, Montréal, Canada. [ Links ]
Brough, M, Stirling, A, Ghataora, G & Madelin, K 2003. Evaluation of railway trackbed and formation: a case study. NDT & E International, Vol 36 (3): 145-156. [ Links ]
Clark, M R, Gillespie, R, Kemp, T, McCann, D M & Forde, M C 2001. Electromagnetic properties of railway ballast. NDT & E International, 34: 305-311. [ Links ]
Clark, M R, McCann, D M & Forde, M C 2003. GPR as a tool for the characterization of ballast. Paper presented at the 6th International Conference on Railway Engineering, 30 April - 1 May, London. [ Links ]
Clark, M, Gordon, M & Forde, M C 2004. Issues over high-speed non-invasive monitoring of railway trackbed. NDT & E International, 37: 131-139. [ Links ]
Clayton, C R, Matthews, M C & Simons, N E 1995. Site Investigation, 2nd edn Oxford: Blackwell Science. [ Links ]
Daniels, D J 1996. Surface Penetrating Radar. Electronics & Communications Engineering Journal, August: 165-182. [ Links ]
Daniels, D J (Ed) 2004. Ground Penetrating Radar, 2nd edn London: Institution of Electrical Engineers. [ Links ]
Gôbel, C, Hellman, R & Petzold, H 1994. Georadar - Model and in-situ investigations for inspection of railway tracks. Proceedings, 5th International Conference on Ground Penetrating Radar, 12-16 June, Kitchener, Canada, Vol. 3, pp 1101-1106. [ Links ]
Hyslip, J P, Smith, S S, Olhoeft, G R & Selig, E T 2003. Assessment of railway track substructure condition using ground penetrating radar. Paper presented at AREMA (American Railway Engineering and Maintenance-of-Way Association) International Conference, 5-7 October, Chicago. [ Links ]
Jennings, J E, Brink, A B & Williams, A 1973. Revised guide to soil profiling for civil engineering purposes in southern Africa. Die Siviele Ingenieur in Suid-Afrika, 3-12 January. [ Links ]
Jol, H M 2009. Ground Penetrating Radar: Theory and Applications, 1st edn Amsterdam, Netherlands: Elsevier Science. [ Links ]
Leng, Z & Al-Qadi, I L 2010. Railroad ballast evaluation using ground-penetrating radar-laboratory investigation and field validation. Transport Research Record, 2159: 110-116. [ Links ]
Maser, K R & Scullion, T 1991. Automated detection of pavement layer thicknesses and subsurface moisture using Ground Penetrating Radar. Transport Research Board Paper. [ Links ]
Morey, R 1998. Ground Penetrating Radar for Evaluating Subsurfuce Conditions for Transportation Facilities. A Synthesis of Highway Practice. Washington DC: National Academy Press. [ Links ]
Olhoeft, G R & Selig, E T 2002. Ground penetrating radar: Evaluation of railway track substructure conditions. In: Koppenjan, S & Lee, H (Eds), Proceedings, 9th International Conference on Ground Penetrating Radar, 29 April - 2 May, Santa Barbara, California, Vol 4758, pp 48-53. [ Links ]
Pretorius, F J 1993. The state of the art of ballast fouling and screening maintenance system. Johannesburg: Track Testing Centre, Report No 24-864/01/93. [ Links ]
Saarenketo, T 2006. Electrical properties of road materials and subgrade soils and the use of ground penetrating radar in traffic infrastructure surveys. Department of Geosciences, University of Oulu: Oulu University Press. [ Links ]
SAICE 2010. Site Investigation Code of Practice, 1st edn SAICE Geotechnical Division, Midrand. [ Links ]
Selig, E T & Waters, J M 1994. Track Geotechnology and Substructure Management, 1st edn Derby, England: Thomas Telford. [ Links ]
Silvast, M, Levomaki, M, Nurmikolu, A, & Noukka, J 2006. NDT techniques in railway structure analysis. Proceedings, 7th World Congress on Railway Research, 4 - 8 June, Montreal, Canada, p 12. [ Links ]
Silvast, M, Nurmikolu, A, Wiljanen, B & Levomaki, M 2010. An inspection of railway ballast quality using ground penetrating radar in Finland. Proceedings of the Institute of Mechanical Engineers, Part F: Journal of Rail and Rapid Transit, 224: 345-351. [ Links ]
Smekal, A, Berggren, A & Hrubec, K 2003. Track- substructure investigation using ground penetrating radar. Proceedings, 6th International Conference on Railway Engineering, 30 April 30 -1 May, London. [ Links ] Sussman, T R, O'Hara, K R & Selig, E T 2002.
Development of material properties for railway application of ground penetrating radar. In: Koppenjan, S & Lee, H (Eds), Proceedings, 9th International Conference on Ground Penetrating Radar, 29 April - 2 May, Santa Barbara, California, Vol. 4758, pp 42-47.
Sussman, T R, Selig, E T & Hyslip, J P 2003. Railway track condition indicators from ground penetrating radar. NDT & E International, 36(3): 157-167. [ Links ] Transnet. 2006. Specification for Railway Earthworks S410. Johannesburg: Transnet Ltd. [ Links ]
 Contact details:
Department of Civil Engineering
University of Pretoria Lynnwood Road Pretoria
0002
T: +27 12 420 2178
E: jaco.vorster@up.ac.za
Contact details:
Department of Civil Engineering
University of Pretoria
Lynnwood Road
Pretoria
0002
T: +27 12 420 4723
E: hannes.grabe@up.ac.za

JACO VORSTER is a lecturer and researcher at the University of Pretoria's Civil Engineering Department. He completed his MEng degree in Transportation Engineering at the same institution in 2012. He enjoys research into railway engineering and has done research on track geotechnology, railway maintenance Tiethods and instrumentation development through field and laboratory investigations. He also lectures undergraduate and postgraduate courses in civil engineering.

PROF HANNES GRABE, who is a professiona engineer and a Fellow of the South African Institution of Civil Engineering, is passionate about railways, with experience in the fields of track technology, geotechnology, advanced aboratory testing, field investigations, maintenance models and numerical analysis of track structures. He is currently employed by the University of Pretoria as Associate Professor: Transnet Chair in Railway Engineering, where he lectures undergraduate and postgraduate courses in railway engineering. He is also responsible for railway research, as well as continued professional education in the form of short courses presented to industry.

