


Services on Demand
Article
 English (pdf)
 Article in xml format
 Article references
Indicators

Related links
-
 Cited by Google
 -
 Similars in Google
Share

 Permalink
Journal of the South African Institution of Civil Engineering
On-line version ISSN 2309-8775
Print version ISSN 1021-2019
J. S. Afr. Inst. Civ. Eng. vol.55 n.3 Midrand Jan. 2013
TECHNICAL PAPER
A field study of the in situ moisture regime during active hydraulic tailings deposition
C J MacRobert; G E Blight
ABSTRACT
A common method of managing tailings in semi-arid environments is to self-impound the waste as it dries. This paper presents the results of research carried out on the in situ drying behaviour of platinum tailings. Monitoring of gravimetric water contents following deposition and the quantity of water released during sedimentation indicated that a tailings beach acts as a gravitational thickener. After sedimentation, water contents were observed to decrease at a rate correlated with reference evapotranspiration, reaching a steady-state condition. Field capacity values determined from laboratory experimentation and predictive modelling correlated closely with this steady state. Further near-surface moisture reduction is inhibited due to the relative abundance of moisture rising from below to replenish deficits. Liquidity indices demonstrated that, as a result, only the head of the beach dries to a steady-state condition which provides strength to impound the tailings.
Keywords: tailings, reference evapotranspiration, moisture loss, field capacity, strength gain
INTRODUCTION
The world is faced with a growing problem of how to utilise its mineral resources in a sustainable manner. With the depletion of high-grade ore bodies and advances in extractive metallurgy, the volume of tailings requiring storage is ever-increasing. Typically, mill-circuits extract small percentages of the sought mineral from ore via a wet process, resulting in slurried tailings. The need to dispose of the tailings in an environmentally friendly, structurally stable and economically viable manner has resulted in a number of available solutions. Tailings disposal involves both process engineering for the thickening of tailings and geotechnical engineering for the deposition of tailings. Tailings may be thickened1 to a low-density slurry or a paste, or even filtered to a cake, increasing upfront water recovery, albeit at extra cost. Tailings then require impounding or can self-impound if the geotechnical behaviour results in sufficient strength within realistic time-frames. No single solution is universally applicable as each has its merits. This paper builds on research previously presented by the authors (Blight et al 2012) which highlighted the gravitational thickening of low-density slurries during subaerial deposition, and extensively investigates the drying phase leading to strength gain in platinum tailings.
Moisture loss and strength gain
The strength gain of deposited "conventional" slurries is dependent on increasing inter-particle forces during sedimentation, consolidation and, finally, drying. Pane & Schiffman (1985) linked the Kynch (1952) theory of sedimentation and the Gibson et al (1967) theory of non-linear, finite strain consolidation of saturated clays, to model the pelagic (i.e. in the open ocean) sedimentation and simultaneous consolidation of sediments. Although applied to tailings deposition, conditions are often not pelagic, with deposition characterised by unstable, meandering, turbulent rill flow (Blight & Bentel 1983). Wels & Robertson (2003) concluded that only water liberated during initial sedimentation and bleed water during consolidation are available for recovery. Lyell et al (2008) proposed that by reducing the surface area over which low-density slurries are deposited, water recoveries achieved from the dam can be similar to those from paste thickening.
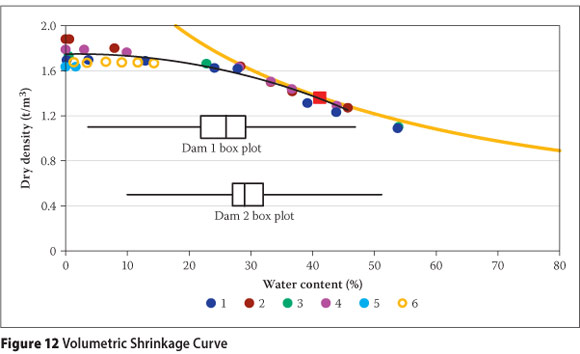
As solids settle out of the slurry a viscous mass results, with the quantity of pore water above the liquid limit, Donaldson (1960) showed that in semi-arid environments evaporative drying results in the tailings losing pore water and gaining strength at a rate faster than can be estimated by the self-weight consolidation theory. The movement of pore water is governed by gravitational forces and suction-induced potentials. The reduction in pore water, quantified by the gravimetric water content, wc, through seepage and evaporation, is proportional to the reduction in volume while the soil skeleton remains saturated. When the solids skeleton reaches a maximum density, air enters the voids and the resulting pore water menisci create an increase in suction. The relationship between volume change and water content or suction at constant (zero) total stress is termed the Volumetric Shrinkage Curve (VSC), while the corresponding relationship between water content and suction is termed the Suction-Water Content Curve (SWCC) (Fredlund & Rahardjo 1993).
As suctions develop, gravitational seepage reduces and eventually water may be drawn up from within the deposit via the suction potentials (i.e. capillary action). When gravitational seepage becomes negligible, the soil has reached its field capacity, with classical soil science defining the corresponding suction to be 33 kPa, although this is often closer to 10 to 20 kPa (Miller & Donahue 1990). Koorevaar et al (1999) suggested that when the water table is at shallow depths, field capacity corresponds to hydrostatic equilibrium. Due to the reduction in permeability as suctions develop, Meyer & Gee (1999) proposed that field capacity occurred when the hydraulic conductivity decreases to between 10-9 and 10-11 m-s-1, depending on soil type and texture. Ratliff et al (1983) investigated 401 soils and found the average standard deviation of laboratory and in situ field capacity values of similarly textured soils to be 3.6% and 4.9% respectively. Depending on the availability of water to replenish deficits, soils can remain at field capacity for considerable periods.
Evaporation from bare soil is often characterised as occurring in two distinct stages: the "energy limited" stage and the "falling rate" or "soil limited" stage. During the energy-limited stage, the rate is defined by the evaporative energy available to vaporise water within the soil. During the soil-limited stage, the hydraulic properties of the soil are unable to supply moisture at the potential evaporation rate. Allen et al (2005) analysed a number of soils and determined that the change from stage one to stage two evaporation occurs at a wc between the field capacity and wilting point. The wilting point is defined as the wc at a suction of 1 500 kPa (Miller & Donahue 1990). Stage two continues until the wc is half the wilting point value, which is presumed to approximate air-dry conditions.
Reference evapotranspiration
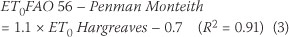
Evapotranspiration is the combined process whereby liquid water contained within soils and plant tissue is vaporised. The rate of evapotranspiration is influenced by macro-climatic conditions, microclimatic conditions and the development and management of plant type. A means to determine a reference évapotranspiration, ET0, to reflect purely macroclimatic conditions, was developed by the Food and Agriculture Organization (FAO) (Allen et al 1998). Two methods are outlined: the FAO Penman-Monteith method, Equation 1, when sufficient climatic data are available, and the Hargreaves method, Equation 2, for limited climatic data. To further improve the performance of the Hargreaves method, linear regression between ET0 values from the two methods is proposed to develop a regional calibration.
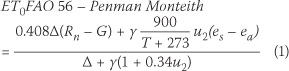
where
ET0 = reference evapotranspiration (mm-day-1)
Rn = net radiation at the crop surface (MJ-m-2-day-1)
G = soil heat flux density (MJ-m-2-day-1)
T = daily mean temperature (°C)
u2 = wind speed at a height of 2 m (m-s-1)
es = saturation vapour pressure (kPa)
ea = actual vapour pressure (kPa)
∆ = slope of the vapour pressure curve (kPa-°C-1)
Y = psychrometric constant (kPa-°C-1)
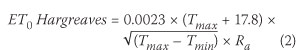
where
ET0 = reference evapotranspiration (mm-day-1)
Tmean = daily mean air temperature (°C)
Tmax = daily maximum air temperature (°C )
Tmin = daily minimum air temperature (°C)
Ra = extraterrestrial radiation (mm-day-1)
A review of the literature and analysis of carefully collected lysimeter data over a three-year period by Benli et al (2010) in arid to semi-arid climates indicated the FAO Penman-Monteith method to be generally superior, with variable results from other methods. Hargreaves and Allen (2003) outlined the historical development of the Hargreaves method and assessed it against 59 000 global sites finding it universally applicable, although it tended to underpre-dict in climates with high wind and overpre-dict in climates with high relative humidity.
AIMS AND OBJECTIVES
As outlined above, it has long been accepted that strength gain in tailings is driven by the drying effect of climate aridity. Although extensive laboratory research has been conducted, field experiments have often been limited. The aim of this study, therefore, was to investigate the in situ moisture regime of platinum tailings over 11 months on two active, back-to-back tailings dams with the objectives of:
1. Determining the quantity of water released by gravitational thickening during deposition.
2. Developing an empirical correlation between and the rate of moisture loss.
3. Demonstrating the steady state that limits the degree of moisture loss during active deposition.
TEST WORK
Test work was carried out at Anglo American Platinum Mogalakwena mine, 30 km north of Mokopane, South Africa (23°59'S, 28°56'E). During testing the mine operated two back-to-back facilities: Dam 1, a conventional upstream spigoted facility (raised at 2.3 m-year-1) and Dam 2, a waste rock impoundment, filled via a series of spigots (raised at 4.6 m-year-1). Two separate processing plants supplied similar tailings: the South Plant to Dam 1 and the North Plant to Dam 2.
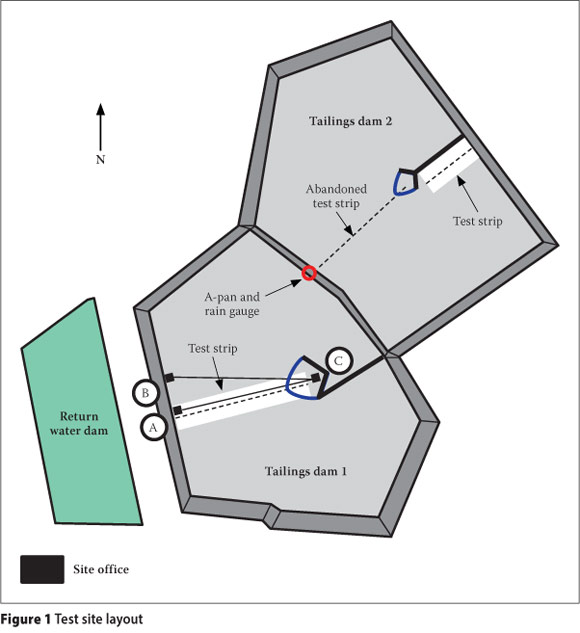
Figure 1 shows the site plan, indicating the test strips, locations of the rain gauge, A-pan and site office which housed a small laboratory for determining gravimetric wc. More detailed testing was conducted at the University of the Witwatersrand. The sampling points for Dam 1 were marked out by poles every 50 m and accessed by a specially constructed catamaran drawn by a steel cable, along AC in Figure 1. Owing to operational constraints, a similar arrangement was abandoned on Dam 2, necessitating a new test strip with sampling points accessed via conveyor belting and scaffold planks from the pool-training wall.
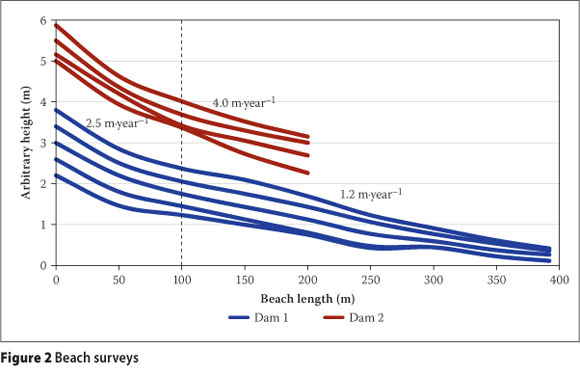
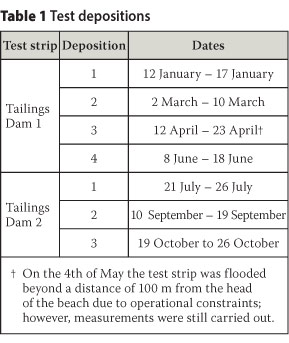
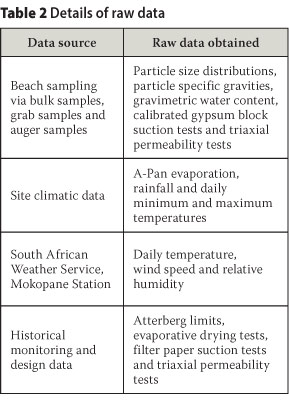
Test depositions were scheduled separately to operational depositions, with the intention of depositing 400 mm of material each time on each test strip. However, the depth of material deposited was not uniform due to the inherent beaching behaviour. The rate of rise along each test strip was determined by survey data, shown in Figure 2, and the time between depositions, given in Table 1. For the outer 100 m of both test strips, the rate of rise was roughly 2.5 m-year-1. On Dam 1 the rate for the remainder of the 400 m beach was roughly 1.2 m-year-1, whereas on Dam 2 the rate for the remainder of the 200 m beach was roughly 4.0 m-year-1. Table 2 details the raw data collected.
ANALYSIS OF RESULTS
Basic geotechnical parameters
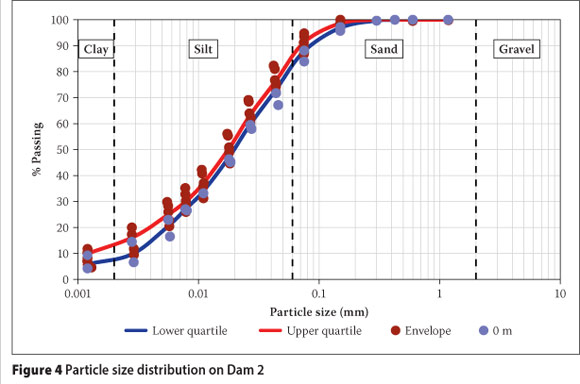
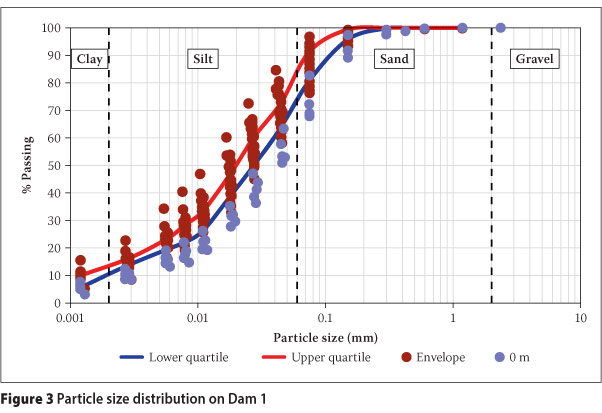
To fully liberate Platinum Group metals, IsaMillTM technology (trademark of Xstrata Technology) was being introduced at the two plants to produce a finer grind of material. During testing the technology had been partially introduced at the South Plant and was fully operational at the North Plant. Consequently, the grading envelope along the Dam 1 beach was wider than that along the Dam 2 beach, as illustrated by Figures 3 and 4. Grading curves at the point of deposition (0 m) contained slightly more coarse material with little segregation along the rest of the beach.
The mean particle specific gravity, Gs, was 3.10, as determined by the vacuum method from 31 samples, with a standard deviation of 0.03. Atterberg limits, determined from five data sets, indicated that the liquid limit, wL, varied between 25% and 20% with a mean of 23%, and that the plastic limit, wP, varied between 21% and 18% with a mean of 19%. Based on the average plasticity index and average clay fraction, the activity (wL-wp/% clay fraction) was 0.3, indicating that the clay fraction contains only a small portion of clay minerals.
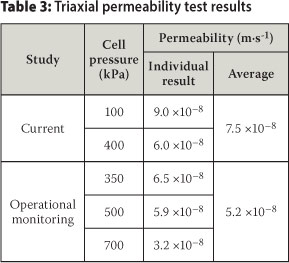
The permeability was determined on two remoulded samples of representative material during the consolidation stages of triaxial testing during the study. Permeabilities were also determined on remoulded samples, during the consolidation stage of triaxial testing, as part of mine operational monitoring. The results from both sets of test work are summarised in Table 3.
Water recovery during gravitational thickening
The water released from the slurry during sedimentation was investigated by taking successive grab samples after cessation of deposition. Relevant average slurry properties during deposition, and the corresponding values after sedimentation, are given in Table 4. These values were calculated from wc, using the mean Gs, due to the small scatter in values and assuming full saturation, as samples were taken from the beach surface soon after deposition. Based on the successive grab samples, sedimentation was observed to be complete within 65 hours (7 hours standard deviation) with the time increasing down the beach towards the pool.
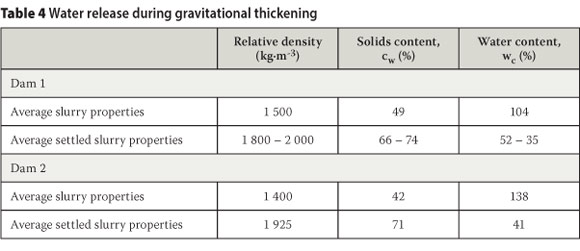
One anomalous result, not included in Table 4, was the average settled conditions following the first deposition on Dam 1. Owing to operational constraints, the test section had remained dormant for six months, resulting in a dry beach, and sampling only took place five days after deposition had ceased. Consequently, a large volume of water was drawn into the underlying dry layers, resulting in average settled wc values along the beach of 20% (cw = 83%).
An investigation by the mine (Vietti et al 2010) with a view to implementing paste technology illustrated that a slurry density of 1 900 kg-m-3 (cw = 70%, wc = 43°%) could be achieved for similar material. The experimental evidence discussed in this paper suggests that, provided deposition is not onto a dry beach, and all decant water is recovered, the beach acts as a gravitational thickener at no additional cost.
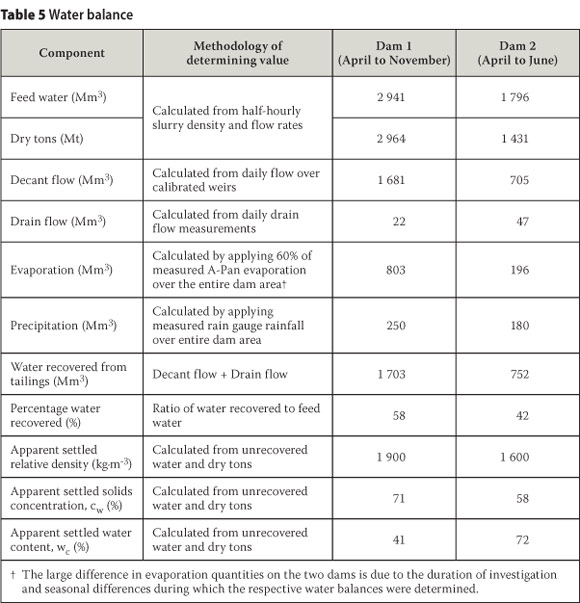
To investigate how much of the supernatant water released during sedimentation is recovered, water balances were determined from April to November on Dam 1 and from April to June on Dam 2. Table 5 shows the water balances components, the quantity of water recovered and the apparent settled conditions determined from the unrecovered water volume and dry tons deposited. On Dam 1 the apparent and measured settled conditions were comparable, confirming that the water released was recovered. On Dam 2 the apparent settled conditions and measured values differed, suggesting that some of the water released during sedimentation was not recovered. A possible reason for this is that 75% of the outer wall on Dam 2 and the pool-training wall were constructed from highly pervious waste rock. During field work, ponded water was observed between the toe of the rock wall and the solution trench, even though it was the dry season. It is plausible to say that the unaccounted water seeped through the rock wall interface.
Correlating reference evaporation and moisture loss
Moisture loss regression model
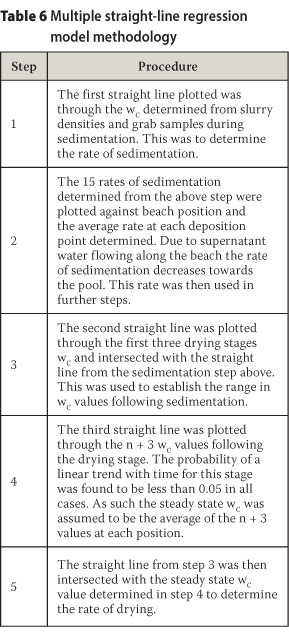
A multiple straight-line regression model was fitted to the observed moisture loss based on gravimetric wc. The initial wc was taken from plant slurry densities. Surface samples were recovered and tested during sedimentation, drying and apparent steady state. On Dam 2 a total of three depositions were sampled at five sampling points 50 m apart, resulting in 15 data sets. An iterative statistical method was used to intersect three separate linear regression curves through the sedimentation stage, drying stage and steady-state condition. The methodology followed is outlined in Table 6.
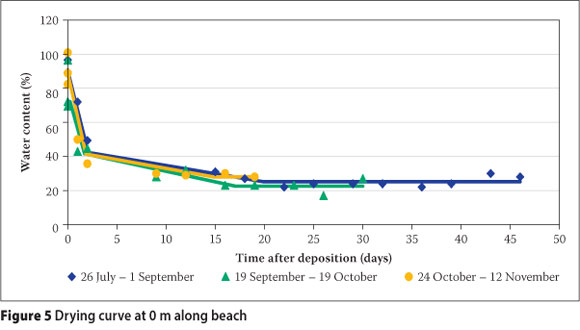
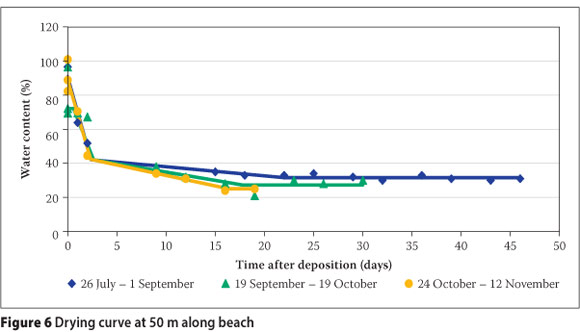
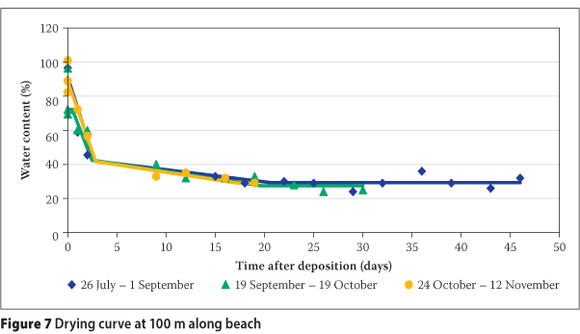
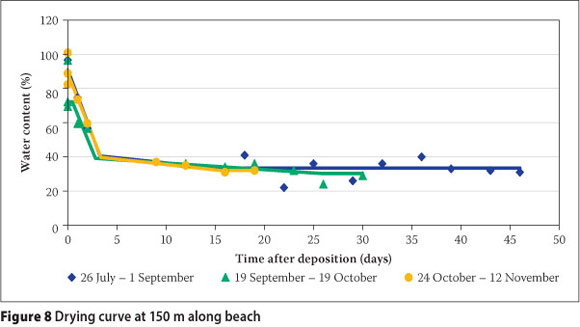
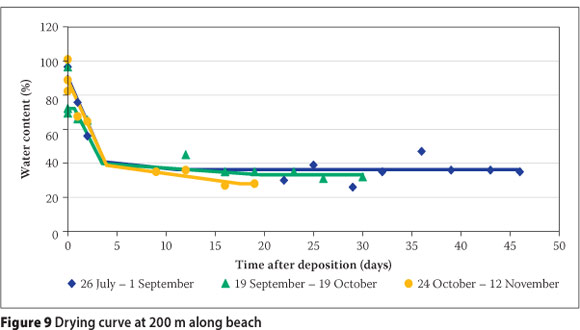
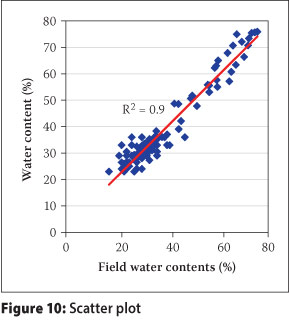
Figures 5 to 9 illustrate the fitted regression models, along with the raw data from the 15 test depositions. The sedimentation behaviour as discussed in the preceding subsection was observed to be complete within three days, with no significant seasonal variation. The drying period varied depending on the season, with the steady-state wc being predominantly a function of beach position. The steady state is discussed at length in the following subsection. The scatter plot in Figure 10 illustrates the performance of all the multiple straight-line regression models against the field data. Individual scatter plots showed that the performance of the model was poorer for the sampling points at 150 m and 200 m along the beach.
Reference evapotranspiration
A regional calibration of the Hargreaves method was developed from climatic data obtained from the South African Weather Bureau station at Mokopane:
ET0 values calculated for the test site were found to compare adequately with historical data from Polokwane and Mokopane. The mean ratio between the A-Pan data and ETo values was 0.65, which is consistent with expected behaviour reported by Allen et al (1998). However, a great deal of scatter was observed. This is considered a consequence of variable microclimatic conditions and operational constraints with the A-Pan.
Empirical correlation
An empirical correlation between the change in wc per day during the drying stage for the outer 100 m and ET0 was developed, as shown in Table 7. In order for the coefficient to be compared with other sites, it was necessary to correlate the rate of drying with a macroclimatic measure of evaporative energy. This is independent of the dam surface microclimate that resulted in scattered A-Pan data. It is clear that the rate of drying is slower during the winter periods when evaporative energy is low and high during the summer period. The steady state reached, as shown in the next subsection, is field capacity, when seepage losses become negligible. Up to this point water loss is due to both evaporation and seepage.
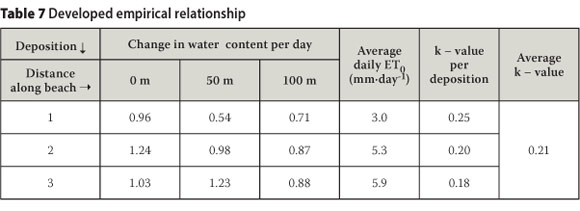
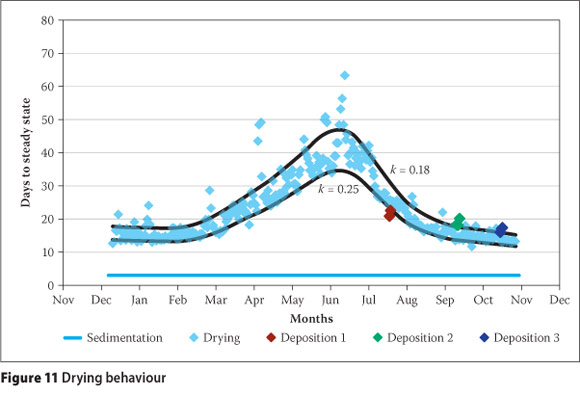
Evaporative energy varies throughout the year. However, the rate of seepage is controlled by the materials' permeability, which remains essentially constant (assuming the material remains saturated and density does not change significantly). During winter the evaporative energy is lower and more moisture may be lost through seepage, with the opposite being the case during summer. It is also likely that this water bleeds up to the surface and is recovered as the material consolidates. This is illustrated by the k-values being slightly higher during winter than in summer, but a longer study would be required to quantify this variation. The relationship would need to be developed taking into account evaporation, seepage and bleed water. Figure 11 illustrates the time required for the sedimentation step and then, using the average k-value, the number of days to reach steady state based on daily ET0 values. Such relationships can be used to optimise the safe development of tailings dams.
Steady state
The wc regime was investigated by analysing auger samples taken at 200 mm intervals to a depth of 1 m, increasing to 2.5 m as the study progressed. The large quantity of data generated enabled the apparent steady state to be investigated relative to sampling position, sampling time and material parameters.
Laboratory geotechnical model
Five laboratory evaporative drying tests and a filter paper test were used to determine the Volumetric Shrinkage Curves (VSC) illustrated in Figure 12. All the samples dried along the zero air voids curve to a wc of roughly 27%, after which air entry occurred. After air entry the dry density remained essentially constant, at roughly 1 700 kgm-3, consistent with accepted in situ dry densities for the material. Box plots (indicating the minimum, maximum and interquartile values) of all the wc values determined for the respective dams are included in the figure for comparison. This illustrates that roughly 25% of the samples were taken before peak density, whereas 75% of the samples were taken at varying degrees of desaturation.
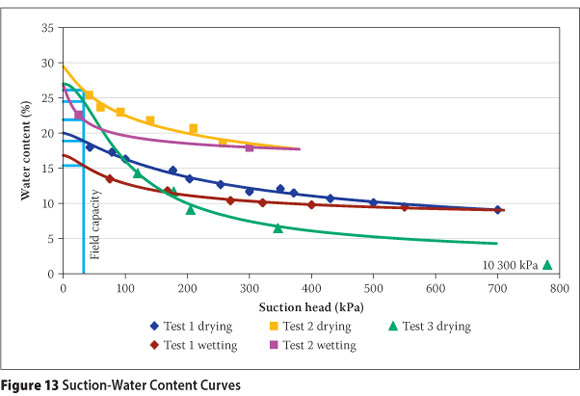
Three separate Suction-Water Content Curves (SWCCs) were determined. Two drying and subsequent wetting curves were determined with calibrated gypsum blocks on samples before and after the introduction of the finer grind (Tests 1 and 2 in Figure 13). The third drying curve was determined by the filter paper method on a prepared sample of finer grind material (Test 3 in Figure 13). The computer program RETC (Van Genuchten et al 1991) was used to estimate the SWCC from the raw data based on the Van Genuchten model. Figure 13 illustrates the curves obtained: the range of air entry values, the range of field capacity values at 33 kPa and asymptotic suction increase below a wc of 14%. Air entry occurred at an average wc of 25% and a standard deviation of 4.9%. The average field capacity was 21% with a standard deviation of 4.3%, similar to the range reported by Ratliff et al (1983). The range in values reflects the slight differences in grading of the samples tested. Due to the fine nature of the material, the SWCCs have a steep gradient which results in air entry and field capacity occurring at close wc values.
The computer program SEEP/W (GeoStudio 2007) was used to predict the relationship between wc and hydraulic conductivity. The volumetric water content function was determined using the modified Kovacs method proposed by Aubertin et al (2003). This method assumes that both capillary and adhesive forces act simultaneously to induce suction and is applicable to tailings, silts and various other soils. The input variables are the particle size corresponding to 10% and 60% passing on the particle size distribution curve, porosity, and liquid limit.
To account for the range in particle sizes along each beach, the minimum, maximum and quartile grading parameters were used. The porosity was calculated to be 0.48 from the dry density of 1 700 kg-m-3 and particle specific gravity of 3.10. The method uses the liquid limit in an empirical expression to calculate the specific surface area for fine-grained plastic-cohesive materials. This expression, however, is required only when the wL is above 30%, which was not the case for this material as the average wl was 23%.
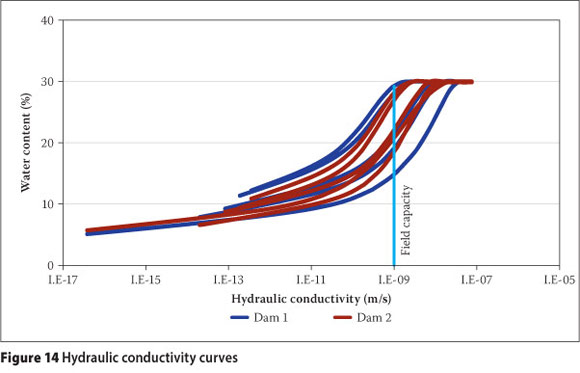
The hydraulic conductivity function was estimated from the volumetric water content function, saturated hydraulic conductivity and residual water content using the Van Genuchten method. The average saturated hydraulic conductivity of 7.5x10⁻⁸ m-s-1 was used. The residual volumetric water content, 4.6%, was determined from the wc at a suction of 1 500 kPa (Van Genuchten 1980) using the filter paper SWCC. This is roughly 10% of the saturated volumetric water content. Volumetric water contents were converted to wc using phase relationships. Meyer & Gee (1999) suggested that field capacity occurs when the hydraulic conductivity decreases to between 10-9 and 10-11 m-s-1, depending on soil type and texture. Figure 14 illustrates the hydraulic conductivity curves and the range in field capacity values at a hydraulic conductivity of 10-9 m-s-1. The values at 10-11 m-s-1 were lower than the laboratory-determined values and therefore not realistic. The average and standard deviation of predicted field capacity values were 22% and 6% for Dam 1, and 23% and 4% for Dam 2. This was comparable to the laboratory-determined values (average 21% and standard deviation of 4.3%). The larger variability of the predicted values on Dam 1 compared with Dam 2 is a consequence of the wider grading envelope for the former, highlighting the sensitivity of soil-suction characteristics to particle size distribution.
Field behaviour
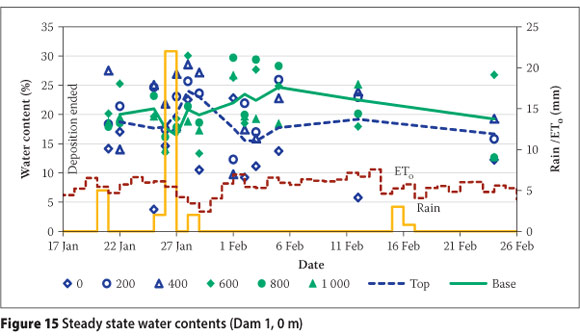
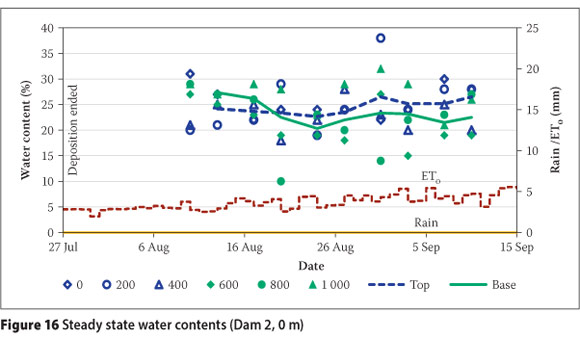
Figures 15 and 16 illustrate that there was no correspondence between wc values at incremental depths over time. Rather, wc values varied within a narrow band that did not change within the time-frame of a depositional cycle. The focus of the study therefore was to explore what this distribution was, whether it changed with depth or over longer time steps, what impact the weather had and what material properties controlled it. Finally, the impact of this limitation on drying, to strength gain, was assessed.
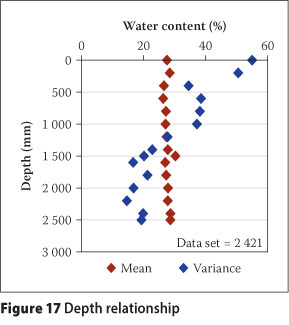
The entire data set was analysed against depth, and Figure 17 shows the mean and variance of wc at each depth increment. The mean is essentially constant, although the variance is roughly 50 for the top 500 mm, 35 from 500 to 1 000 mm and 20 below 1 500 mm. The large dispersion of the data for the first 500 mm is a consequence of samples being at varying stages of drying, from sedimentation to air-dry. As the depth increases, this dispersion decreases as the influence of evaporation becomes less.
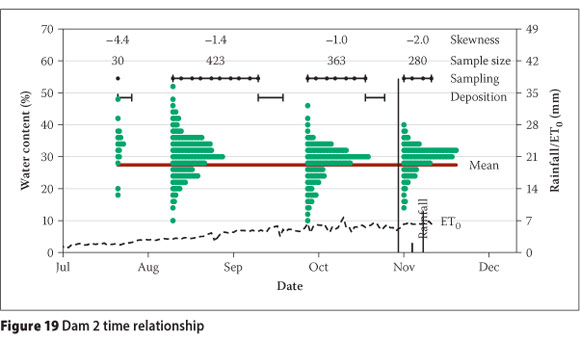
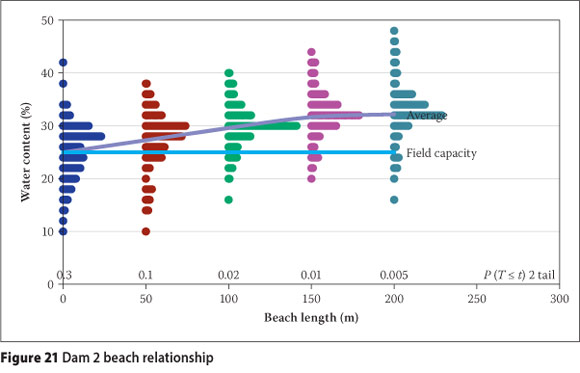
Figures 18 and 19 indicate the deposition sampling periods for the respective dams, with black dots indicating the sampling dates. The ranges of wc determined for each sampling period are represented by separate histograms, with row lengths representing the relative frequency. The mean wc for the entire data set was 27% with a standard deviation of 6%. Therefore, assuming a normal distribution, 98% of the data lie between 41% and 14%. These values correspond to the average wc after sedimentation and the wc at which asymptotic suctions develop. The Pearson coefficient of skewness quantifies the degree of skew about the mean of the entire data set.
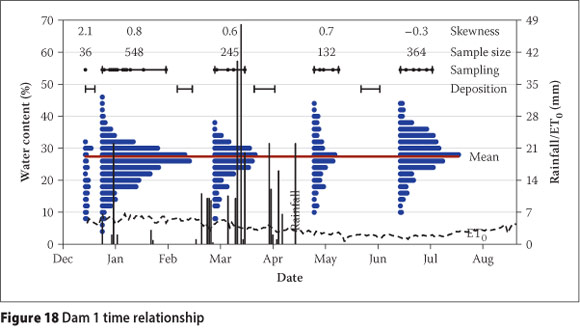
Initial sampling on Dam 1 was to a depth of 1 m and on a beach that had been dormant for six months due to catamaran commissioning constraints. Figure 18 illustrates that, as a result, the wc values were prominently skewed to low values indicative of large suctions. The first deposition "hung up" on the dry beach with virtually no material deposited past 150 m. The large skew in the baseline sampling was not observed during active deposition, although the distributions for the first three depositions during summer and autumn were skewed to lower values. As the beach did not dry out as much during active deposition, subsequent depositions were more uniform. Substantial rainfall during the second deposition highlighted the limited effect of these events on drying. The final deposition during winter on Dam 1 was slightly skewed to values higher than the mean of the entire data set. During winter the ETo values were markedly lower, reflecting the lower evaporative conditions. Although the sampling period was similar to previous depositions, less drying took place.
Before the test work, Dam 2 was raised at roughly twice the rate of Dam 1 and consequently the initial sampling resulted in a distribution skewed to high values. Three test depositions on Dam 2, in spring and summer, were at similar rates of rise to that of the outer portion of Dam 1. Despite the high evaporative conditions, the distributions remained slightly skewed to values above the mean. Dam 2 was therefore significantly moister than Dam 1, although the sampling window and evaporative conditions were similar. The wet baseline conditions appeared to have persisted throughout. It is also postulated that the finer material and shorter beach length affected these results.
To explore the controlling effect of field capacity on the degree of moisture loss, the following null and alternative hypotheses were tested:
H0: Water contents at each sampling point have a different population mean to the field capacity mean.
H1: Water contents at each sampling point have the same population mean to the field capacity mean.
The two-tailed t-test with unequal variances was used to test the hypotheses. The variances were assumed to be different as the field samples were taken at various stages of drying, whereas field capacity has a narrower variance. The predicted field capacity values for each dam were used as these were assumed to better represent the grind differences.
Figure 20 illustrates the distribution of wc at each position along the beach against the results of the hypothesis testing for Dam 1. The alternative hypothesis is accepted for the outer 250 m, although the degree of confidence decreases from being high at the head of the beach. Past 250 m the hypothesis is rejected as the probability is less than 0.05. Following air entry, determined to occur from a wc of 27%, suctions start to develop. As the material reaches field capacity, seepage becomes negligible with moisture loss being dominated by evaporation. Initially, capillary rise will provide moisture at a rate equal to the evaporation rate. If suctions can continue to develop, the hydraulic properties will restrict this moisture loss and stage two evaporation starts, continuing until the material is air-dry. During active deposition only a few samples indicated that suctions larger than field capacity had developed. It is assumed that seepage into base layers during deposition rises during drying to replenish the developing deficits. As illustrated earlier, it was only during the six months of dormancy on Dam 1 that this moisture was depleted and stage two evaporation was observed to have occurred. Hence, during active deposition the degree of moisture loss is controlled by the material's field capacity. Further along the beach moisture can also be obtained from the closer phreatic surface springing from the pool. This is illustrated by the larger portion of saturated wc values past 250 m due to equilibrium with the phreatic surface.
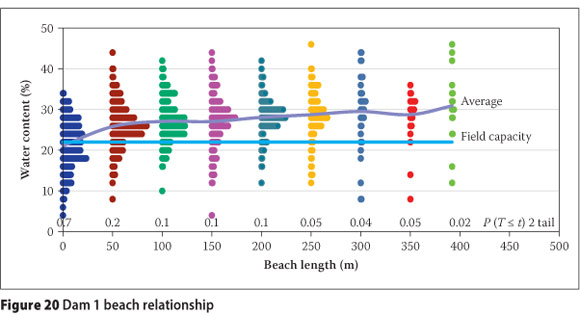
Figure 21 illustrates the relationship for Dam 2, with the alternative hypothesis accepted for the outer 100 m, albeit with less confidence, and rejected for the remainder of the beach. From the baseline sampling, this dam contained significantly more moisture from previous depositions to replenish any developing deficits. Equilibrium with the phreatic regime appears to occur higher up the beach and this is postulated to be the result of the phreatic surface not becoming as depressed along the shorter beach.
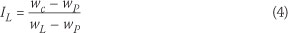
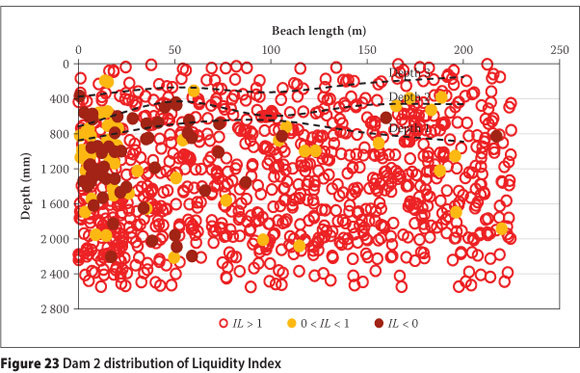
To illustrate the effect of the limited drying that occurs on strength gain, liquidity indices IL were calculated from the average Atterberg limits.
The IL values have been divided into three categories: less than 0 (i.e. wc < wp), between 0 and 1 (i.e. wc between the wP and wL) and greater than 1 (i.e. wc > wj). Negative Il values are indicative of heavily overconsoli-dated soil deposits (Das 2008) and high shear strengths (Bovis 2003). Values between 0 and 1 are indicative of soils that behave plastically, resisting shear failure, whereas values greater than 1 are indicative of soils that are extremely sensitive to breakdown if sheared (Holtz & Kovacs 1981). These categories are shown graphically in Figures 22 and 23 respectively, in relation to sampling positions relative to the final elevation at the end of the test work.
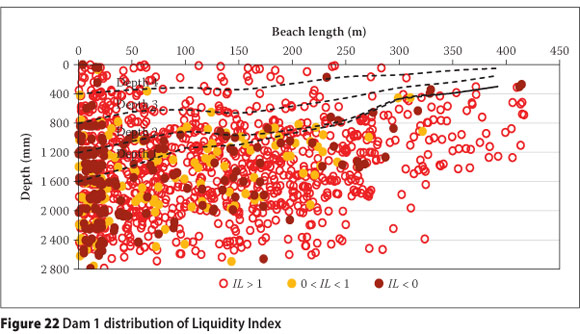
On Dam 1 it is apparent that only the outer section reached a state of high shear strength, with 48% of the samples having an IL less than 1 and 34% being negative-based on the average Atterberg limits. However, 75% of the wc values at this position were lower than the maximum wL of 25%. After 50 m the proportion of samples with an Ij less than 1 was on average 15% for all sampling points, being slightly higher at 50 m and decreasing towards the pool. Thus, the majority of the interior is prone to fail under shear, although it is able to support a man and prevent the auger hole from collapsing. At the head of the beach the distribution with depth is fairly constant for the baseline beach and the first two depositions. As mentioned, the baseline conditions were dry due to the extensive dormant period. The first two depositions during months with high evaporative conditions resulted in a similar strength gain. The third deposition was done under evaporative and rainfall conditions similar to those of the second deposition, but appeared to result in less strength gain. On closer inspection, 65% of the samples were below the maximum wL so it is likely that this material was slightly finer. Due to the low evaporative energy during the final deposition, only 30% of the samples reached a high strength state during the sampling period.
Baseline sampling on Dam 2 indicated that it had not gained significant strength, with only 30% of the samples at the head of the beach having an IL below 1 and the average for the remainder of the beach being 5%. This is attributed to the high rate of rise prior to the test deposition. Analysis at the head of the beach within the first two test depositions indicated that 51% of the samples had an IL below 1, with 75% of the samples being below the maximum wL, as was the case for Dam 1 at this position. This drying front also appeared to extend roughly 1 m below the first deposition, yet insufficient strength gain appeared to have occurred during the shorter sampling window of the final deposition.
DISCUSSION AND CONCLUSIONS
This paper has reported on extensive field and laboratory work to guide mining houses in disposing of tailings. Test work was carried out on two back-to-back facilities receiving similar tailings at Anglo American Platinum Mogalakwena Mine. Dam 1 is an upstream spigot facility and Dam 2 is a waste rock impoundment facility. On-beach sampling was undertaken with laboratory test work carried out on site and at the University of the Witwatersrand, and additional data were sourced from monitoring records. The following conclusions are drawn from the study in order of the stated objectives.
1. On-beach sampling illustrated that within 65 hours (7 hour standard deviation) the settled wc values equalled those anticipated from mechanical paste thickening. Deposition onto a dry beach indicated that cycle times should maintain wet beaches to release water. A rate of rise of 2.5 m-year-1 over the 100 ha Dam 1 was adequate to achieve this. Water balances indicated that the water released on Dam 1 was indeed recovered, providing a significantly cheaper means of recovering water. Similar water recoveries were not observed on Dam 2; it is assumed that this was due to water losses through the highly pervious waste rock impoundment.
2. Following sedimentation, the rate of change of wc values during the drying stage was correlated with ET0, a macroclimatic measure of evaporative energy. The average ratio or k-value was calculated to be 0.21, being slightly lower during the winter months due to lower evaporative energy. The effects of seepage and consolidation bleed water on moisture loss over the course of the year need to be investigated further to fully define the k-value. Such relationships can be used to optimise the safe development of tailings dams.
3. After the drying stage a steady state developed, with wc values varying within a narrow band. The mean wc for the entire 11-month data set was 27% (standard deviation of 6.0%) which was also determined to be the air entry value. Assuming a normal distribution, 98% of the data were between 41% and 14%. These values corresponded to the average settled wc and the wc below which asymptotic suctions developed in suction tests.
With depth the mean wc remained constant, although the dispersion decreased substantially. The freshly deposited layer exhibited the greatest dispersion, with samples at varying stages from settled to air dry. Below this layer the dispersion was lower, decreasing steadily to 1 500 mm before remaining constant, suggesting that this is the limit of evaporative influence.
The wc distribution was observed to vary slightly from one deposition to the next, reflecting changes in evaporative conditions and baseline conditions. The Dam 1 baseline was significantly skewed to low values, indicative of high suctions due to six months' dormancy over spring and summer. Test depositions in summer and autumn resulted in more values below the mean wc, with the opposite being the case for the one winter deposition. Baseline sampling on Dam 2 indicated skew to high wc values due to the high rate of rise prior to test depositions. Test depositions were similarly negatively skewed, albeit to a much smaller extent, although the sampling period and evaporative conditions were similar to those of Dam 1. The wet baseline conditions appeared to have restricted drying.
During active deposition wc distributions were controlled by the material reaching field capacity. Distributions for the outer section of the beach matched those of classically defined material field capacity values as partial suctions developed. During deposition, seepage into the beach rises to replenish deficits, preventing the development of suctions greater than field capacity. The baseline dormancy on Dam 1 illustrates that over long periods this source of moisture can be diminished and air-dry conditions may be approached. Closer to the pool the distributions were observed to be in equilibrium with the phreatic surface due to the greater portion of saturated values. This observation was more pronounced on Dam 1 than on Dam 2, presumably due to the fact that phreatic surfaces become more depressed along longer beaches.
Particle size distributions at the head of the beach contained slightly coarser material which contributed to the drier conditions at this point, despite the minimal beach segregation. This was a result of the IsaMillTM technology utilised by the mine, leading to a predominantly silty material being deposited.
As a consequence of these factors controlling moisture loss, liquidity indices showed that substantial shear strength developed only within the first 25 m to 50 m of the beach. Liquidity indices for the remainder of the beach indicated that the material was prone to fail under shear. This observation was made for all test depositions where the rate of rise for the outer sections was 2.5 m-year-1. The baseline conditions on Dam 2 did not exhibit this strength gain at the beach head due to the 4.6 m-year-1 rate of rise - hence the requirement of a waste rock impoundment.
ACKNOWLEDGEMENTS
The authors wish to acknowledge Anglo American platinum, Fraser Alexander Tailings, SRK Consulting and the South African Weather Bureau for making this study possible.
LIST OF SYMBOLS
∆ slope of the vapour pressure curve (kPa.°C-1)
cw solids concentration by mass
ea actual vapour pressure (kpa)
es saturation vapour pressure (kpa)
ET0 reference evapotranspiration (mm-day-1)
G soil heat flux density (MJ-m-2-day-1)
Gs particle specific gravity
IL liquidity index
Ra extra-terrestrial radiation (mm-day-1)
Rn net radiation at the crop surface (MJ-m-2-day-1)
SWCC Suction-Water Content Curve
T daily mean temperature (°C)
Tmax daily maximum air temperature (°C)
Tmean daily mean air temperature (°C)
Tmin daily minimum air temperature (°C)
u2 wind speed at a height of 2 m (m-s-1)
VSC Volumetric Shrinkage Curve
wc gravimetric water content
wL liquid limit
wP plastic limit
Y psychrometric constant (kPa-°C-1)
NOTE
1 Here thickening is a process step whereby the solids concentration by mass, cw is increased by a mechanical process. Low-density slurry has cw values between 30% and 50%, paste has cw values between 50% and 65% and cake has cw values above 80%.
REFERENCES
Allen, R G, Pereira, L S, Raes, D & Smith, M 1998. Crop évapotranspiration guidelines for computing crop water requirements. Rome: Food and Agriculture Organization (FAO). [ Links ]
Allen, G A, Pruitt, W O, Raes, D, Smith, M & Pereira, L S 2005. Estimating evaporation from bare soil and the crop coefficient for the initial period using common soils information. Journal of Irrigation and Drainage Engineering - ASCE, 131(1): 14-23. [ Links ]
Aubertin, M, Mbonimpa, M, Bussière, B & Chapuis, R P 2003. A model to predict the water retention curve from basic geotechnical properties. Canadian Geotechnical Journal, 40(3): 1104-1122. [ Links ]
Benli, B, Bruggeman, A, Oweis, T & Üstün, H 2010. Performance of Penman Monteith FAO56 in a semi-arid highland environment. Journal of Irrigation and Drainage Engineering - ASCE, 136(11): 757-765. [ Links ]
Blight, G E & Bentel, G M 1983. The behaviour of mine tailings during hydraulic deposition. Journal of the South African Institute of Mining and Metallurgy, April. [ Links ]
Blight, G E, Copeland, A, Jardine, P, & MacRobert, C 2012. Measurements on freshly-deposited surfaces of two platinum tailings dams. Proceedings, Paste 2012 Conference, Sun City, South Africa. [ Links ]
Bovis, M J 2003. Atterberg limits. In: Middleton, G V (Ed.), Encyclopaedia of Sediments & Sedimentary Rocks, Dordrecht: Kluver Academic Publishers, pp 22-24. [ Links ]
Das, B M 2008. Fundamentals of Geotechnical Engineering. Toronto: Thomson Learning. [ Links ]
Donaldson, G W 1960. An investigation into the stability of slimes dams. Masters Thesis. UCT. [ Links ]
Fredlund, D G & Rahardjo, H 1993. Soil Mechanics for Unsaturated Soils. New York: Wiley. [ Links ]
GeoStudio (computer software) 2007. Calgary, Alberta: Geo-Slope International. [ Links ]
Gibson, R E, England, G L & Hussey, M J L 1967. The theory of one-dimensional consolidation of saturated clays. 1: Finite non-linear consolidation of thin homogeneous layers. Géotechnique, 17: 261-273. [ Links ]
Hargreaves, G H & Allen, R G 2003. History and evaluation of the Hargreaves evapotranspiration equation. Journal of Irrigation and Drainage Engineering -ASCE, 129(1): 53-63. [ Links ]
Holtz, R D & Kovács, W D 1982. An Introduction to Geotechnical Engineering. New Jersey: Prentice Hall. [ Links ]
Koorevaar, P, Menelik, G & Dirksen, C 1999. Elements of Soil Physics. Amsterdam: Elsevier Science. [ Links ]
Kynch, G J 1952. A theory of sedimentation. Transactions of the Faraday Society, 48: 166-176. [ Links ]
Lyell, K A, Copeland, A M & Blight, G E 2008. Alternatives to paste disposal with lower water consumption? Proceedings, Paste 2008 Conference, Kasane, Botswana, pp 171-178. [ Links ]
Meyer, P & Gee, G 1999. Flux-based estimation of field capacity. Journal of Geotechnical and Geoenvironmental Engineering, 125(7): 595-599. [ Links ]
Miller, R W & Donahue, R L 1990. Soils. An Introduction to Soils and Plant Growth. New Jersey: Prentice Hall. [ Links ]
Pane, V & Schiffman, R L 1985. A note on sedimentation and consolidation. Géotechnique, 35(1): 69-72. [ Links ]
Ratliff, L F, Ritchie, J T & Cassel, K 1983. Field- measured limits of soil water availability as related to laboratory-measured properties. Soil Science Society of America Journal, 47: 770-775. [ Links ]
Van Genuchten, M Th 1980. A closed form equation predicting the hydraulic conductivity of unsaturated soils. Journal of the Soil Science Society of America, 44: 892-898. [ Links ]
Van Genuchten, M Th, Leij, F J & Yates, S R 1991. The RETC Code for Quantifying the Hydraulic Functions of Unsaturated Soils, Version 1.0. U.S. Salinity Laboratory, USDA ARS, Riverside, California, EPA Report 600/2 91/065. [ Links ]
Vietti, A, Boshoff, J & Cope, A 2010. Does thickening save water? Civil Engineering, 18(5): 41-45. [ Links ]
Wels, C & Robertson, A M 2003. Conceptual model for estimating water recovery in tailings impoundments. Proceedings, Tailings and Mine Waste '03 Conference, Lisse, Netherlands: Sweets & Zeitinger. [ Links ]
 Contact details:
University of the Witwatersrand, Department Civil Engineering
Private Bag 3, WITS, 205C
South Africa
T: +27 11 717 7156
E: Charles.MacRobert@wits.ac.za
Contact details:
University of the Witwatersrand, Department Civil Engineering
Private Bag 3, WITS 2050
South Africa
T: +27 11 717 7105, F: +27 11 717 7045
E: Geoffrey.Blig ht@wits.ac.za

CHARLES MACROBERT, who is a Candidate Engineer and an Associate Member of SAICE, received his BSc in Civil Engineering from the University of Cape Town and worked for Anglo American Technical Services. During his time at Anglo he completed his MSc at the University of the Witwatersrand before moving to the university as a lecturer in Geotechnica Engineering. His research interests lie in innovating the way in which tailings facilities are monitored, and developing the understanding and implication of seepage through coarse mine residues.

PROF GEOFF BLIGHT is Professor Emeritus of Civil and Environmental Engineering at the University of the Witwatersrand, Johannesburg. He has specialised in the study of environmenta geotechnics and geomechanics since 1957 and has published more than 300 papers on the subject in refereed journals and the refereed oroceedings of international conferences. He has also published five books on these and related subjects. He was the Cross Canada Lecturer of the Canadian Geotechnical Society in 1996, the Rankine Lecturer of the British Geotechnical Society, the first GRC Lecturer of Singapore's Nanyang University in 1997 and the Lawrence Lecturer of the Solid Waste Association of North America in 1999. He was awarded the South African Geotechnical Medal and elected an Honorary Fellow of the South African Institution of Civil Engineering in 1997.

