


Servicios Personalizados
Articulo
 Inglés (pdf)
 Articulo en XML
 Referencias del artículo
Indicadores

Links relacionados
-
 Citado por Google
 -
 Similares en Google
Compartir

 Permalink
Journal of the South African Institution of Civil Engineering
versión On-line ISSN 2309-8775
versión impresa ISSN 1021-2019
J. S. Afr. Inst. Civ. Eng. vol.55 no.3 Midrand ene. 2013
TECHNICAL PAPER
Laser-based assessment of road aggregate particle shape and texture properties with the aim of deriving comparative models
J Breytenbach; J K Anochie-Boateng; P Paige-Green; J L van Rooy
ABSTRACT
Research was undertaken using an innovative three-dimensional (3D) laser scanning tool to study the shape and texture characteristics of road aggregate particles. Aggregate materials used for road construction, including G1 crushed rocks of different geological origins, recycled aggregate and alluvial gravel (not used as aggregate) were used for this study. Representative samples were scanned using the laser system to collect 3D aggregate data for analyses and, subsequently, develop comparative models. The objective was to arrange the aggregate particles in a sequence based on their surface texture. Two models were proposed and key aspects evaluated against each other. Ultimately, one model was selected that may be improved and used for further research. The study found that, while it is possible to use the 3D aggregate scan data to produce comparative models, distinguishing between particle shape and texture proved a daunting task. It was also concluded that particle elongation must be considered as a major influencing factor.
Keywords: road aggregate, particle shape, particle texture, laser scanner, particle mode
INTRODUCTION
The study forms part of a PhD research project (Breytenbach 2013), which is aimed partially at deriving a tabulated range of particles that could graphically or numerically represent a range of aggregate shape and texture properties. The proposed model, if validated, should be able to arrange particles in a certain sequence based on their texture properties. The method would lend scientific substantiation to particle shape characterisation instead of using visual observations, which have previously (to a larger extent) been used to quantify aggregate particle shape and texture.
An innovative study using three-dimensional (3D) laser scanning technology in the application of road materials is under way at the CSIR. The laser scanning method is applied to road construction aggregate using different approaches, attempting to study aggregate particle properties in great detail and for different applications. Emphasis has thus far been placed on particle shape and surface properties (Anochie-Boateng et al 2010) and the Flakiness Index (Anochie-Boateng et al 2011a), among others.
This paper describes the application of the laser scanning method in an attempt to refine the description of particle textures and shapes. The two comparative models proposed endeavour to sort aggregate particle data obtained from coarse/angular to smooth/rounded particles.
EXISTING METHODS
A number of advanced methods have been applied to study the particle shape properties of aggregates. Rao et al (2002) attempted to quantify the angularity of particles and ultimately showed that their approach (using image analysis) could distinguish between rounded gravel and crushed stone. Fletcher et al (2002) discussed an aggregate imaging system (AIMS) using back-lighting. It is clear that this method is able to determine the angularity of coarse and fine aggregate, as well as relative dimensions, thereby enabling the identification of flat or elongated particles. Other back-lit systems have also been used (Fernlund 2005; Ken et al 2009), while Descantes et al (2006) and Bouquety et al (2006) used videographers in combination with a back-lit system.
Kim et al (2003) analysed materials using a laser-based approach. The digital image technology (DIT) calculates the volume of a particle, as well as the minimum square aperture through which a particle could fit.
However, the approaches discussed above are based on imaging techniques, which could at best capture two-dimensional (2D) physical attributes of the aggregate particles. In reality, aggregate particles are three-dimensional; accordingly, any improved techniques or methods should be able to address the physical properties in three dimensions.
The approach used in this research is based on 3D scanning techniques that were recently introduced by the CSIR (Anochie-Boateng et al 2010; Anochie-Boateng et al 2011a; Anochie-Boateng et al 2011b). Details will not be repeated in this paper.
METHODOLOGY
Scanning procedure
Scanning of aggregate particles is done according to a protocol developed specifically for the laser scanner at the CSIR (Anochie-Boateng & Komba 2010). The approach adopted consists of four steps which can be summarised as follows:
1. Scanning: The first step entails physical processing of the particle by means of scanning. During the first phase, four faces of the particle are scanned (the particle is placed on a rotating table in the scanner). The particle is then rotated in order to scan the remaining two faces which were not in line of sight during the first scan phase (i.e. top and bottom).
2. Alignment: During this step the data obtained from the two scanning phases are orientated by the user. In essence, this step simply rotates and moves the two scans (dataset) into the correct orientation relative to each other.
3. Combining: Software is used to combine the correctly orientated data.
4. Merging: The combined data are merged into a single object and saved as a single particle presented in three dimensions. Any refinement (e.g. removal of small imperfections or overlapping areas, etc) is also executed during this step.
The scanning density used by the scanning equipment can be varied according to the user's requirements. The density used affects the resolution of the final result and also the amount of time required to scan the particle. A higher scan resolution results in a longer scan time. The maximum scan resolution of the equipment is 0.1 mm and the time required to scan a particle is also affected by the size of a particle.
Particle selection
The aggregate particles and materials used during this study are part of other ongoing projects running congruently at the CSIR. The sourced aggregates used in this study included the following geological materials:
■ Quartzite (G1 aggregate from stockpile) -
Magaliesberg Formation, Pretoria Group, collected in Pretoria, Gauteng
■ Granite (G1 aggregate from stockpile)
- Johannesburg Dome, collected in Midrand, Gauteng
■ Tillite (G1 aggregate from stockpile)
- Dwyka Group, Karoo Supergroup, collected in Verulam, KwaZulu-Natal
■ Hornfels (G1 aggregate from stockpile)
- Tygerberg Formation, Malmesbury Group, collected in Durbanville, Western Cape
■ Dolerite (G1 aggregate from stockpile) -Karoo Supergroup, collected in Trichardt, Mpumalanga
■ Recycled aggregate - National Asphalt plant in Durban, KwaZulu-Natal
■ Alluvial gravel - Quaternary aged surface deposit sampled from the river bed of the Molopo River, some 120 km west of Mafikeng, North West Province; this material is not an aggregate source.
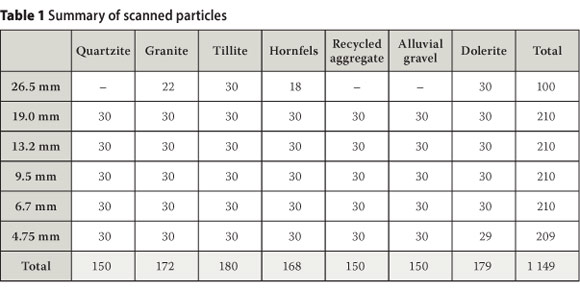
Each material was screened (using a sieve stack) into different particle sizes for the purposes of scanning. The bulk samples were screened into the +26.5 mm, +19.0 mm, +13.2 mm, +9.5 mm, +6.7 mm and +4.75 mm constituents. Particles of 37.5 mm size and larger were not considered as they fall outside the COLTO (1998) specification for G1 crushed rock aggregate. Particles smaller than 4.75 mm were not scanned due to practical limitations of the scanning device.
Once the bulk samples had been graded into their fractions, 30 particles were selected from each size constituent of each material. Table 1 summarises the number of particles used. In a number of materials the 26.5 mm size fraction had some shortages, as the materials were shared with other research projects. After selection, the particles were cleaned and oven-dried (at 105°C for 24 hours) and left to cool before being scanned.
Data capture
Scan data were captured in a spreadsheet format and entered manually into Microsoft Excel®. The final result was six spread sheets (i.e. 26.5 mm, 19.0 mm, 13.2 mm, 9.5 mm, 6.7 mm and 4.75 mm) which contained data on all material types scanned.
The parameters that were recorded in the dataset include the material type, the number of the sample particles and the three primary dimensions (i.e. length, width and depth/height). The volume (mm3) and total surface area (mm2) of each particle were recorded directly from the scan results. The scan data and/or spreadsheets are not included in this article due to their volume (i.e. 1 149 datasets).
DISCUSSION
Two working concept models were developed using the scan data, one of which was ultimately abandoned as the model was heavily affected by factoring in the so-called "elongation value" (the ratio between the minimum and maximum dimensions of a particle). The second model proved to be superior to the first in that it discerned between differences in particle textures, as opposed to being excessively affected by the particle shape. The second model was further refined to develop a reference system for each particle size to enable comparison of particle textures.
Data manipulation
The data arrangement described above was done specifically with the aim of calculating another parameter to be used in analysis. In spreadsheet form the parameter was labelled "elongation value". The Flakiness Index was previously assessed by Anochie-Boateng et al (2011a) using the same laser scanning system, but the approach adopted here (i.e. using the elongation value) simplified data analysis considerably.
In order to make provision for the effects of elongated or flattened particle shapes, data were divided into subgroups to assess whether the elongation/flatness would affect the derived model(s). It was therefore necessary to derive a descriptor for this assessment. Particle data were divided into "regular" and "elongated" subsets, based on the ratio between the maximum and minimum dimensions of a particle. An elongation value was calculated as follows:

where
EV = elongation value
Length = the particle's maximum dimension
Depth = the particle's minimum dimension
Particles with an EV > 2 were considered to be "elongated", while particles with an EV < 2 were considered to be "regular". The spreadsheet data were sorted based on the calculated elongation values and subdivided accordingly. Once data sorting had been completed, limited descriptive statistics and histogram analyses were done to verify data properties and identify potential shortages in data ranges.
Data were processed for all particle sizes and subsequently two comparative models (one for elongated particles and one for regular particles) were produced for each size fraction.
Proposed Model One
The first model considers three parameters, namely particle volume, particle surface area and the calculated elongation value. The "model value" is calculated as follows:
where
V = particle volume (mm3)
A = particle surface area (mm2)
EV = elongation value
Histogram analyses for the regular and elongated datasets are illustrated in Figure 1 and Figure 2 respectively. From the histogram of the elongated particles (Figure 2) it is clear that there are no data for the model value range between 6.0 and 7.0, which produced gaps in the output chart for the model. This underlines the effects of factoring in the elongation value and the limitations it imposes on the derived models.


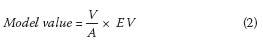
After revision of the histogram data, model values were sorted in ascending order and model value ranges were calculated. Ten random values within the data range were selected and the closest corresponding particles were entered into a table. Table 2 shows the models selected for elongated particles and Table 3 shows the models selected for regular particles.
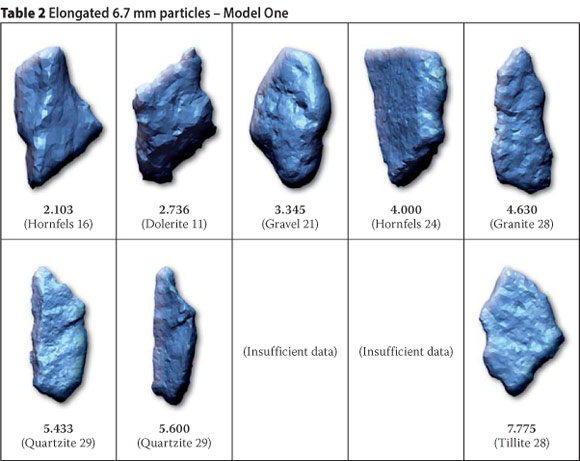
The tabled results reflect the findings of the histogram analyses in which gaps were found in the data range proposed for the elongated particles. Factoring the elongation value into the model also introduced a bias towards elongated particles in both datasets. Subsequently, the results show little refinement in data, particularly for the elongated particles. Considering that the aim of the model was to sort the particle data from coarse/angular to smooth/rounded particles, it is clear that this model was only moderately successful for regular particles and largely unsuccessful for elongated particles.
Proposed Model Two
The results from the first model led to the second model, in which the elongation value is no longer factored into the model value:
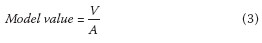
V and A are defined in Equation 2.
The subsequent histogram analyses show an improvement in model data presentation. Although the histogram for regular particles (Figure 3) shows little improvement over the same dataset for Model One, the histogram for elongated particles (Figure 4) no longer has the previous gap in data for the second model.

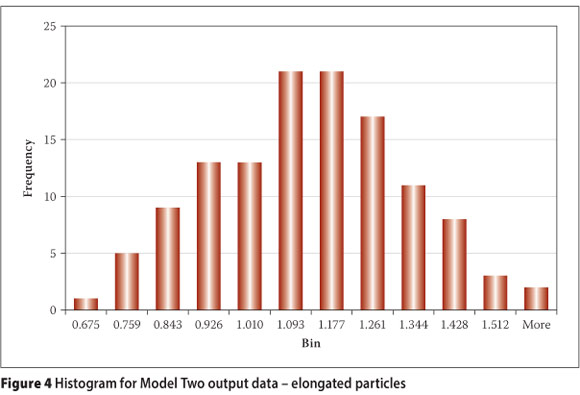
The calculated model values were again sorted in ascending order, but this time 10 equal increments were identified between the minimum and maximum data values. The datasets were used to identify the nearest corresponding value and the applicable particles were again entered into a table. The results are summarised in Table 4, while Table 5 and Table 6 show the results for elongated and regular particles respectively.
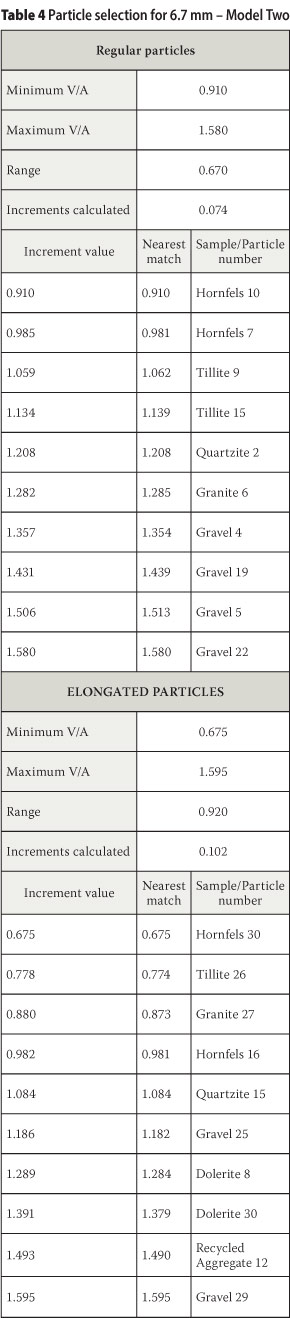

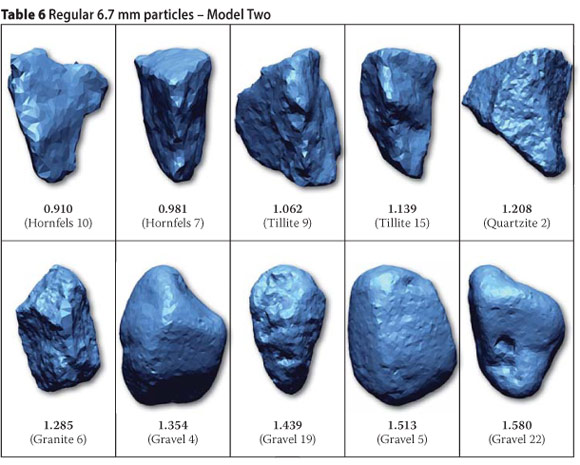
In this instance the results showed significant refinement based on the data from the second model. The refinement is perhaps more clearly observed in the elongated particle results than in the regular particle results. Model Two shows good potential for arranging particles from rough/angular to smooth/rounded, although there is still room for improvement.
Model comparison
From a visual comparison of the results of the two proposed models it is clear that the second model refines and arranges data more effectively from rough or angular particles to smooth or rounded particles. The limited calculated model data in Model One may be due to factoring the elongation value into the calculations.
CONCLUSION
The research was undertaken to determine whether a three-dimensional laser-based scanning method could be applied to the modelling of the shape and texture of road aggregate particles in an attempt to arrange particles based on their surface texture. The laser scanning technique applied was relatively successful in producing comparative models that can be used to describe or classify aggregate particle shape and surface texture properties. The scan data obtained from scanning various aggregate materials were used to develop and compare two derived models.
The results indicate that the second proposed model shows better potential for describing the shape and surface texture properties of the aggregates, compared with the first model. Nevertheless, further development is required. It was found that factoring an elongation value (EV) into the proposed model (i.e. Model One) had a negative effect. The data with the elongation value factored into the model were heavily biased towards the inclusion of either elongated or flat particles. Generally, neither of the proposed models could effectively discern between particle roughness and angularity as the two parameters appear to be strongly co-dependent.
RECOMMENDATIONS
It is suggested that the approach used in Model Two be considered for further analyses and investigations of particle properties. Additional scan data obtained from mixed geological sources will also assist in the further refinement of the models. Further studies may have to investigate how elongation properties can be combined with surface area or volume separately, as alternatives.
ACKNOWLEDGEMENTS
The work presented in this paper received funding from the Council for Scientific and Industrial Research (CSIR) Strategic Research Panel (SRP) project TA 2001-001. The authors would like to acknowledge the CSIR R&D office for funding this SRP project. Mr Julius Komba of the CSIR and the University of Pretoria, and Ms Sibongiseni Lusawana of the CSIR and Tshwane University of Technology in Pretoria assisted in the scanning of the aggregates used in this research.
REFERENCES
Anochie-Boateng, J & Komba, J 2010. Laser scanning protocol for determining aggregate shape and surface properties. Report No CSIR/BE/IE/ IR/2010/0061/B, Pretoria, CSIR. [ Links ]
Anochie-Boateng, J, Komba, J J, Mukalenga, N & Maharaj, A 2010. Evaluation of 3D laser device for characterizing shape and surface properties of aggregates used in pavements. Paper presented at the 29th Southern Africa Transportation Conference, Pretoria, August. [ Links ]
Anochie-Boateng, J, Komba, J & O'Connell, J 2011a. Laser-based approach for determining flakiness index of aggregates used in pavements. Paper presented at the 30th Southern Africa Transportation Conference, Pretoria, July. [ Links ]
Anochie-Boateng, J, Komba, J & Mvelase, G M (2011b). Advanced and automated laser-based technique to evaluate aggregates. Paper presented at the IRF International Road Congress, Innovation in Road Infrastructure, November, Moscow, Russia. [ Links ]
Bouquety, M N, Descantes, Y, Barcelo, L, de Larrard, F & Clavaud, B 2006. Automated measurement of aggregate properties: Part 2 - Flakiness index. Materials and Structures, 39(1): 13-19. [ Links ]
Breytenbach, I J 2013. The effects of particle shape and texture characteristics on shear properties of compacted crushed stone aggregate used in road construction. Unpublished PhD thesis, University of Pretoria, South Africa. [ Links ]
COLTO (Committee of Land Transport Officials) 1998. Standard Specifications for Road and Bridge Works for State Road Authorities. South African Institution of Civil Engineering (SAICE), Midrand, South Africa. [ Links ]
Descantes, Y, Fosse, Y & Ehret, G 2006. Automated measurement of aggregate properties: Part 1 -Crushed and broken surfaces in coarse aggregate particles. Materials and Structures, 39(1): 3-12. [ Links ]
Fernlund, J M R 2005. Image analysis method for determining 3-D size distribution of coarse aggregates. Bulletin of Engineering Geology and the Environment, 64(2): 159-166. [ Links ]
Fletcher, T, Chandan, C, Masad, E & Sivakumar, K 2002. Aggregate imaging system (AIMS) for characterizing the shape of fine and coarse aggregate. Paper presented at the 82nd Annual Transportation Research Board, July. [ Links ]
Ken, C, Pan, Z & Xuemei, Z 2009. A description method for arbitrarily shaped and sized granules in 2D image. Journal of Electronics (China), 26(3): 423-427. [ Links ]
Kim, H, Haas, C T & Rauch, A F 2003. 3D Image segmentation of aggregates from laser profiling. Computer-Aided Civil and Infrastructure Engineering, 18(4): 254-263. [ Links ]
Rao, C, Tutumluer, E & Kim, I T 2002. Quantification of coarse aggregate angularity based on image analysis. Transportation Research Record, No. 1787, TRB, National Research Council, Washington D.C., pp 117-124. [ Links ]
 Contact details:
PO Box 73478
Lynnwood Ridge, 0040, South Africa
T: +27 82 577 6215
F: +27 12 991 2555
E: izak@soilkraft.co.za
Contact details:
CSIR Built Environment
PO Box 395
Pretoria, 0001, South Africa
T: +27 12 841 2947
F: +27 12 841 2690
E: JAnochieBoateng@csir.co.za
Contact details:
Postnet Suite 89
Private Bag X8
Elardus Park, 0047, South Africa
T: +27 82 444 1121
F: +27 12 345 6028
E: paigegreenconsult@gmail.com
Contact details:
Department of Geology University of Pretoria
Private Bag X20
Hatfield, 0028, South Africa
T: +27 12 420 2023
F: +27 12 362 5219
E: louis.vanrooy@up.ac.za

IZAK BREYTENBACH obtained his MSc degree in Environmental and Engineering Geology from the University of Pretoria in 2009. He is a Professional Natural Scientist registered with SA Council for Natural Scientific Professions (SACNASP) and a member of the South African nstltute for Engineering and Envlronmenta Geologists (SAIEG). He works as a consultant in the engineering geologica and geotechnical field.

DRJOSEPH ANOCHIE-BOATENG Is a Princlpa Researcher at CSIR Built Environment. He obtained his PhD in Civil Engineering from the University of Illinois, United States, in 2007 and has worked at the CSIR for the past five years. At the CSIR he leads a team that employs modern laser scanning and numerical techniques to effectively address the difficulties associated with the characterisation of shape/surface properties of road aggregates (natural, recycled, marginal) and railway ballast. He is a member of local and international transport infrastructure committees, including the South African National Roads Agency Ltd materials cluster, and the Transportation Research Board, USA, mineral aggregate committee.

DR PHIL PAIGE-GREEN is a self-employee consultant in the roads and geomaterials field. He obtained his PhD in Engineering Geology from the University of Pretoria in 1989 and has recently -etired from the CSIR after 37 years' service. He is a Fellow of the South African Institute for Engineering and Environmental Geologists (SAIEG), a registered Professional Natural Scientist with the SA Council for Natural Scientific Professions (SACNASP) and an Associate Member of the South African Institution of Civil Engineering (SAICE). He was recently Vice-President for Africa of the International Association for Engineering Geology and the Environment (IAEG) and President of SAIEG.
PROF LOUIS VAN ROOY obtained his PhD degree in Engineering Geology at the University of Pretoria in 1992. He started lecturing in the Department of Geology at University of Pretoria in 1985 and has lectured to undergraduate and postgraduate mining, civil engineering, engineering geology and geology students. His research interests include the durability of basic igneous rocks for use in civi engineering construction, problem soils and safe development on dolomite land. He has supervised a number of MSc and PhD students and is author or co-author of more than 30 papers in journals and at conferences.

