


Services on Demand
Article
 English (pdf)
 Article in xml format
 Article references
Indicators

Related links
-
 Cited by Google
 -
 Similars in Google
Share

 Permalink
Journal of the South African Institution of Civil Engineering
On-line version ISSN 2309-8775
Print version ISSN 1021-2019
J. S. Afr. Inst. Civ. Eng. vol.55 n.2 Midrand Jan. 2013
TECHNICAL PAPER
Strong winds in South Africa: Part 2 Mapping of updated statistics
A C Kruger; J V Retief; A M Goliger
Contact details
ABSTRACT
Although wind is the most important environmental action on buildings and structures in South Africa, the last comprehensive strong wind analysis was conducted in 1985. The current wind loading code is still based on the strong wind quantiles forthcoming from that analysis. Wind data available for strong wind analysis has increased about five-fold, due to the employment of automatic weather station (AWS) technology by the South African Weather Service. This makes an updated assessment of strong winds in South Africa imperative.
Based on the estimation of strong winds as reported in the accompanying paper (see page 29 in this volume), the spatial interpolation of 50-year characteristic strong wind values to provide updated design wind speed maps is reported in this paper. In addition to taking account of short recording periods and the effects of the mixed strong wind climate, the exposure of the weather stations was considered and correction factors applied. Quantile values were adjusted to compensate for the small data samples. The resultant design maps reveal regions of relatively high and low quantiles, but with an improved relationship with physical conditions compared to the previous analyses.
Consequently some significant differences in quantiles between the present and previous analyses were found. The complexity of the resulting strong wind maps is not only the result of the improved resolution of the larger number of weather stations, but also due to an improved identification of the effects of physical factors such as the mixed strong wind climate and topography. Guidance can also be derived for future updating, such as incorporating accumulated observations and improved coverage by additional AWS in critical regions.
Keywords: strong wind climate, wind statistics, wind maps, design wind speed, South Africa
INTRODUCTION
Wind loading represents the dominant environmental action to be considered in the design of structures - for certain classes of structures, such as tall buildings or light construction. Provision for wind loading therefore plays a prominent role in the new South African National Standard SANS 10160:2010, and in particular Part 3 Wind Actions (SANS 10160-3:2011).
An obvious motivation to update the information on the strong wind climate for South Africa, on which the previous South African Loading Code SABS 10160:1989 was based, became apparent when SANS 10160-3:2010 was prepared: Since Eurocode EN 1991-1-4:2005 was used as reference standard for the stipulations and procedures for SANS 10160-3:2010, significant differences in climatic conditions needed to be provided for, of which the most important is the prevalence of thunderstorms as a source of strong winds in South Africa (Goliger & Retief 2002). It was also apparent that the strong wind climate of the country is complex, resulting not only in significant spatial and regional tendencies, but also that the dominating strong wind mechanism for a certain region and even locality is not clear, and that mixed strong wind climate conditions may be prevalent.
A review of the general principles for codified procedures for wind loading in the context of South African conditions is presented by Goliger et al (2009a). The basis for implementing these principles is presented by Goliger et al (2009b). A significant deficiency in the process was the lack of opportunity to update the representation of the climatic strong wind conditions for SANS 10160-3:2010. However, the need for a thorough review and investigation of conditions could clearly be established and motivated.
BACKGROUND
In South Africa strong winds can be broadly categorised into two types, namely those of the synoptic scale origin, e.g. from cold fronts, and those of convective origin, i.e. thunderstorms. The origins of the strong winds in South Africa are analysed in-depth in Kruger et al (2010). For the areas dominated by strong winds from thunderstorms, an averaging time of 3 seconds or less is recommended for a meaningful determination of the strong value design wind speeds. This is due to the short duration of the strong winds from thunderstorms, which are typically related to the passage of the gust front, defined as the leading edge of the thunderstorm downdraft.
The European wind climate is dominated by synoptic-scale mid-latitude cyclonic storms. The EN-1991-1-4 is based on these weather conditions, and therefore the basic wind speed (the strong wind speed that can be expected every 50 years) is derived for an averaging period of 10 minutes, with fixed conversion factors between the different averaging time scales due to the maturely developed turbulence conditions of synoptic scale winds. Therefore, while the Eurocode is followed by deriving the basic wind speed for an averaging period of 10 minutes, this research investigated the design wind speeds at averaging times of 2-3 seconds and one hour. This is in agreement with the design procedures employed in SABS 0160:1989 as transferred to SANS 10160-3:2010. In a mixed strong wind climate an averaging time of 2-3 seconds is sufficiently short to capture the wind strengths of only the gust fronts from thunderstorms, while one hour is deemed long enough not to contaminate the averaging period with these relatively strong wind gusts of very short duration. It is argued that from the results the 10 minute design wind speeds can be derived by the application of appropriate conversion factors, which would distinguish between thunderstorm- and synoptic-scale dominated strong wind climates.
Strong winds produced by thunderstorms are usually of very short duration, and therefore the relationships between the strong winds at the different time-scales in places dominated by thunderstorms are not as constant as in the case where the strong winds produced by synoptic-scale (fully developed) events are dominant. At the coast strong wind profiles on the synoptic scale tend to be prevalent (where thunderstorms can occur, but are usually embedded in the frontal system), while in the interior the profiles tend to be dominated by thunderstorms. This issue is emphasised in SABS 0160:1989 (Goliger et al 2009a), where the gust factor, i.e. the ratio between the 2-3 second wind gust and the hourly mean wind speed, for the interior is 2.0 while for the coast it is 1.6. The differences in gust factors, and the fact that the analysis of strong winds in a mixed wind climate requires the assessment of the different causes of the strong winds, make the recognition of mixed strong wind climates imperative in the statistical analysis of wind data.
Environmental influences on wind measurements include the terrain roughness, topography and the presence of prominent features or structures within the immediate vicinity of the anemometers. Loading codes stipulate correction factors to the design wind speed, for various categories of terrain roughness and topographical features upstream of the site under consideration. These correction factors require that the basic wind speed in an area be based on the wind speed that would have been measured under standardised conditions, i.e. in open, flat terrain with no significant obstacles or complex topographical features close-by; classified as Terrain Category II in SANS 10160-3:2011. It therefore follows that the wind speeds, from which the strong winds are estimated, should be recorded under these ideal standardised conditions. If this is not the case, correction factors should be developed, where possible, to compensate for the inadequacies in the measuring environment. Also, the correction factor may depend on the origin of the strong winds and are therefore different for synoptic and thunderstorm wind gusts.
APPROACH AND METHODOLOGY
An outline of the process followed to compile the information that should serve as input for the determination of the characteristic wind speed across the country is provided in Kruger et al (2011a), of which a brief synopsis is provided below.
General considerations
The main aspects considered were the physical environment, the coverage of the weather stations, the audit and quality control of the available usable climate data and the exposure of weather stations.
The aspects of the physical environment of which the complexity had to be considered included the mixed strong wind climate and the topography. This applies to especially the escarpment and the Cape Folded Mountains, which extend to Cape Town and surroundings.
The present wind maps for South Africa are based on a network of 14 Dines pressure tube anemograph stations (Milford 1985a & b). Due to the deployment of Automatic Weather Stations (AWS) since the early 1990s, the number of stations has increased to 209 with new AWS installations deployed on a regular basis. However, the recording periods of most stations are still severely constrained.
The wind data could be divided into two distinct periods - the period of the Dines anemograph and the AWS anemometers - between which significant discrepancies were evident. The exposure and quality of data from the Dines anemographs are also suspect, with the consequence that only AWS data was utilised in the analysis. The quality assessment of the records included assessments of record length and completeness, data homogeneity, and spikes, by inter alia the consideration of the metadata of the observation stations.
World Meteorological Organisation (WMO) standards for the placement of anemometers are followed for most of the AWS sites, requiring an open, level terrain, with the measurement taken at 10 m above ground level. An open terrain is defined as the distance to any obstruction being at least 10 times the height of the obstruction. More severe requirements are set for the surrounding surface roughness for the reference site conditions for strong winds. This necessitated a survey to establish the exposure of the sites. The survey was of a desktop nature, using predominantly Google Earth information, with limited verification by local weather offices. Based on a set of criteria, the AWS sites were assessed in terms of conforming to Terrain Category II (TC-II) with a roughness length of 0.05 m. After the assessment, 76 stations with adequate exposure remained from an initial 94. The Exposure Correction Factor (ECF) (Wever & Groen 2009) due to improper terrain categories was estimated for 22.5° sectors for the remaining locations. The ECF is applied to convert the observed wind speed from the corresponding direction to the wind speed for TC-II.
For observations of gusts from synoptic mechanisms, adjustments were made for 41 sites, whilst no adjustments were applied for thunderstorm gusts, in accordance with the guideline of ISO 4354:2009 that thunderstorm winds are not sensitive to site conditions, at least for TC-I to TC-III.
Data extraction and analysis
Strong wind climatology data
Goliger and Retief (2002) provided an indication of the regional contribution of the main strong wind mechanisms. Consideration of the regional distribution of prevailing macroclimatic conditions, with emphasis on seasonal changes and the differentiation between synoptic and mesoscale conditions were presented by Kruger et al (2010). A quantitative assessment of the strong wind climate was subsequently conducted by Kruger et al (2011a & b).
Measured strong wind data
Since 1995 the SAWS have been archiving high resolution weather measurements from AWSs in 5-minute intervals, which served as the main source of data for the investigation. The sources of annual maximum wind gusts were identified with this data, together with evidence of the prevailing weather systems, e.g. synoptic charts published in the SAWS Daily Weather Bulletin (SAWS 1992-2008).
The wind observations extracted from the SAWS climate data bank consisted of the maximum wind speed values for a given period (year), or the values over a given threshold, required for the application of the different strong wind estimation methods employed.
Extreme value statistical analysis methods
Two issues need consideration when selecting the appropriate extreme value statistical analysis:
■ The short observation periods of the AWS network, which was deployed since the early 1990s
■ The mixed strong wind conditions consisting of various combinations of thunderstorms and several typical synoptic conditions which are pervasive over the country
A full discussion of the consideration and application of the different statistical analysis methods can be found in Kruger et al (2013) (see page 29 in this volume). The basic extreme value method initially considered was the fitting of the Generalised Extreme Value (GEV) model (Jenkinson 1955), but also restricting the skewness of the distribution to zero, which then simplifies to the Gumbel distribution. For mixed climate distributions, the method developed by Gomes & Vickery (1978) was employed.
For time series shorter than 20 years it is preferable that analysis methods such as the Peak-Over-Threshold (POT) method are used (Palutikof et al 1999), but in a mixed strong wind climate, a mixed climate approach should be adopted, especially due to the relatively higher quantile values obtained. The Generalised Pareto Distribution (GPD) was fitted to the data series, which simplifies to the Exponential distribution (EXP) with the skewness of the distribution set to zero.
Development of quantile maps
The selection of AWS records that comply with stringent requirements for use in strong wind statistical analysis is described in Kruger et al (2011a). Of the 209 AWSs currently operational, 76 qualified for the analysis. This is about a five-fold increase in the number of stations and a three-fold in station years, compared to the data set of the previous analysis. This represents a significant improvement of the spatial distribution enhancing the capturing of the climatic diversity of South Africa, but a reduction of recording length, which compromises the prediction of wind velocities for long return periods.
Statistical estimation methods and selected quantiles
The choice of the best approach to statistically estimate strong wind values ultimately depend on the following factors:
■ The period of record
■ The averaging period of the measured wind speed values
■ The strong wind producing mechanisms involved
■ The temporal spacing of the strong wind values to be utilised
Of these factors the period of record seemed to be the most critical in the selection of an appropriate statistical approach. Due to the fact that the data series of all the weather stations were between 10 and 20 years' duration, approaches based on the annual maximum wind speed values were compromised. This was shown to be especially true for the GEV distribution, where the values of the shape parameter were not restricted to zero as is the case with the Gumbel distribution. It was found that non-zero skewness cannot be reliably considered when short time series are analysed, and that a better alternative is to use the Gumbel method. Even with the POT approach, where it was possible to use many more strong wind values, similar dubious values were sometimes obtained when the GPD distribution was fitted. More realistic results were obtained with the EXP distribution, where the skewness of the distribution is assumed to be zero.
Regarding the different averaging periods of the wind data series, it was found that the POT approach is not compatible with the hourly mean wind speeds, due to temporal clustering of strong wind values. Therefore only annual maximum methods could be used in estimating strong hourly mean wind speeds, while both the annual maximum and POT approaches were compatible with the estimation of the strong 2-3 second wind gusts.
Where there is more than one strong wind producing mechanism involved in producing annual maximum winds, which is the case for a large part of South Africa (Kruger et al 2010), it is advisable to use a mixed distribution approach.
The temporal spacing of strong wind values has a bearing on the number of data values that can be utilised in the POT method. In time series where many consecutive values were relatively high, an unacceptably high percentage of strong wind values were statistically dependent, even when a very high threshold value was selected. For some weather stations the POT method could not be applied due to this effect. The optimum statistical method to estimate strong wind values was therefore selected on a station-by-station basis, taking all of the above factors into account.
The following are the selection criteria for the most realistic, but also conservative, strong wind values for the maps of the hourly mean and gust wind speed values with a 50 year return period (the 50 year quantile wind speed):
■ For hourly mean wind speeds the results from the Gumbel distribution were used, except where the strong winds were forthcoming from more than one strong wind producing mechanism. Then the results from the mixed distribution method were used.
■ For wind gusts a choice had to be made between the results of the Gumbel, mixed distribution, and the POT with EXP methods. Where strong gusts were forthcoming only from one strong wind producing mechanism, results from the POT with EXP or Gumbel methods could be used. In cases of more than one strong wind producing mechanism, the estimated values of the mixed distribution and EXP methods could be selected. For conservativeness, where a choice had to be made between the results of different methodologies (e.g. Gumbel and POT), the higher quantile value was selected.
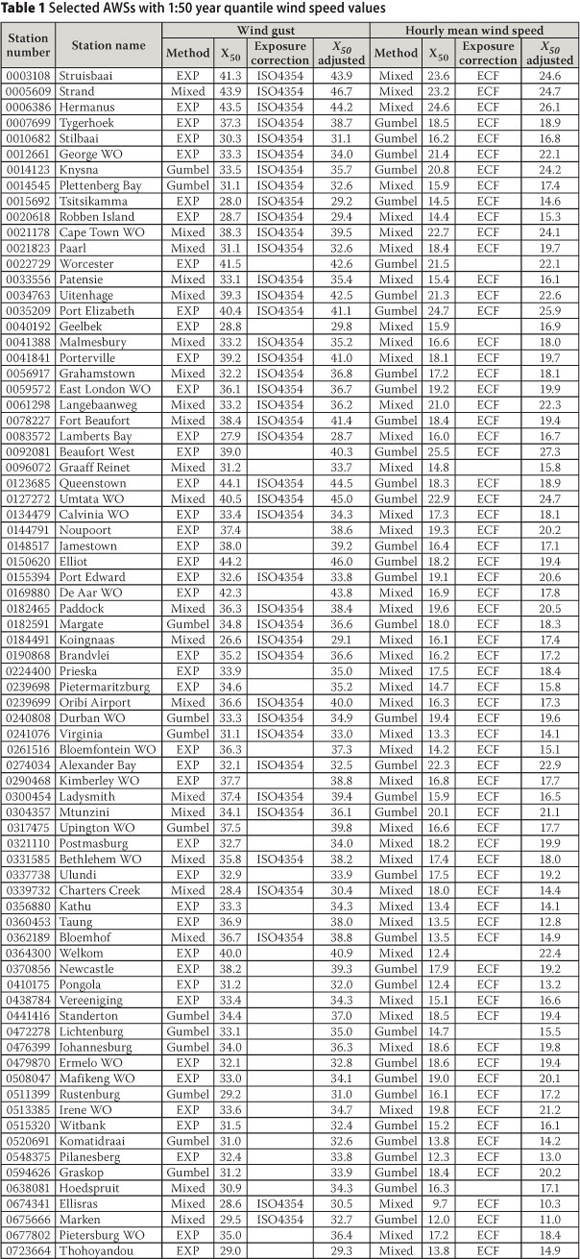
Table 1 presents the list of 76 weather stations that were utilised for the development of the 1:50 year maps. Also presented are the selected statistical methods for the estimation of the strong wind values, i.e. the 1:50 year wind gust and hourly mean wind speed quantiles, and the nature of exposure corrections where applicable.
SPATIAL INTERPOLATION OF 1:50 YEAR QUANTILES
In the development of maps of strong wind speeds, it is essential that some objective method be applied to spatially interpolate the strong wind data. This basically implies the estimation of the strong wind values at places where no wind measurements were made. For South Africa this means that these interpolations should in many cases be done over long distances, and most often over heterogeneous terrain.
Hourly mean wind speed
Statistical relationship between quantile values
Several strong wind analyses use the height above sea level of the weather stations to interpolate the quantile values between the weather stations, which will then assist in the drawing of lines of equal quantiles on a map (e.g. Ballio et al 1999). The assumption over the region of concern will generally be that, because the wind speed increases with height, ignoring other factors, the same applies to the strong wind speeds. The relationship between height above sea level and the strong wind speed is then assumed to be linear. However, it is argued that such a simple association between wind speed and height can only be made for an area with a homogeneous strong wind climate and a simple topography, which is not the case for South Africa. The test for a possible linear relationship between height above sea level and the 50 year quantile of hourly mean wind speed seemed to indicate a negative correlation (although not statistically significant at the 5% level). This result suggested that if the whole area of South Africa is taken into consideration, the wind speeds tend to be stronger at lower elevations. This apparent negative relationship between height above sea level and the 50 year quantile of hourly mean wind speed is due to stronger winds in the coastal regions, which are subject to a different strong wind regime than the interior.
Inspecting the quantile data in Table 1 it is apparent that there is a tendency for the quantiles to be stronger in the south than in the north. Figure 1 presents the relationship between the latitude of the weather station and the 50 year quantile of the hourly mean wind speed, which renders a positive correlation that is statistically significant at the 5% level.
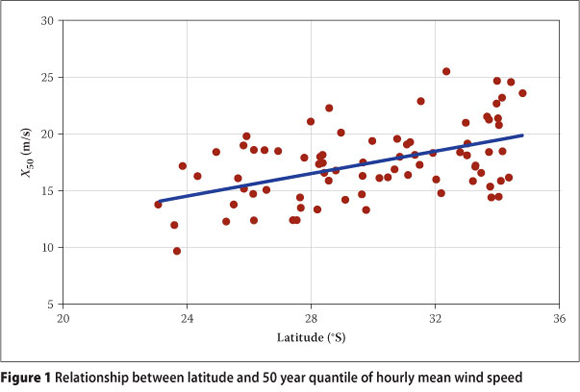
It is therefore clear that, although it is often assumed that there is a relationship between the height above sea level and the strong wind quantiles, it cannot be generalised for South Africa taken as a whole. There is also a general tendency for strong wind quantiles to be higher in the south. The relationships between strong wind quantiles were therefore investigated on regional bases. In their study of strong winds in Italy, Ballio et al (1999) subdivided the weather stations into two classes - the weather stations near sea level (close to the coast) and those at higher altitudes (interior). These two classes were then subdivided further into areas or regions, where the 10-minute wind speed quantiles showed similar magnitudes and/ or characteristics. Different inland areas or zones were characterised by different slopes of increase of the 10-minute wind speed quantiles with the height above sea level.
A similar exercise was conducted for South Africa, to demarcate the country into zones of similar characteristics of the maximum hourly mean wind quantiles, according to the relationships between the height above sea level and the 50 year hourly mean wind speed quantile. These zones would then exhibit unique slopes of increase in the quantile wind speeds with height above sea level. To formalise the process, the zones had to fulfil the following criteria:
■ A linear relationship between heights above sea level and the 50 year hourly mean wind speed quantiles should exist, which is statistically significant at the 5% level.
■ The region should, as far as possible, be spatially coherent.
■ The weather stations within a region should have the same causes of strong hourly mean wind speeds.
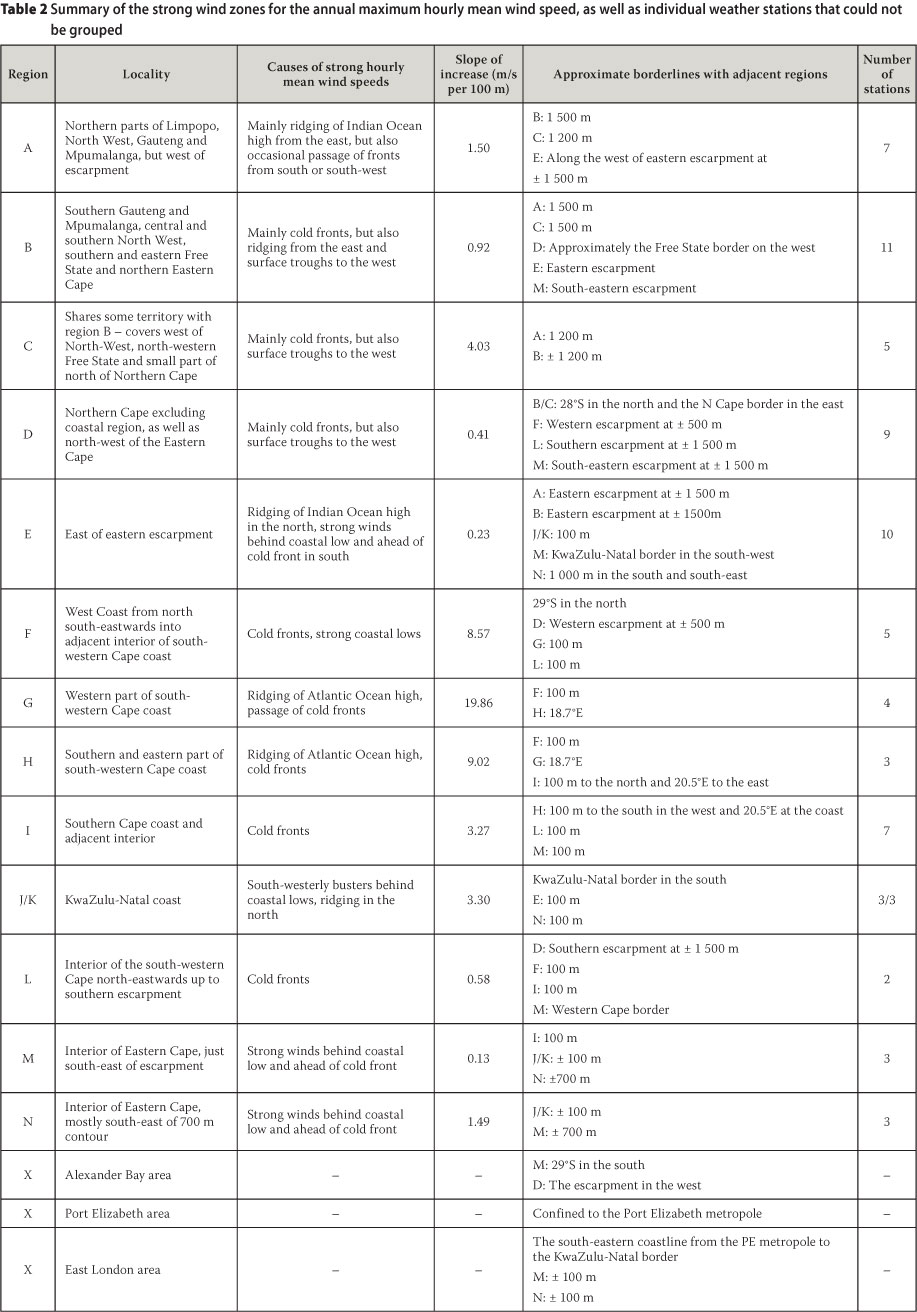
Almost all of the weather stations could be grouped according to their relationships between the 50 year maximum hourly mean wind speed and the height above sea level. The analyses of the weather station into groups A to N (mostly according to their proximity to each other) are presented in Figure 2, from which the clear gap between the quantile/height relationships close to the coast and those in the interior is noticeable. Different slopes of increase of quantiles with height are apparent, with very steep trends observed for the regions close to the coast in contrast to those in the interior. Four weather stations could not be fitted into this scheme, namely Alexander Bay, Port Elizabeth, East London and Johannesburg Botanical Gardens; and the latter station was deleted due to its anomalous nature.
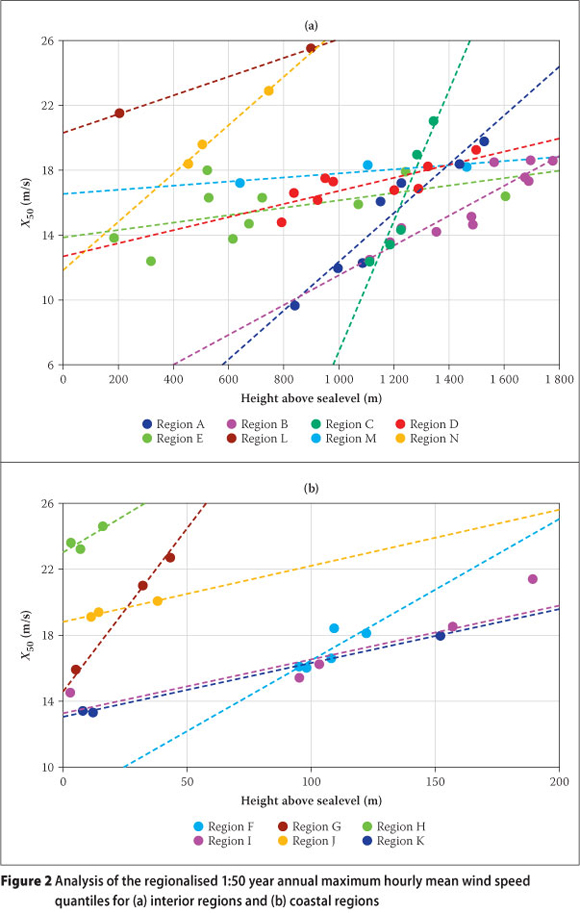
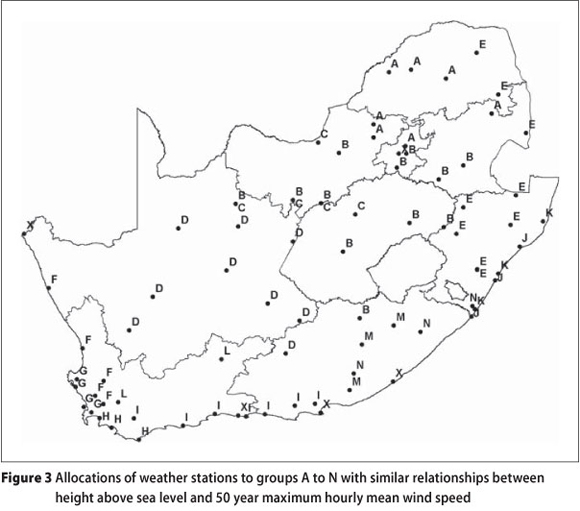
The positions of the weather stations, showing their allocations to groups A to N, as well as the individual unallocated weather stations, which are indicated with X, are presented in Figure 3. Through close inspection of Figures 2 and 3, the groups and the individual station areas could be summarised as in Table 2. It is recognised that the grouping of the weather stations in this manner is liable to some amount of subjectivity. However, this method was still deemed to be the most reasonable method in the interpolation of the quantile values, as the only information available were the quantile values estimated from measured values.
Mapping of quantile wind speed values
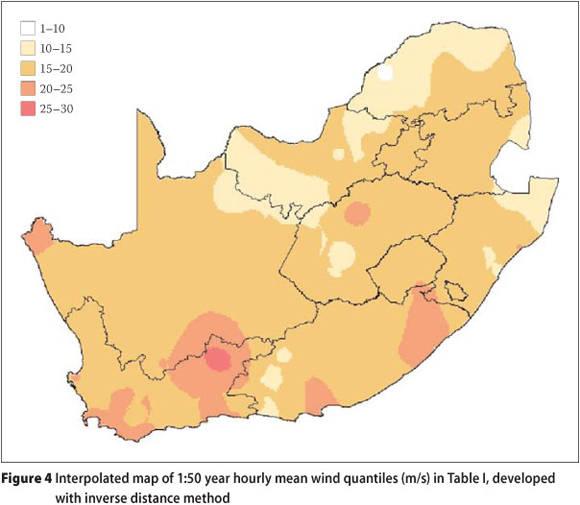
Figure 4 presents a mechanistically interpolated map of the 1:50 year hourly mean wind quantiles presented in Table 1, developed with the inverse distance method contained in the GIS Spatial Analyst software. From the map one can notice the general tendency, with some exceptions, of quantiles to be stronger in the south and weaker in the north. Due to the mathematical method of interpolation, the spatial distribution of data points, and the fact that the topography is not taken into consideration, the isolines on the map in many cases do not make physical sense. This illustrates that the approach of simple interpolation of the quantile values is not the ideal approach in the development of quantile maps.
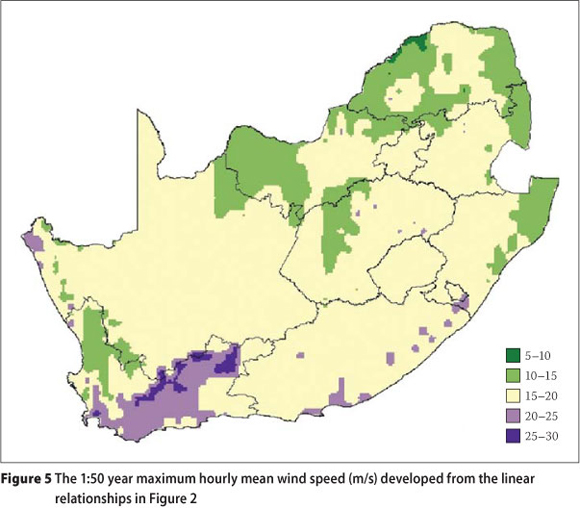
A 15' x 15' resolution grid of the height above sea level was developed with the aid of GIS and Google Earth, and used to estimate the 1:50 year maximum hourly mean wind speed at the grid points based on the respective zones and the linear relationship between elevation and wind speed. The resultant contour map for the 1:50 year hourly mean wind speed is presented in Figure 5, in 5 m/s increments.
This map gives a more realistic picture of the spatial distribution of the quantile values than the map presented in Figure 4. Some of the most important differences between the maps in Figures 4 and 5 are:
■ Areas in the 25-30 m/s category are spread along the south of the escarpment in the Western Cape, instead of only the small circular area around Beaufort West.
■ The 20-25 m/s category in the south is confined to the south of the escarpment, and covers a greater portion of the Western Cape Province, while it is smaller and stretches over the escarpment to the north.
■ The metropolitan area of Cape Town mostly falls into the 20-25 m/s category, with a small area of 25-30 m/s just west of the Somerset West region, and 15-20 m/s from Hout Bay northwards along the coast across the Cape Town CBD. In Figure 4 the whole metropole falls into the 20-25 m/s category.
Strong wind gust values
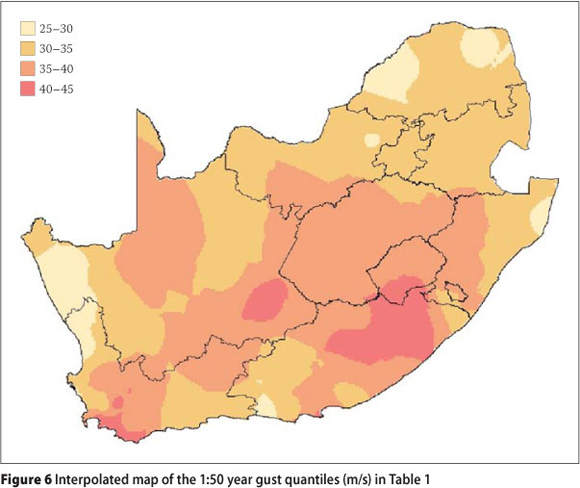
The 1:50 year wind gust values presented in Table 1 were used to compile Figure 6 using inverse distance interpolation, without provision for topography or any other physical influences. The origins of strong wind gusts, especially those forthcoming from thunderstorms, are usually very local in origin. Therefore elevation cannot be considered as a means of interpolation for gust wind. Differences in the geographical distribution of high values of gust and hourly mean wind speed are noticeable when Figure 6 is compared to Figures 4 and 5.
Ratio between gust- and hourly mean quantiles
The ratio between the gust quantiles and the hourly mean wind speed quantiles, which could be referred to as the Quantile Gust Ratio, will be dependent on the most probable causes of the strong wind gusts in a particular region, whether of thunderstorm or synoptic origin. These ratios, between the 1:50 year gust quantiles and the 1:50 year hourly mean wind quantiles from Table 1, are presented in the interpolated map in Figure 7.
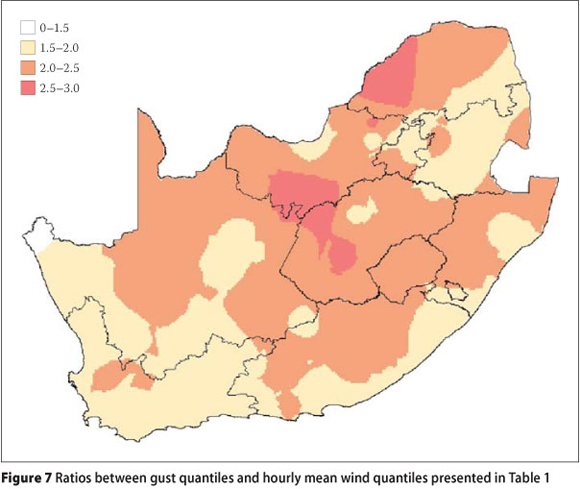
The most noteworthy characteristics of the ratios depicted on the map are the following:
■ Low ratios are evident in the west and south and further along the coast in the east. The strong mean winds and gusts are both produced by cold fronts, which are characterised by relatively well-correlated flow. Most gust and hourly mean values are derived from the same events.
■ Strong hourly mean wind speeds in the north-east, specifically the Mpumalanga Province and parts of the Limpopo and Gauteng Provinces, are produced by the synoptic-scale systems, while the strongest gusts are usually produced by thunderstorms. However, these are in general not as strong as elsewhere in the country, with the effect that the ratios here are relatively low for the interior.
■ The highest ratios are found in parts of the interior of the country where the strong hourly mean wind speeds are produced by synoptic-scale systems, although the strengths of these systems have usually diminished somewhat. Intense thunderstorms are, however, possible over parts of this region, which can produce very strong wind gusts. This is not reflected by averaged data over large periods.
Mapping of quantile values
By combining the hourly mean values reflecting the effect of elevation shown in Figure 5 with the Quantile Gust Ratio values shown in Figure 7, estimates of 1:50 year quantile gust speed values with improved resolution could be obtained, as shown in Figure 8, albeit in an indirect manner. Such improved resolution, however, derives more from the hourly mean baseline than from the Quantile Gust Ratio.
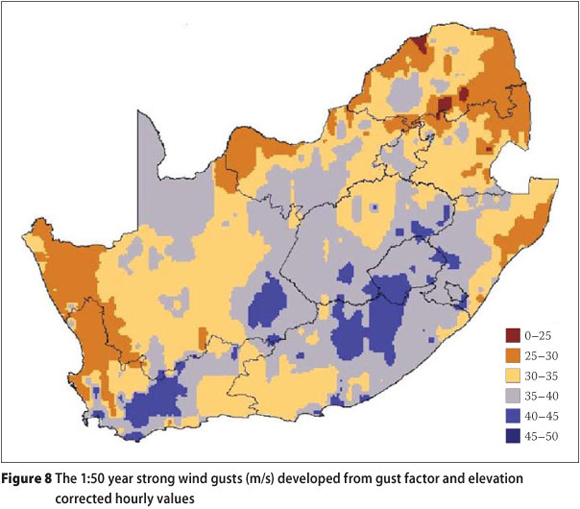
The following observations can be made from a comparison of Figures 6 and 8:
■ The highest gust winds indicated in Figure 8 are higher than those based on direct interpolation (Figure 6).
■ The area in the Western Cape which falls in the 40-45 m/s category is much larger than in Figure 6, and coincides with the area of highest hourly mean wind quantiles. Some isolated areas in the Free State and KwaZulu-Natal also fall into this category, while it is not the case in Figure 6. In the Eastern Cape this category is mostly confined to the interior, while it stretches all the way to the coast in Figure 6.
■ The 35-40 m/s category covers larger areas in the north in Figure 8.
■ The gust wind for the Cape Town metropolitan area falls mostly in the 35-40 m/s interval, but a higher interval of 40-45 m/s applies to a small area to the west of the town of Somerset West. An even higher interval of 45-50 m/s exists, but for very small and isolated localities in the last mentioned area, and also around the Cape Point area. Around Durban most of the area close to the coast falls in the 35-40 m/s interval, while Figure 6 shows the whole metropole to fall into the 30-35 m/s interval.
■ In Gauteng the southern part (mostly Johannesburg) falls in the 35-40 m/s interval, while the north (mostly Pretoria) falls in the 30-35 m/s interval. In Figure 6 the whole metropole falls in the 30-35 m/s interval.
It is acknowledged here that, because the ratio values used in the development of the map in Figure 8 are not based on any physical model, there would be areas which show possible unrealistic quantile patterns. Some of these areas are:
■ The isolated areas in the north, which fall within the 0-25 m/s interval, due to their low elevations.
■ The almost abrupt change from the 35-40 m/s to the 25-30 m/s interval to the west of the North West Province.
■ Some of the very high quantile values shown along the escarpment in the east and south-east might not necessarily be realistic, and could only be a result of the very high elevations used in their estimations.
Apart from the above possibly unrealistic patterns, there could perhaps be more of such which could be detected by closer inspection. Notwithstanding these shortcomings, it is argued that the map can still fulfil the purpose of providing a general impression of the areas of higher and lower quantile values.
DESIGN WIND SPEED MAPS
Requirements
Arguably the most important characteristics that design wind speed maps should comply with are the conservativeness of the quantile values, and an overall simplicity of the contours for ease of reference.
Adjustments for uncertainties of quantile values
Uncertainties of the estimated values of the strong wind quantiles mainly revolve around the estimated values of the parameters of the strong wind distributions fitted to the observed wind data. These uncertainties, in turn, are due to the uncertainties in whether the sample of values used in the calculation of the distribution parameters is representative of the population. Regarding conservativeness, it is important that the estimated design values should rather err on the higher than on the lower side.
Adjustments were made to the estimates of the mean and standard deviation as calculated from the sample of n observations. This was done by considering the 75% confidence limit values of the sample mean and variance, which is accepted practice for reliability based probability modelling (EN 1990:2002). After the adjustments, the parameters for the Gumbel distribution were recalculated, and the adjusted 1:50 year quantiles determined. This procedure was applied to both the Gumbel and mixed distribution methods.
For the cases where the POT method with the EXP approach was selected, as indicated in Table 1, the only distribution parameter is α, which is simply the mean of the exceedance of the threshold value of the values in the sample utilised. Therefore the value of α was adjusted by the addition of the 75% confidence limit.
Apart from the original values, Table 1 also presents the adjusted values of the 1:50 year quantiles of the annual maximum wind gusts and the annual maximum hourly mean wind speeds, to be utilised in the development of the final proposed design wind speed maps.
Effects of mixed strong wind climate
South Africa was zoned into geographical regions which indicate the most likely sources of strong winds, particularly the annual maxima of the 2-3 second wind gusts (Kruger et al 2010). Subsequently strong winds were characterised according to cluster analysis performed on the parameters of the Gumbel distributions of the different strong wind mechanisms (Kruger et al 2012). The cluster analysis provides information of the regional distribution of classes of strong wind mechanisms, presented in the form of a set of maps. Average values of extreme value distribution parameters were also obtained in the process. Of particular significance is that regions of high strong winds and mixed climates could be identified.
Compilation of design wind speed maps
The adjusted quantile values listed in Table 1 were used as the basis to draw updated gust and hourly mean wind speed maps. In addition, the maps presented in Figures 5 and 8 were used as guidelines to indicate regions of relatively higher and lower quantile values, but noting that these maps were not adjusted for small record periods (n). In addition the assessment and integration of the strong wind estimations were taken into account, particularly for those regions where relatively high quantiles are predicted with cluster analysis.
Apart from the establishment of regions of relatively higher and lower quantiles, the interval of the contours was also considered. Milford (1985 a & b) used 5 m/s intervals for both the hourly mean wind speed map and the gust map. In these maps the areas of equal quantile values were simplified, apparently because of the low data resolution, making it impossible to confidently identify areas of higher or lower quantiles according to physical considerations, e.g. topography and prevalent strong wind mechanisms.
Although Figures 5 and 8 were resolved to a higher resolution by taking topography into account, it was concluded that intervals less than 5 m/s were not justified due to the measure of subjectivity embedded in the process of combining various sets of information into the mapping process. Maps with resolutions higher than 5 m/s created isolated areas of very high or low quantile values, of which the cause could not always be derived. Another factor taken into consideration was the requirement of simplicity of the contours, for subsequent ease of reference.
Figure 9 presents the proposed 1:50 year maximum wind gust map. Some noteworthy features of the map are:
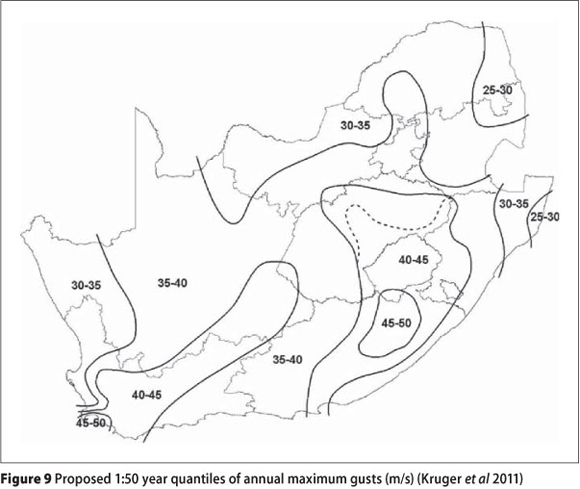
■ The general decrease in quantile values from south to north.
■ An area of relatively high values in the north of the Eastern Cape province, due to very strong thunderstorms that occur there from time to time.
■ The close spacing of the contours in the Cape Peninsula, due to the complex topography.
■ The extension of the 40-45 m/s region incorporating the eastern Free State up to North West Province, to include the regions of relatively strong thunderstorm gusts identified with cluster analysis (Kruger et al 2012). Without this extension the 40-45 m/s region will follow more or less the dashed lines depicted on the map.
■ Two linear features in a SW-NE direction, from the south-western Cape through to Limpopo Province. These patterns in the map do not coincide with a single topographical feature, neither with patterns caused by a specific strong wind mechanism (thunderstorms dominate in the north and cold fronts in the south). This feature is therefore attributed to the coincidence of prominent topographical features and high gust factors across the country.
Figure 10 presents the proposed 1:50 year maximum hourly mean wind speed map. Some noteworthy features of the map are:
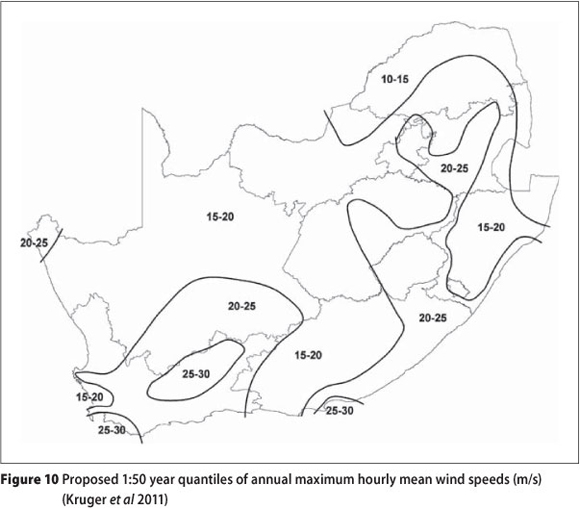
■ As is the case with the gust map, a general decrease in quantile values from south to north.
■ Areas of highest quantiles are the southern part of the Cape Peninsula westwards to include the southern part of the Overberg region, the coast and adjacent interior around Algoa Bay, and an area in the southern interior from the eastern side of the Hex River mountains up to Beaufort West.
ASSESSMENT OF PREVIOUS STRONG WIND ESTIMATES
It is important to make a comparison between the design wind speed maps created in the current research with those developed in the analysis of Milford (1985 a & b), which essentially form the basis of the design wind speeds of the current structural design standard (SANS 10160-3:2011) as transferred from the previous standard (SABS 10160:1989). Differences in the maps developed in both studies are to be expected, due to differences in instrumentation, the related data storage and processing technologies, as well as the analysis methods.
Comparison of design wind speed maps
The differences between the present wind speed maps and those developed in the previous analysis are reported by Kruger et al (2011b) - see Figures 11 and 12. The main feature of these comparisons is that both the gust and hourly mean 50 year quantile wind speed values are generally lower across large parts of the country, while they are the same or higher mostly over isolated patches. The exception is that the hourly mean is generally the same over the northern parts of the country and higher for most of Gauteng and the southern and eastern parts of Mpumalanga over an extended patch. Higher wind gust values for the Cape Peninsula region and parts close to the north-eastern border of the Eastern Cape should be noted.
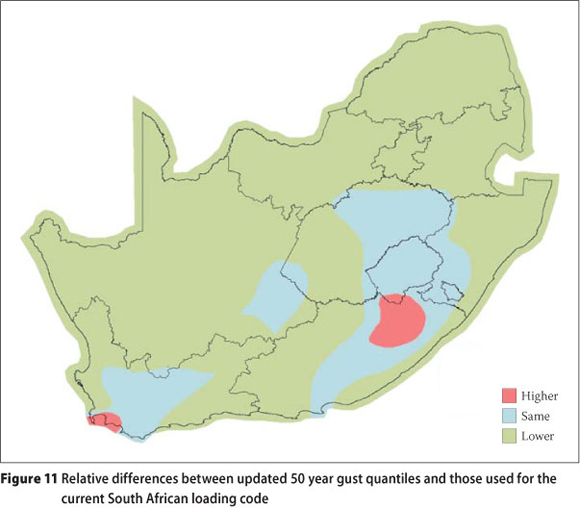
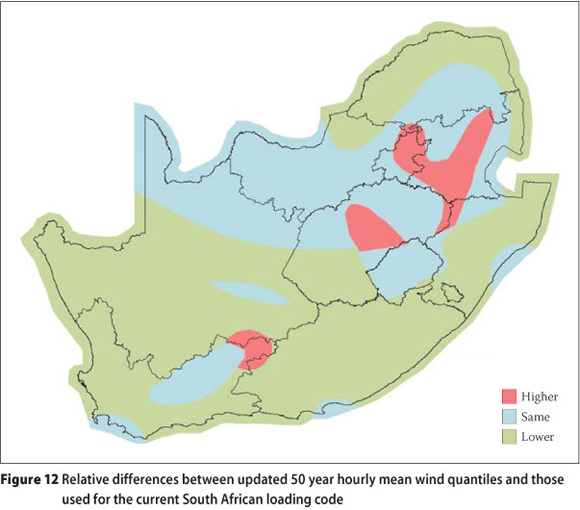
The pattern of the match between the new and previous wind maps derives largely from differences in the number of observations on which the respective maps are based. Since the previous maps were based on only 14 observation stations, the wind speed contours are smoothed almost at a sub-continental scale, whereas the 75 stations of the present maps allow for detail even on a local scale in some regions.
The comparison can therefore be characterised that the new results indicate generally that wind speed values are lower than what had been obtained previously, although higher values are obtained locally, mainly due to the improved resolution achieved for the present analysis.
Use of previous data set
The most important role that the previous analysis could play is to extend the recording period for the relevant weather stations, thereby rectifying one of the most important deficiencies of the AWS data set. The recording period for the stations used by Milford (1985 a & b) ranged from 13 years for Bloemfontein (Tempe) to 43 years for Kimberley, with an average of 26 years for the total of 15 Dines anemograph stations. The period for the 75 AWS records range from 10 to 19 years. From a careful assessment of the Dines data set it was concluded that this information could not be used for a combined record for the 15 stations, a subset or even individual stations. The reasons for this significant conclusion are the following:
■ The quality of the Dines measurements and data capturing process could not be scrutinised to the same level as was done for the AWS records. The technology on which the process was based indicated that some biases and errors could be expected. This is in contrast to the fact that a significant fraction of AWS records were rejected on the basis of failing to meet stringent quality conditions.
■ The Dines weather stations did not comply with standards for strong wind observations. In some cases critical information was not recorded. Although most of the stations were located at airports, complying generally with exposure conditions, their exact locations and local conditions were not recorded.
■ There are significant indications of systematic differences between Dines and AWS data for individual stations, but not showing consistent trends across the set.
CONCLUSIONS AND RECOMMENDATIONS
The extensive AWS network that has been deployed by the South African Weather Service since the early 1990s, and which is presently still being extended, provides an opportunity for a thorough reassessment of the strong wind climate of the country with a view to implementation in the design of structures and the built environment. The results of the analysis of the AWS data set in order to characterise the strong wind climate of the country are based not only on the statistical analysis of the data extracted from the records, but also on an investigation of the associated strong wind generating mechanisms. The approach followed contributed to an improved understanding of the complexity of the strong wind climate of the region. More tangible, however, is the fact that this information could be used to select the appropriate statistical techniques for the analysis of the data and the interpretation of the results.
Main changes in strong wind maps
The strong wind maps used in the new standard for wind actions on structures SANS 10160-3:2011 transferred the previous maps from SABS 10160:1989 with only some nominal modifications to represent the South African wind climate input. Differences are therefore important with regard to potential adjustments to such input.
From Figures 11 and 12 it is clear that strong wind velocities predicted by the new analysis are generally lower across large parts of the country for both gust winds, which are predominantly used in the design procedures, as well as for the hourly mean velocities which are relevant where wind and structure interaction needs to be taken into account.
Higher strong wind velocities were, however, obtained for relatively small but significant areas. Although the geographical distribution of these areas is mostly an artefact of the differences in the resolution of the respective new and previous strong wind maps, these localities are nevertheless important since they overlap with concentration of population and/or economic activity.
Characterisation of strong wind climate
The complexity of the strong wind climate of South Africa is reflected by the intricate pattern of the strong wind maps (see Figures 9 and 10) in spite of the fact that a coarse range of wind speed intervals is used. One pertinent feature of the complexity of the strong wind climate of the region is the relative importance of the two main strong wind mechanisms, namely mesoscale thunderstorms and synoptic scale frontal systems.
This varying interplay between different strong wind mechanisms is particularly significant due to the effect of mixed strong wind climatic conditions on the statistical treatment of the data and the subsequent prediction of long return period quantile values.
The complexity of the strong wind climate is also reflected in the geographical distribution of the gust factor, expressed as the ratio between gust and hourly mean 50 year quantile wind velocities (see Figure 7). This gust ratio distribution is also of significance with regard to the SANS 10160-3:2011 design procedures where it is used to convert the Eurocode procedures which are based on synoptic wind conditions to South African conditions (Goliger et al 2009b).
These results verified the initial premise of the investigation that the statistical treatment of strong wind observations needs to be complemented by a thorough analysis of not only climatic conditions in general, but also the specific strong wind generating mechanisms and the relationship with the observations.
Recommendations on future activities
The primary motivation and objective of this investigation was to characterise the South African strong wind climate to provide input for the design of the built environment. The results of the investigation as reported here clearly justify consideration for incorporation into design procedures in an appropriate manner. Complementary information on the parameters of the statistical models on which the results are based are beyond the scope of this paper, but should also be considered in such an exercise.
The most significant deficiency of the investigation is the relatively short period of observations. It is therefore imperative that the investigation is updated periodically, not only to capture additional observations for the stations reported here, but also existing (and future) AWS measurements with records passing the threshold of 10 years of observation.
The specific needs for the observation of strong winds for the purpose of its application to the built environment were made clear by this investigation. Particular issues include the requirement for standard exposure conditions at AWS sites and the coverage of the network to properly capture strong winds from meso-scale thunderstorms or areas with complex conditions.
REFERENCES
Ballio, G, Lagomarsino, S, Piccardo, G & Solari, G 1999. Probabilistic analysis of Italian extreme winds: Reference velocity and return criterion. Wind & Structures, 2: 51-68. [ Links ]
EN 1990:2002. Eurocode: Basis of Structural Design. Brussels: European Committee for Standardisation (CEN). [ Links ]
EN 1991-1-4:2005. Eurocode 1: Actions on Structures. Parts 1-4: General Actions - Wind Actions. Brussels: European Committee for Standardisation (CEN). [ Links ]
Goliger, A M & Retief, J V 2002. Identification of zones of strong wind events in South Africa. Journal of Wind Engineering & Industrial Aerodynamics, 90: 1227-1235. [ Links ]
Goliger, A M, Retief, J V & Dunaiski, P E 2009a. Review of codification of wind-loading for structural design. Chapter 3-1 in Retief, J V & Dunaiski, P E (Eds), Background to SANS 10160. Stellenbosch: SunMedia. [ Links ]
Goliger, A M, Retief, J V, Dunaiski, P E & Kruger, A C 2009b. Revised wind-loading design procedures for SANS 10160. Chapter 3-2 in Retief, J V & Dunaiski, P E (Eds), Background to SANS 10160. Stellenbosch: SunMedia. [ Links ]
Gomes, L & Vickery, B J 1978. Extreme wind speeds in mixed wind climates. Journal of Industrial Aerodynamics, 2: 331-344. [ Links ]
ISO4354:2009. Wind Actions on Structures. Geneva: International Standards Organization. [ Links ]
Jenkinson, A F 1955. The frequency distribution of the annual maximum (or minimum) values of meteorological elements. Quarterly Journal of the Royal Meteorological Society, 81: 158-171. [ Links ]
Kruger, A C, Retief, J V & Goliger, A M 2011a. An updated description of the strong-wind climate of South Africa. Proceedings, 13th International Conference on Wind Engineering, 9-11 July 2011, Amsterdam. [ Links ]
Kruger, A C, Goliger, A M & Retief J V 2011b. Integration and implications of strong-wind producing mechanisms in South Africa. Proceedings, 13th International Conference on Wind Engineering, 9-11 July 2011, Amsterdam. [ Links ]
Kruger, A C, Goliger, A M, Retief, J V & Sekele, S 2010. Strong wind climatic zones in South Africa. Wind & Structures, 13(1): 37-55. [ Links ]
Kruger, A C, Goliger, A M, Retief, J V & Sekele, S S 2012. Clustering of extreme winds in the mixed climate of South Africa. Wind & Structures, 15(2): 87-109. [ Links ]
Kruger, A C, Retief, J V & Goliger, A M 2013. Strong winds in South Africa: I. Application of estimation methods. Journal of SAICE, 55(2): 29-45. [ Links ]
Milford, R V 1985a. Extreme-value analysis of South African mean hourly wind speed data. Unpublished Internal Report 85/1, Pretoria: Structural and Geotechnical Engineering Division, National Building Research Institute, CSIR. [ Links ]
Milford, R V 1985b. Extreme value analysis of South African gust speed data. Unpublished Internal Report 85/4, Pretoria: Structural and Geotechnical Engineering Division, National Building Research Institute, CSIR. [ Links ]
Palutikof, J P, Brabson, B B, Lister, D H & Adcock, S T 1999. A review of methods to calculate extreme wind speeds. Meteorological Applications, 6: 119-132. [ Links ]
SABS 10160:1989. The General Procedures and Loadings to be Adopted in the Design of Buildings. Pretoria: South African Bureau of Standards. [ Links ]
SANS 2011. SANS 10160-3:2011. South African National Standard. Basis of Structural Design and Actions for Buildings and Industrial Structures. Part 3 Wind Actions. Pretoria: South African Bureau of Standards. [ Links ]
SAWS (South African Weather Service) 1992-2008. Daily Weather Bulletin. Pretoria: SAWS. [ Links ]
Wever, N & Groen, G 2009. Improving potential wind for extreme wind statistics. KNMI Scientific Report - Wetenschappelijk Rapport: WR 2009-02. De Bilt, Netherlands: KNMI (Royal Netherlands Meteorological Institute). [ Links ]
 Contact details:
Andries Kruger
Climate Service
South African Weather Service
Private Bag X097
Pretoria, 0001
T: +27 12 367 6074
F: +27 12 367 6175
E: andries.kruger@weathersa.co.za
Contact details:
Johan Retief
Department of Civil Engineering
University of Stellenbosch
Private Bag X1, Matieland
Stellenbosch, 7602
T: +27 21 808 4442
F: +27 21 808 4947
E: jvr@sun.ac.za
Contact details:
Adam Goliger
CSIR Built Environment
PO Box 395
Pretoria, 0001
T: +27 12 841 2472
F: +27 12 841 2539
E: agoliger@csir.co.za

DR ANDRIES KRUGER obtained his MSc degree from the University of Cape Town in the Geographical and Environmental Sciences, and his PhD from the University of Stellenbosch in Civil Engineering, with research topic "Wind Climatology and Statistics of South Africa relevant to the Design of the Built Environment". Since 1985 he has been involved in the observation, analysis and research of historical climate at the South African Weather Service. This included climate change and variability research, the authoring of general climate publications, and other climatological studies through consultation. He is the author or co-author of a substantial number of scientific publications.

PROF JOHAN RETIEF, who is a Fellow of the South African Institution of Civil Engineering, obtained his first degree in Civil Engineering from Pretoria University, MPhil from London University, Engineer from Stanford, and DScEng again from Pretoria University. He joined Stellenbosch University after many years at the Atomic Energy Corporation. Since retirement he is still involved in supervision of graduate students and is involved nationally and internationally in standards development.

DR ADAM GOLIGER obtained his MSc degree from Warsaw Technical University and his PhD from Stellenbosch University, both in Structural Engineering. Since 1985 he has been involved in research and consulting work at the CSIR. This included wind-tunnel simulation and modelling techniques, wind damage and environmental studies around buildings. For several years he served as the South African representative on the International Association for Wind Engineering (IAWE) and participated in various local and international committees. He is the author or co-author of more than 80 scientific publications and various technical reports.

