


Servicios Personalizados
Articulo
 Inglés (pdf)
 Articulo en XML
 Referencias del artículo
Indicadores

Links relacionados
-
 Citado por Google
 -
 Similares en Google
Compartir

 Permalink
Journal of the South African Institution of Civil Engineering
versión On-line ISSN 2309-8775
versión impresa ISSN 1021-2019
J. S. Afr. Inst. Civ. Eng. vol.55 no.1 Midrand abr. 2013
TECHNICAL PAPER
Centrifuge modelling of a soil nail retaining wall
S W Jacobsz
ABSTRACT
This paper describes a physical model of a soil nail retained excavation face which was tested in the new geotechnical centrifuge at the University of Pretoria. As centrifuge modelling is new in South Africa, a short introduction to this technique is presented.
The mobilisation of soil nail forces and their maximum values in response to excavation in the model were compared to measurements recently made in an instrumented 10 m high soil nail retaining structure for the Gautrain system in Pretoria. Results were also compared to predictions made using a simple failure wedge analysis and a database of eleven full-scale instrumented soil nail walls from the literature. The centrifuge model data compared well with both full-scale situations and theoretical analyses. The results suggest that soil nail forces measured in the centrifuge are conservative due to the mobilisation of a portion of the shear strength of the model soil during the acceleration of the centrifuge, leaving less un-mobilised shear strength available to resist loads resulting from the excavation.
Keywords: soil nail, centrifuge model, strength mobilisation, sand, residual andesite
INTRODUCTION
Centrifuge modelling of soil-nailed retaining walls
Various analytical methods can be used to assess collapse loads of geotechnical problems, e.g. plasticity solutions like the slip-line method or the limit equilibrium methods which have traditionally been the most widely used method (Shen et al 1982). However, limit equilibrium methods require assumptions regarding the shape of the failure surface and the distribution of stress along the failure surface. As these assumptions affect the solution of the problem, it is important that they are realistic. Failure mechanisms and deformation behaviour of soil-nailed structures can be back-analysed from full-scale case studies, which are rare and costly, or from laboratory model studies. The non-linear stress-strain properties of soils require the stress levels in models to be corrected to that of the full scale to ensure realistic results. This necessitates the use of a geotechnical centrifuge.
Shen et al (1982) reported on one of the first centrifuge model studies conducted to model a soil nail retaining wall in sand and compared test results against the predictions from analytical models. A comprehensive study of soil-nailed walls in sand was also carried out by Tei (1993). Zhang et al (2001) carried out parametric studies of soil nail retaining structures, experimenting with nail lengths and spacings, and found that failure surfaces of nailed surfaces were deeper than without reinforcement. Shen et al (1982) and Tei (1993) observed curved failure wedges (logarithmic spirals, according to Tei et al 1998; see also Bolton & Pang 1982), initiating from the toe of the retained face and reported good agreement with critical failure wedges predicted from limit equilibrium analysis.
Physically modelling all elements of the process of constructing a soil nail retained face in the centrifuge presents many difficulties. In the available case studies, the soil nails were pre-installed during model preparation. Modelling of the excavation can, however, be achieved relatively easily by draining a fluid selected to exert a horizontal pressure approximately equal to that of the soil once the desired acceleration had been achieved (e.g. Tei 1993). Other researchers did not model the excavation process and simply accelerated the completed model to the required acceleration (e.g. Shen et al 1982 and Zhang et al 2001). Despite some obvious discrepancies, both reported the performance of the model to be comparable to that of the full-scale situation yielding realistic results.
The geotechnical centrifuge
The Department of Civil Engineering at the University of Pretoria, South Africa, has recently acquired a geotechnical centrifuge with a capacity of 150 G-ton, meaning that the centrifuge is capable of accelerating a payload weighing up to one ton to 150 G. Geotechnical centrifuges are used to subject small-scale models of geotechnical situations to high accelerations. Due to the stress-strain behaviour of soils being highly non-linear, it is necessary to increase the stresses in a model to be analogous to the stress distribution in the full-scale situation. This is achieved using centripetal acceleration. As such, a model with a scale of 1:50 has to be accelerated to 50 times earth's gravity (50 G) to create the correct stress distribution.
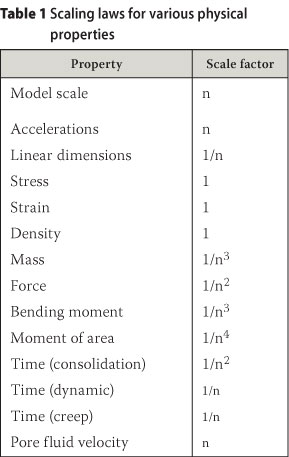
Model dimensions scale linearly and can be used to derive scaling laws for other physical properties. Table 1 lists scaling laws for a number of physical quantities. As an example, the scaling law for force is derived:
According to Newton's second law, force (Fp) in the full-scale situation (the prototype) can be expressed as Fp = mpap, where mp is the mass and ap the acceleration of the prototype. Assuming that the body to be scaled is a cube with density ρ and side length lp and that it is stationary on the earth's surface, Newton's second law can be written as

where g is gravitational acceleration. Newton's second law for the model is
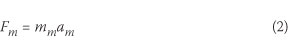
where Fm is force at the model scale, mm the mass of the model and am the acceleration at model scale. In order to avoid problems with different material properties, the same material as that occurring in the full-scale situation is normally used to create the model. The material density (ρ) therefore remains the same. The model is N times smaller than the prototype and is therefore accelerated to N times earth's gravitational acceleration to create the correct stress distribution in the model. Equation 2 therefore becomes

which proves the scaling law for force.
In terms of scaling laws, particularly attractive is the fact that time-related problems, e.g. consolidation, may be studied in a fraction of the time that would be required for a full-scale trial. Also, stiffnesses (e.g. the Young's and shear moduli) do not scale because stresses and strains do not scale. This enables the same material from the full-scale prototype to be used to construct the model.
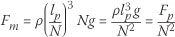
Jacobsz & Phalanndwa (2011) described a case study in which three instrumented soil nails were installed in a retained face along a cutting for the Gautrain railway line in Pretoria. The structure was excavated in residual andesite which increased in strength and stiffness with depth. The wall was 10 m high with six rows of nails installed at vertical spacings of 1.5 m and horizontal spacings of 2 m, and at a downward angle of 10°. The shotcrete facing was 175 mm thick, reinforced with two layers of mesh. The retained face and the locations of the instrumented couplings are illustrated in Figure 1. Axial forces in three of the soil nails were measured as the excavation in front of the retained face was deepened.
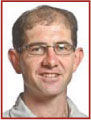
Although the survival rate of the soil nail instrumentation was poor, it showed that the maximum axial forces in the top soil nail stabilised at approximately 50 kN, approximately two thirds of the load calculated using a simple failure wedge analysis. It was found that soil nail loads were not mobilised gradually, but in distinct load increments. It appeared that the material behind the excavation remained stable to a point as the excavation advanced and, only when a certain excavation depth was reached, did the retained soil exert more load on the soil nails, as it depended on the nails for stability. Soil nail loads were mobilised in a number of such load steps as the excavation advanced, as illustrated in Figure 2.
The aims of the centrifuge model study were:
■ to measure the load mobilisation in the soil nails over time during and after excavation, and
■ to compare the mobilised soil nail loads in the model with those from the Jacobsz & Phalanndwa (2011) case study, and with those calculated from conventional wedge theory.
CENTRIFUGE MODEL
A centrifuge model was set up to model the soil nail wall described in the Gautrain retaining wall case study. The model was constructed at a scale of 1:50 and was therefore tested at an acceleration of 50 G. The scale factor was chosen taking into account the dimensions of the model container, referred to as a strong-box, in relation to the dimensions of the full-scale situation being modelled. The model is illustrated diagrammatically in Figure 3.
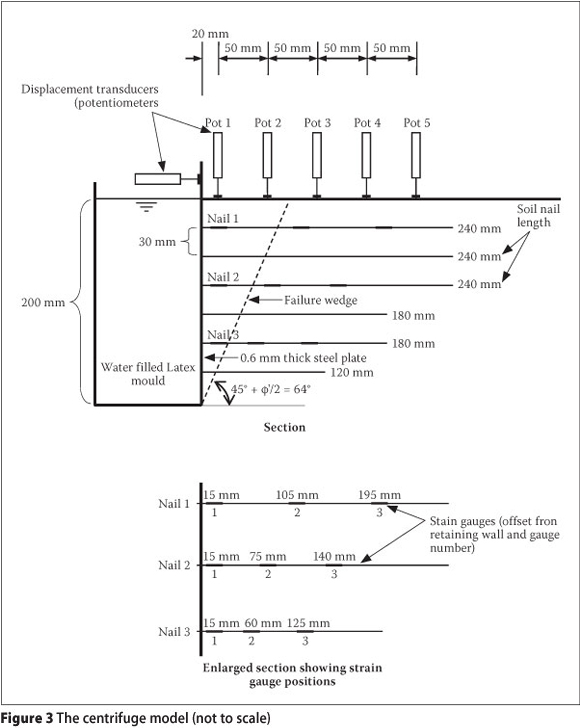
The model retaining wall was constructed from a 0.6 mm thick galvanised steel plate. The calculated bending stiffness (EI) of the shotcrete facing, assuming an un-cracked panel, was approximately 9.4 x10⁶ Nm2/m (assuming a Young's modulus for concrete of 20 GPa and 200 GPa for steel). Bending stiffness scales with the fourth power of the scale factor. The bending stiffness of the plate used to model the shotcrete face was calculated at 3.6 Nm2/m, which was therefore approximately 2.4 times stiffer than the scaled-down retaining wall value.
The model soil nails were made from 5 mm wide brass strips, 0.2 mm thick, which were bolted to the wall using 2 mm diameter nuts and bolts. The reason for using flat metal strips was so that the model soil nails could easily be instrumented with strain gauges. For ease of installation during model preparation, the nails were installed horizontally.
The purpose of the model was to investigate the mobilisation of axial loads along the length of the nails during excavation, i.e. to simulate normal operational conditions and not to fail the soil nail wall. Disregarding the effects of dilation, the design pull-out capacity of the soil nails, calculated purely from interface friction between the nails and the soil, therefore exceeded the imposed load estimated from active pressure on the wall by approximately one third, providing a safety margin. The pull-out load (Qu) of the flat strip model soil nails was calculated from σv An tanα, where σv is the vertical stress acting at the depth of the nail, An the surface area of the nail (top and bottom) and α the interface friction angle between the sand and the brass strips, measured in a shear box test at 26°. A total pull-out force of 1272 kN (full-scale) was calculated for a column of six nails. The predicted active pressures to be resisted per column of nails were 932 kN.
The calculated axial stiffness of the full-scale nails is approximately 100 MN. Axial stiffness scales with the square of the scale factor. The required stiffness of the model nails was therefore 40 kN. The brass strips were 2.7 times stiffer than the scaled requirement. It was, however, not practical to use narrower strips due to instrumentation difficulties.
Three model nails were instrumented with three strain gauges each, connected in quarter Wheatstone bridge circuits. The strain gauges were positioned with the first gauge close to the wall and the second gauge close to the position where the maximum tensile force was expected, i.e. where an active failure wedge is expected to be mobilised (roughly at an angle of 45° + φ/2 with the horizontal) (e.g. Lazarte et al 2003). The third gauge was mounted approximately halfway between the second gauge and the end of the soil nail (see Figure 3).
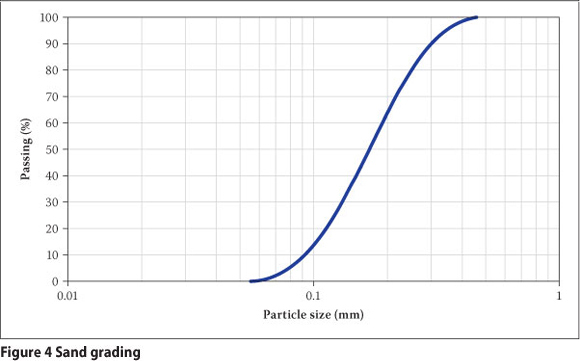
The soil used in the model was a fine alluvial silica sand sourced from a commercial source near Cullinan. It was found that particles larger than approximately 200 µm were relatively well rounded, but the finer fraction tended to be more angular with a description of angular to sub-angular being appropriate. The grading curve for the sand is presented in Figure 4. The friction angle of the sand was measured at 37° using a conventional shear box. During model preparation the sand was placed by pluviation during which a constant drop height and flow rate were maintained. The sand was pluviated in layers of about 30 mm thickness, i.e. the vertical spacing between rows of soil nails. The placed relative density of the sand was approximately 55% (1566 kg/m3), i.e. a medium dense sand. The mass of sand was determined by weighing the model before and after placing the sand.
The deepening of the excavation was modelled using a water-filled Latex rubber mould in which the water level was reduced during the test. This method was also used by Tei (1993) (see also Tei et al 1998). During the acceleration of the centrifuge to 50 G, the water level in the rubber mould was maintained at the correct level using a standpipe with a fixed overflow level into which water was continuously fed. This procedure was followed because it was expected that during acceleration of the centrifuge some movement of the system would have occurred, possibly affecting the water level in the rubber mould which would disturb the stress regime. After accelerating to 50 G, the water supply to the standpipe and rubber mould was stopped. A solenoid valve was opened to release the water from the rubber mould to model the excavation of soil in front of the retained face. In the first test the water level was allowed to drop without interruption from 200 mm to 0 mm depth. In the second test the water level reduction took place in steps over 2 000 seconds, and in the final test over 3 000 seconds. After every step in water level reduction, some horizontal wall movement took place, which took some time to stabilise. The next drop in water level was only initiated after this wall movement had stabilised.
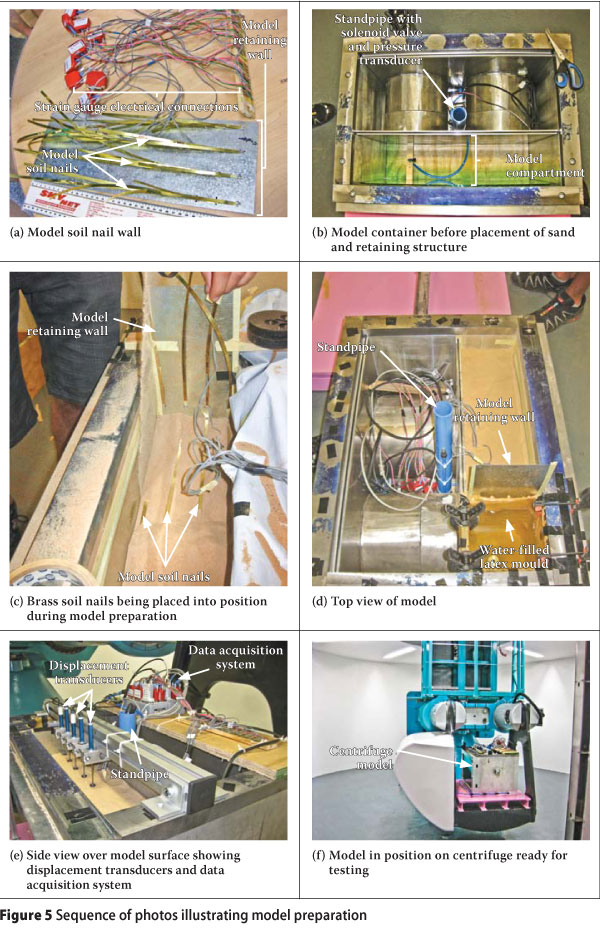
During the tests the vertical movement of the sand surface and the horizontal movement at the top and mid-height of the retaining wall were monitored using potentiometer-based displacement transducers. The water level in the rubber mould was monitored using a pressure transducer mounted near the base of the standpipe. A number of photos of the model are presented in Figure 5.
CENTRIFUGE MODEL TEST RESULTS
Surface settlement
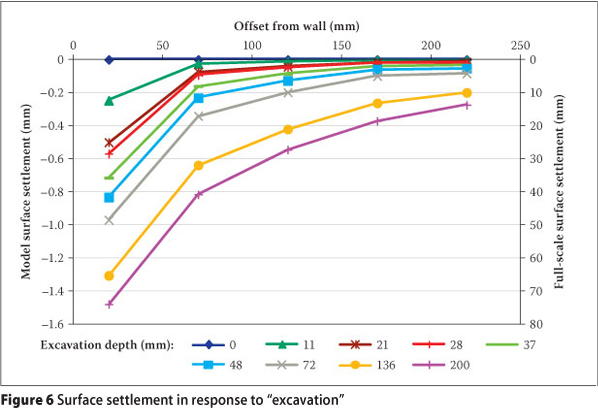
Surface settlements were recorded with potentiometers with a resolution of approximately 0.001 mm during the lowering of the water level. During the acceleration of the centrifuge to 50 G the upper surface of the sand settled between 1 mm and 2 mm in response to the stress increase acting on the model. Once at 50 G, the settlement data was zeroed so that the surface settlements caused by the lowering of the water level behind the retaining wall could be measured. Figure 6 shows the settlement of the soil surface behind the retaining wall in response to the lowering of the water level.
A maximum settlement of approximately 1.5 mm occurred immediately (20 mm) behind the wall and reduced with distance away from the wall. This translates to 75 mm at the full scale (1:50).
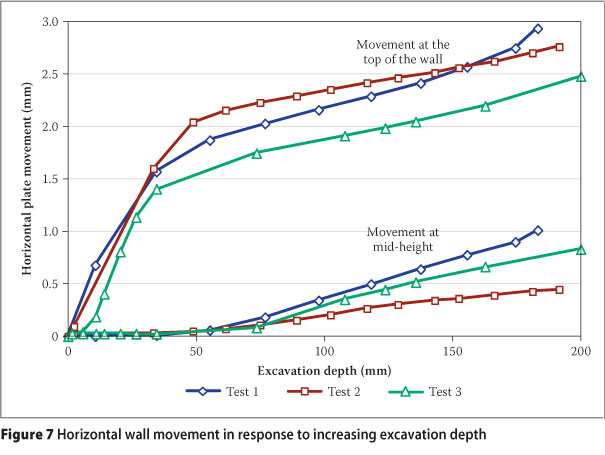
Horizontal wall movement
Figure 7 presents the horizontal movement measured at the top and mid-height of the retaining wall in response to lowering of the water level, modelling the excavation. The results of the three tests show good repeatability between tests and illustrate that the rate of water level reduction did not have a significant effect on the wall movement.
It can be seen from the figure that as the water level began to be lowered, wall movement immediately began to occur at the top of the wall. When the water level in the model excavation had dropped to below the depth of the first row of soil nails (30 mm), the rate of movement decreased as the nails began to restrain wall movement. The rate of wall movement then remained approximately constant as the excavation advanced.
Little horizontal movement was observed at the mid-height position on the wall until the water level had reduced to that height. Thereafter, horizontal movement occurred at approximately the same rate as the horizontal movement at the top of the wall.
Once the model excavation had been emptied completely, a maximum horizontal movement of about 2.5 mm was observed at the top of the wall, equating to 125 mm for the full-scale wall. The wall remained stable after excavation.
Mobilisation of soil nail forces
The development of axial loads in the soil nails in response to the deepening excavation is presented in Figure 8. During acceleration of the centrifuge to 50 G some settlement of the model wall relative to the sand occurred so that the parts of the nails close to the wall were subjected to a small amount of bending. This affected the zero offsets of force readings registered by the instrumented nails. Soil nail readings were therefore zeroed prior to the water level in the model excavation being reduced, to give loads mobilised due to the reduction in the water level only. Loads prior to zeroing were generally small (less than 10 N at model scale), except where bending of the nails occurred. The loads measured in the model are shown on the left-hand axis, with full-scale (prototype) loads on the right-hand axis. The calculated loads for the model from the wedge analysis based on friction angles of 30° and 37° are also shown in Figure 8; the comparison is discussed later.
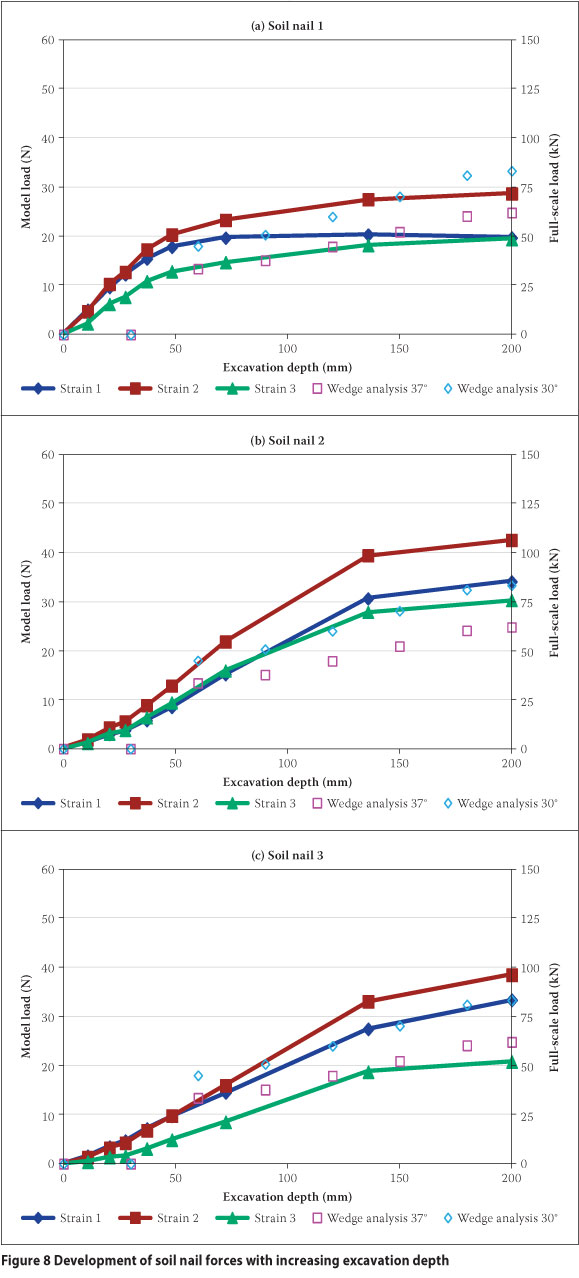
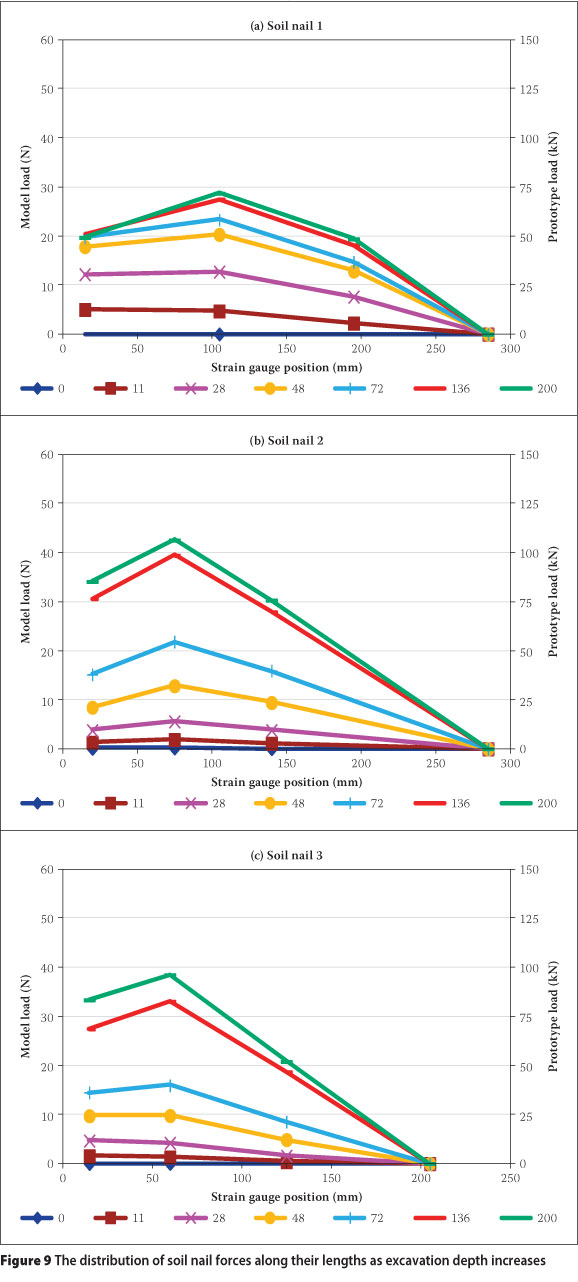
The evolving axial load distributions in the instrumented nails, as the excavation was deepened, are presented in Figure 9. Initially, the highest loads were mobilised immediately behind the wall in response to active pressure behind the wall, but soon the location of maximum force migrated backwards from the wall as a failure mechanism began to mobilise.
DISCUSSION
Comparison of model results with analytical methods
Wedge analysis
The equilibrium of a simple triangular active failure wedge behind the excavation face was examined to estimate the development of axial soil nail forces in response to the deepening excavation (Figure 10). This approach is commonly used for soil nail design, although the complexity of the mechanisms varies (SAICE 1989). For the problem modelled in the centrifuge, only three forces were considered: the self-weight of the failure wedge (W), the resisting force mobilised on the failure plane (R) and the sum of the individual soil nail forces (T). For a fully mobilised failure mechanism the resisting force R would act at an angle φ as shown in Figure 10, where φ is the soil friction angle. The soil nails were assumed to carry only axial loads, disregarding any bending or shear stiffness they might possess. The failure wedge was assumed to mobilise at a slope angle β. This slope angle was varied to find the maximum axial soil nail force (T). For a horizontal soil surface and smooth vertical retaining wall, the wedge analysis provides the same solution as the active Rankine earth pressure case.
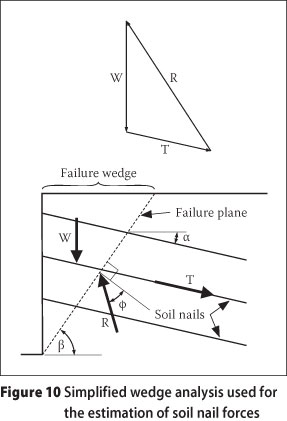
The soil nail loads were calculated for various depths of excavation by simply dividing the total calculated soil nail force (T) by the number of nails intersecting the failure wedge. The calculated forces (based on horizontal soil nails) are plotted with the observed loads in Figure 8. As no failure wedge intersects soil nails for excavation depths of up to 30 mm (1.5 m at prototype scale), zero soil nail force was assumed up to this depth.
Soil nail forces
Figure 8 illustrates that the loads in the soil nails initially increased approximately linearly with increasing excavation depth, but the rate of increase reduced with further excavation.
The trend in the measured soil nail forces compares well with the predictions from the wedge analysis, although the latter generally tends to underestimate the loads. This is somewhat in contrast with Shen et al (1982), Tei et al (1998), Lazarte et al (2003) and others who stated that average nail forces are generally smaller than those calculated by considering full active earth pressures. The most significant underestimation occurred on the second soil nail.
During the acceleration of the centrifuge to 50 G it was attempted to balance the earth pressures behind the model retaining wall by maintaining a constant water level in the rubber mould as described. However, some vertical and horizontal movements of the various components of the model were unavoidable during acceleration. The imperfect method of balancing the earth pressures as described, in combination with the movements that occurred during acceleration, resulted in a certain amount of load mobilising in the soil nails prior to reducing the water level in the rubber mould to model excavation. This means that a portion of the shear strength of the sand was already mobilised prior to water level being reduced. Because of zeroing of the soil nail reading prior to reducing the water level, these loads were ignored. The various disturbances would most probably have resulted in the amount of shear strength mobilisation in the sand before excavation to be different from the situation applicable to an actual soil nail wall, probably resulting in less shear strength being available to support the excavated face than what would have been expected. The implication of this is that the soil friction angle used in analysing the model should probably be reduced. When a friction angle of 30° is used instead of 37°, the correlation between the measured soil nail forces and those calculated using a wedge analysis improves (see Figure 8).
A further factor contributing to the difference between the measured and calculated loads is the fact that the actual stress distribution behind the retained face is significantly more complex than the simple triangular distribution assumed by active earth pressure theory (Tei 1993 and Tei et al 1998). Tei (1993) states that the failure surfaces in sand would resemble a logarithmic spiral which would result in failure wedges that are approximately 10% heavier than the assumed triangular wedge. Also, Zhang et al (2001) mentioned that the failure wedge in the presence of soil nails was deeper than without reinforcement. The actual mobilised soil nail forces are controlled by many factors, including the flexibility of the facing wall and soil nails and dilation on the soil-nail interface (Tei et al 1998).
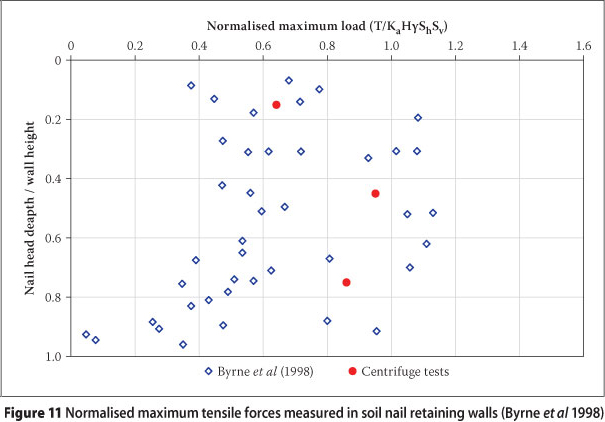
The magnitude of the scaled-up maximum observed soil nail forces in the centrifuge model are put into context by comparison with normalised soil nail forces measured at eleven sites presented in Figure 11 (Byrne et al 1998). Observed maximum tensile nail forces were normalised by KaHgShSv, where Ka is the coefficient of active earth pressure, H the wall height, γ the density of the retained material and Sh and Sv the respective horizontal and vertical nail spacing. The figure shows that the general trend is for soil nail forces to reduce somewhat with depth, but very significant scatter occurs, probably as a result of variations in soil strength and stiffness between sites which were not taken into account in the normalisation. The observations from the centrifuge tests plot well within the data set presented in the figure.
In the Jacobsz & Phalanndwa (2011) case study, soil nail loads of just less than 50 kN were measured in the top soil nail when the system was at equilibrium. These are of the same order of magnitude, albeit somewhat lower than scaled loads from the model (see Figure 8). They are also lower than the prediction from a wedge analysis. Note that a wedge analysis predicts soil nail forces that are 12% higher when nails are installed at 10° compared to horizontal nails. The reason for the scaled model loads being higher can be ascribed to the fact that the model soil profile comprised cohesionless sand in which some shear strength had already been mobilised during acceleration of the centrifuge, while the profile in the field comprised residual andesite, possessing significant cohesive strength, increasing with depth.
A further difference between the model and the case study is the step-wise way in which loads were mobilised in the case study compared to a more gradual increase in load in the model (compare Figure 2 with Figure 8). The reason for the step-wise load increase was attributed to the fact that the excavation could support itself to a certain depth and then suddenly yielded, mobilising load in the soil nails. With further excavation, it again remained stable to a certain depth before yielding again, applying another step-wise load increase on the soil nails. The cohesion-less sand did not possess any strength to support any depth of excavation, so that axial load had to be mobilised in the soil nails very shortly after the water level in the model excavation began to reduce.
The measured axial force distributions along the length of the nails shown in Figure 9 generally agreed with the pattern typically observed in the field. A soil nail normally carries a load at the retained face which increases towards the intersection with the failure plane and then reduces to zero at the end of the nail (Lazarte et al 2003). The maximum load was measured consistently at the second strain gauge on each nail. They were purposefully installed close to where the failure wedge was expected to intersect the soil nails.
Wall and ground movements
The vertical soil settlement behind the wall amounted to approximately double the amount of the expected settlement given by the guideline of H/333 by Lazarte et al (2003) for fine grained soils. However, the observed settlement applies to a medium dense sand, the material used in the model in which some shear strength had already been mobilised during centrifuge acceleration. The maximum settlement of the full-scale wall amounted to only 8 mm, illustrating that, as expected, the residual andesite behaved much stiffer than the sand in the model, settling less. The residual andesite appears to mobilise its strength at smaller strains than cohesionless sand.
It is interesting to note that the settlements above the active wedge, potentiometers 1 and 2 (see Figure 3 and Figure 6) settled significantly more than the potentiometers further away, reflecting the mobilisation of the failure mechanism. An active failure wedge is predicted to intersect the sand surface at an offset of 100 mm from the retained face. The zone behind the wall where noticeable settlements occurred, agrees well with the 140 mm (at model scale) predicted by Lazarte et al (2003).
The horizontal wall movements are presented in Figure 7 and were recorded from the onset of water level reduction until the model excavation was complete. The largest portion of horizontal movement took place during the initial reduction in water level to the depth of the first row of nails. Thereafter the rate of movement slowed considerably. In practice this initial movement would not have been recorded, because the first shot-crete panels still had to be constructed. The horizontal movement that would be recorded in practice corresponds to that associated with a drop in water level from 30 mm to the bottom of the excavation. In the tests reported here, this movement amounted to approximately 1 mm, or 50 mm at full scale.
As in the case of the vertical movement behind the wall, this horizontal wall movement also exceeded the guideline recommended by Lazarte et al (2003) (also H/333, or 30 mm at full scale). The maximum horizontal movement observed at the top of the full-scale wall was 34 mm (Jacobsz & Phalanndwa 2011). The difference can be explained due to the model comprising medium dense sand in which some shear strength had already been mobilised during centrifuge acceleration, while the full-scale situation comprised stiff residual andesite mobilising strength at smaller strains.
Following each drop in the water level in front of the model wall, it took some time before the horizontal wall movement stopped. This was also seen in the field, where some movement continued to occur for some time after completion of the excavation (Jacobsz & Phalanndwa 2011).
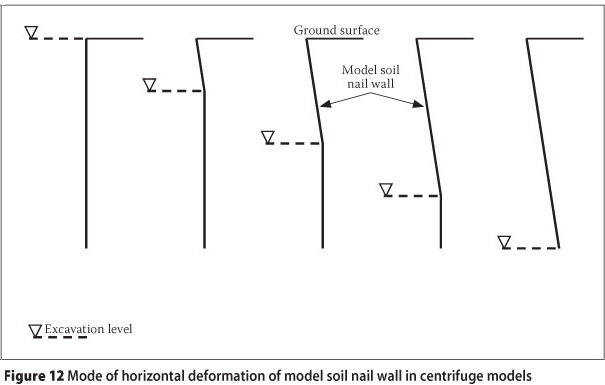
Figure 7 illustrates that the top of the wall deflected rapidly initially, but when the water level reached the level of the first row of soil nails, the rate of horizontal movement reduced due to the restraining effect of the soil nails. Virtually no horizontal movement took place at mid-height initially, indicating that the upper part of the wall bent above the excavation level. Once the water level reached mid-height, horizontal movement there took place at approximately the same rate as at the top of the wall, indicating that the wall translated horizontally with little further bending. This suggests that horizontal wall deformation occurred as indicated in Figure 12, with bending taking place at the excavation level while the upper part of the wall remains approximately planar.
Comparison between the full-scale situation and the model
Soil
It is often questioned whether the particle sizes of material used in a centrifuge model need to be scaled. For example, could the fine sand at model-scale therefore hypothetically behave as a gravel at the full-scale? In practice it is common with a centrifuge model to model the actual material occurring in the field, or often, to use the actual material from the field directly in the model. The material is then viewed as a continuum with the same stress-strain properties as in the field. Whether this assumption is reasonable depends on the ratio between the particle size in the model and the size of significant components in the model, e.g. particle size versus the dimensions of model piles, foundations or model soil nails (Taylor 1995). A method that is often used to investigate whether unrealistic scale effects occur is the so-called method of "modelling of models". Models are tested at different scales. If the scaled observations from different scale models are consistent, particle size effects can be ignored and the material can be assumed to behave as a continuum at the accelerations tested. However, when failure mechanism bounded by shear bands begin to dominate, the ratios between shear band widths, particle size and model element dimensions can become important. In such instances dilation effects within shear bands are likely to scale-up unrealistically (Taylor 1995). Milligan & Tei (1998) mentioned that relative size effects between model soil nail diameter and particle size may tend to increase the apparent strength and stiffness of the model compared to the prototype in the case of rough nails. This scale effect is significant where the ratio D/D50 ranges from 1 to 35 (where D is the nail diameter and D50 the main particle size), but reduces at higher values applicable in the field. Due to the thickness of the brass strips (model soil nails) relative to the means particle size, scale effects would be expected in the model. However, due to the smoothness of the model nails, dilation effects as described above should have been limited, although probably not insignificant.
Soil nails
One important aspect in which the soil nail retaining wall in the centrifuge differed from the full-scale situation was that the wall and soil nails were pre-installed prior to modelling of the excavation. Installation of soil nails during a test would be difficult. Due to the nails being pre-installed, loads could mobilise before the excavation depth had advanced to the depth of a particular row of nails. Also, installation-induced soil nail loads and soil stresses could not be modelled. These are likely to differ from the situation in the model (Milligan & Tei 1998).
CONCLUSIONS
A physical model, examining an instrumented soil nail retaining structure, was tested successfully in three centrifuge tests. The test yielded realistic and repeatable data, comparing well with measurements made in a full-scale case study in Pretoria (Jacobsz & Phalanndwa 2011) and with a database of eleven other case studies (Byrne et al 1998).
In terms of soil nail forces, the model showed somewhat higher nail forces compared to those predicted by a simple equilibrium analysis and when compared with the case study discussed. This is likely to be a consequence more of the shear strength of the soil being mobilised during acceleration of the model than what would be applicable in a full-scale (K0) situation, resulting in less strength being available to resist excavation-induced loads than what would have been expected. Information from the literature suggests that soil nail forces from a simple wedge analysis or limit equilibrium analysis are conservative. The results of these centrifuge tests suggest that soil nail forces from centrifuge tests may be even more conservative, due to the mobilisation of some soil strength during centrifuge acceleration.
The axial load distributions measured along the length of the soil nails compared well with the known distributions from the literature.
The trend in axial load mobilisation in the soil nails differed from the full-scale case study reported. In the model, axial load was mobilised gradually in response to excavation, while in the full-scale field study a stepwise mobilisation was observed. The reason for this is that the soil in the model only possessed frictional strength, while the residual andesite in the field had some "cohesive" strength and a fissured structure, enabling it to remain stable up to a certain depth.
Although differences between the full scale situation and a model are unavoidable, physical modelling in the geotechnical centrifuge is a valuable technique to model complex three-dimensional problems. An advantage is that a physical event can be observed and realistic results obtained using the same materials as in the field.
REFERENCES
Bolton, M D & Pang, P R L 1982. Collapse limit state of reinforced earth retaining walls. Geotechnique 32(4): 349-367. [ Links ]
Byrne, R J, Cotton, D, Porterfield, J, Wolschlag, C & Ueblacker, G 1998. Manual for Design and Construction Monitoring of Soil Nail Walls. Report No FHWA-SA-96-69R, Washington DC: US Federal Highway Administration. [ Links ]
Jacobsz, S W & Phalanndwa, T S 2011. Observed axial loads in soil nails. Proceedings, 15th African Regional Conference on Soil Mechanics and Geotechnical Engineering, Maputo, Mozambique, 221-227. [ Links ]
Lazarte, C A, Elias, V, Espinoza, R D and Sabatini, P J 2003. Soil nail walls. Geotechnical Engineering Circular No. 7, Report No FHWA0-IF-03-017, Washington DC: US Federal Highway Administration. [ Links ]
Milligan, G W E and Tei, K 1998. The pull-out resistance of model soil nails. Soils and Foundations, 38(2):179-190. [ Links ]
SAICE (South African Institution of Civil Engineering) 1989. Lateral Support in Surface Excavations, Code of Practice. Johannesburg: SAICE Geotechnical Division. [ Links ]
Shen, C K, Kim, Y S, Bang, S & Mitchell, J F 1982. Centrifuge modelling of lateral earth support. Journal of Geotechnical Engineering Division, ASCE, 108(GT9): 1150-1164. [ Links ]
Taylor, R N 1995. Geotechnical Centrifuge Technology. London: Blackie Academic & Professional. [ Links ] Tei, K 1993. A study of soil nailing in sand. PhD Thesis, Oxford: University of Oxford. [ Links ]
Tei, K, Taylor, R N & Milligan, W E 1998. Centrifuge model tests of nailed soil slopes. Soils and Foundations, 38(2): 165-177. [ Links ]
Zhang, J, Pu, J, Zhang, M & Qui, T 2001. Model tests by centrifuge of soil nail reinforcements. Journal of Testing and Evaluation 29(4): 315-328. [ Links ]
 Contact details:
Prof SW Jacobsz
Department of Civil Engineering
University of Pretoria Pretoria
0002
T: +27 12 420 3124
E: sw.jacobsz@up.ac.za
PROF SW JACOBSZ (Pr Eng, MSAICE) graduated with an MEng in Geotechnical Engineering from the University of Pretoria in 1996 and worked for Jones & Wagener before leaving for the United Kingdom in 1999 to study towards a PhD in Geotechnical Engineering at the University of Cambridge. He returned to Jones & Wagener in 2004 where he worked as geotechnica engineer before joining the University of Pretoria in 2010 as Associate Professor in the Department of Civil Engineering. His primary interest is physical modelling of geotechnical problems in the geotechnical centrifuge.

