


Services on Demand
Article
 English (pdf)
 Article in xml format
 Article references
Indicators

Related links
-
 Cited by Google
 -
 Similars in Google
Share

 Permalink
Journal of the South African Institution of Civil Engineering
On-line version ISSN 2309-8775
Print version ISSN 1021-2019
J. S. Afr. Inst. Civ. Eng. vol.55 n.1 Midrand Apr. 2013
TECHNICAL PAPER
Design implications on capital and annual costs of smallholder irrigator projects
A F Hards; J A du Plessis
ABSTRACT
While agricultural producers on commercially operated irrigation schemes will aim to achieve the recommended high crop yields, those on a smallholder irrigation scheme usually produce moderate to low crop yields. The water demand by these two irrigator types also differs and is reflected in the variations in crop yields.
Because smallholder irrigators produce lower crop yields and use less water, they should use a system suited to this lower water demand. Many irrigation schemes have the opportunity for participants to assess their farming objectives and models. The irrigators can then use the assessment results to determine their water demands, reduce their infrastructure capacity and reduce their capital, operation and maintenance costs.
On many smallholder schemes, the system has been designed for commercial crop yields and water use. If smallholders never achieve commercial levels of production, they have overcapitalised and subjected themselves to additional operational strain.
In this study, six irrigation schemes based in the Eastern Cape were evaluated according to three levels of irrigation supply: a commercial irrigator, a smallholder irrigator and the commercial under-utilised irrigator. The irrigation infrastructure for each of the six schemes was designed, and the associated costs determined, for each level of supply. The study investigates the impact of different designs on the amount of water and land used, and resultant costs of the infrastructure. The results show that a smallholder irrigator using a scheme sized for commercial operation can have significantly higher (between 5% and 29%) annual operation and maintenance costs. The study clearly shows that the farmer type should be considered when designing each irrigation scheme.
Key words: appropriate irrigation design, smallholder irrigators, smallholder water supply, smallholder production costs
INTRODUCTION
Irrigation scheme planning and design can be relatively complex. A scheme's ultimate success depends on many things - soils, water, farmer skills, markets and financing. By incorporating these factors at the various design levels, each scheme can be tailored to the user's individual circumstances.
The irrigation sector - smallholder irrigators in particular - has been the focus of much discussion and on-going government financial assistance. Programmes include the Revitalisation of Smallholder Irrigation Schemes of the Limpopo Province and other ad hoc developments, led by general policy during the last decade. The Department of Water Affairs, for instance, has developed a financial assistance policy for poor farmers (DWAF 2004), most of whom are smallholder irrigators.
It is often believed that irrigation is the key to alleviating poverty, especially in rural areas. The development of smallholder irrigators has a political aspect, because providing assistance to rural communities through irrigation aligns directly with national poverty alleviation goals. As a result, governments place considerable emphasis on smallholder irrigation, and allocate funds expressly to develop these irrigators.
By using the correct design philosophy and optimising the irrigation system, the project life cycle costs can be minimised and the best use can be made of the limited funding.
When designing a new scheme or one due for revitalisation, two questions arise: what is the best design approach, and what will influence the design and profitability? The answers usually depend on whether one is designing on a commercial basis, or altering the design to cater specifically for the operational needs of the smallholder irrigator. This paper aims to provide guidance on the expected cost ranges and the design approach to be adopted under specific circumstances. The primary aim of the study is to determine whether an irrigation scheme's design should be tailored to the particular irrigator or broadly structured for commercial water use, and whether the latter, the traditional practice, is the reason for the high economic risk associated with smallholder irrigation projects.
LITERATURE REVIEW
Irrigation management transfer and revitalisation
The most recent stage of smallholder irrigation in South Africa can be referred to as the era of irrigation management transfer and revitalisation (Van Averbeke & Mohamed 2007). The strategy coincides with the political change in the country and the ideologies that came with that change. The planned changes were first implemented through the Reconstruction and Development Programme, which was then followed by the Growth, Employment and Redistribution Policy.
Existing schemes were targeted first. Part of the process involved transferring the responsibility of managing, operating and maintaining the irrigation scheme from the state to the farmers. The process is known as irrigation management transfer (IMT) (Van Averbeke & Mohamed 2007).
With the current focus on the revitalisation of irrigation schemes, many lessons can be learned from previous development mistakes. Backeberg (2004) showed that returning to the previous focus on infrastructure at the expense of social relationships, land tenure, water entitlements, economic location and market access, financial capital and support services, technical and financial viability, and resources of households, risks repeating the mistakes of previous generations.
One of the most comprehensive initiatives has been the Revitalisation of Smallholder Irrigation Schemes (RESIS) of the Limpopo Province (Arcus Gibb 2005). It included the WaterCare programme and involved revitalising the scheme's infrastructure, leadership, management and productivity.
The existing smallholder schemes in South Africa and their characteristics are summarised in Table 1.
Revitalisation differs from rehabilitation: it does not concentrate solely on the engineering aspect of the schemes. Denison (2005) identified that revitalisation takes a holistic approach in which human development (individually and organisationally), empowerment, access to information, marketing and business strategy development are given the same emphasis as the engineering aspects.
Design aspects found in smallholder irrigation
Each irrigation system installation should take into account the circumstances and needs of that scheme. The typical development options may need to be adapted to allow for such issues as:
■ availability of infrastructure for installation and on-going maintenance
■ availability of support services for maintenance of specialist equipment
■ affordability
■ soil and selection of a system that will prevent soil water management problems
■ the appropriateness of systems such as short-furrows and the management requirements needed to ensure their success.
Productivity of farmers is affected by education and infrastructure (Fan & Zhang 2004). If inputs and markets are made more accessible, more rural farmers will be able to use them, which will lead to greater productivity (Kamara 2004). However, poor road conditions, high transport costs and distant markets prevent good market access for smallholder irrigators (Nieuwoudt & Groenewald 2003).
Access to basic general services, such as finance and communication, affects the effectiveness of smallholder irrigators and directly affects their ability to access inputs and the market in general. Poor access to services limits the ability of farmers to adopt new or better technology (Perret & Stevens 2003). Even though they may be regarded as simple services, they must be remembered during the process of revitalisation (Chaminuka et al 2008).
Investment costs
The International Water Management Report (Inocencio et al 2007) investigated 314 projects in 50 countries to find the factors influencing the cost of revitalising smallholder irrigation projects. They are:
■ Project size (total irrigated area benefited by a project)
This is the most important factor influencing the project costs. The larger the project, the lower the unit cost; this is primarily due to the engineering economies of scale that result from larger projects.
■ Average area of irrigation systems involved in a project
As with the project size, larger system sizes will have lower unit costs than smaller systems. It was, however, shown that the larger the system, the lower the economic performance of the project.
■ Degree of complexity
The degree of complexity does not affect the development costs of a project. Increased complexity does, however, have a negative effect on the rate of return for the project.
■ Government funding
It was found that the greater the portion of government funding, the lower the unit cost for the project.
■ 'Soft costs'
The 'soft costs' include components such as engineering management, technical assistance, agricultural support, institutional development, training of staff and beneficiary farmers. Higher 'soft costs' resulted in lower unit costs.
■ Rainfall
The amount of annual rainfall was found not to have a significant impact on the costs of projects, but it improved the economic returns.
■ Macro-economic factors
The greater the gross domestic product per capita, the higher the unit cost.
■ Farmer contribution to initial costs
No impact was found on the unit cost where farmers contributed to a project. When farmers contributed to the initial costs, the project performance increased.
■ Conjunctive water use
■ Conjunctive water use' involves the use of both surface and ground water. It was found that this did not impact on the unit cost, but increased conjunctive use did significantly improve project performance.
■ Operation and maintenance (O&M), and farmer participation
Three approaches may be taken to managing O&M - first, through a government agency alone; second, through a joint venture between government and farmers; and third, by farmers themselves. Farmer-managed systems have lower unit costs than systems managed by government agencies. The deeper involvement of farmers results in tailor-made, appropriate technology that meets the farmer's real needs and reduces the project costs.
■ Type of crop irrigated
The systems for irrigating rice are significantly more expensive than those for any other crop type. The more valuable the crop irrigated, the higher the project performance and profitability. Fruits, vegetables and livestock products generally result in better project performance.
The project size, rainfall and the type of crop irrigated all affect the costing of the schemes analysed in the research. Due to the nature of the study and the engagement of the community, the degree of complexity, 'soft costs' and farmer participation should all result in lower costs and more efficient schemes. However, the effect of these items has not been quantified in this study.
Smallholder production and reduced crop water requirement
The aim of any irrigation venture is to produce the best possible crop yield permitted by the soil, water and fertility (Doorenbos & Pruitt 1977). Smallholder irrigators tend to apply significantly less water than commercial irrigators, largely because of their lower plant densities and low-input cultivation. Smallholder irrigators farm in a manner aimed at reducing risk (Perret & Stevens 2003). By reducing risk they lower input costs. The direct result is reduced crop water requirements and reduced system capacity. The reduced system capacity reduces initial costs and on-going operational costs. If the system requires less water than its design requires, its full capability might be underutilised (Crosby et al 2000).
When the system is being designed, the future needs of the farmer must be determined. The system can then be designed to allow flexible operation, and expansion if required.
Conventional design norms for calculating crop water requirements generally suit intensive farming practices, and infrastructure is designed to the peak water requirement. However, a smallholder irrigator scheme generally has lower yields than an intensive scheme. When this fact is ignored and the intensive system is proposed for the smallholder irrigator, the oversizing can negatively affect the financial evaluation of the project; the project might then be rejected based on sustainability or initial capital costs. If, when calculating crop water requirements, crop coefficients were adapted to reflect the conditions on smallholder schemes, the proposed infrastructure is likely to be smaller in capacity and lower in cost (Crosby et al 2000).
Farmer types and risks
Denison & Manona (2006) and Van Averbeke & Mohamed (2005) developed farmer typologies for irrigation schemes. These typologies are very useful for suiting the system design to the application. The farmer types are closely linked to the level of risk the farmer is willing to accept (i.e. how willing the farmer is to risk losing money). This willingness to accept risk determines how farmers operate, another factor in determining the farmer type. The farmer types also measure success according to their own criteria, which might not include financial aspects. Four farmer types were identified:
■ Business farmer
Business farmers are commercially oriented producers aiming to produce an income from their farming activities. They usually have high skill levels, an understanding of markets and greater financial resources. These farmers are likely to accept higher risks and aim for higher crop yields.
■ Smallholder farmer
Smallholder farmers are traditionally plot holders. They do not rely on farming alone, but generate income from a variety of livelihoods. As a result, they rely less on outside markets for their cash income. They are more risk-averse than the business farmer and use lower-risk farming styles. They may struggle to be financially sustainable on larger schemes and pump systems with high O&M costs. Their operations are more suited to gravity schemes with lower annual costs. They will generally reduce their inputs to reduce risk, and consequently achieve lower yields.
■ Equity labourer
Some large, expensive irrigation schemes are open to partnerships. They consist of a number of plot holders who are unable to farm in a business farmer model. Instead, an outside commercial partner operates the scheme and farming enterprise, and the plot holders become equity labourers who make their resources - soils, water and infrastructure - available. As equity labourers, the plot holders enjoy the benefits of employment and receive dividends from the enterprise profits.
■ Food producer
Food producers may be plot holders on a scheme. They have limited access to resources such as labour and finance. Generally, food producers are on the poverty line and their objective is simply to supply their households with food. They want to avoid risk completely and may not use irrigation, due to the initial costs, risks and their low skill level.
One of the most important findings of the Van Averbeke & Mohamed (2005) study was the attitude of the farmers. There was no evidence that farmers of one type aspired to achieve the higher level of production of another type. This finding is of particular importance as it shows that a scheme for smallholder irrigators should not be designed on the assumption that they will, over time, become business farmers. The objectives of the farmers determine their type. Only when the objectives of the farmer alter would they move into a different type.
The scheme design must therefore be based on direct interaction with the farmers so that the design matches the farmers' objectives.
METHODOLOGY
The research presented in this paper is based on the input data from a project undertaken by ARCUS GIBB for the Department of Water Affairs (Arcus Gibb 2004a-f) in 2003 and 2004 - the Eastern Cape Resource Poor Farmers Irrigation Pre-Feasibility Study. However, all cost calculations were based on 2007 values.
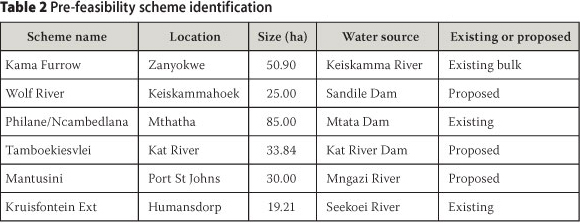
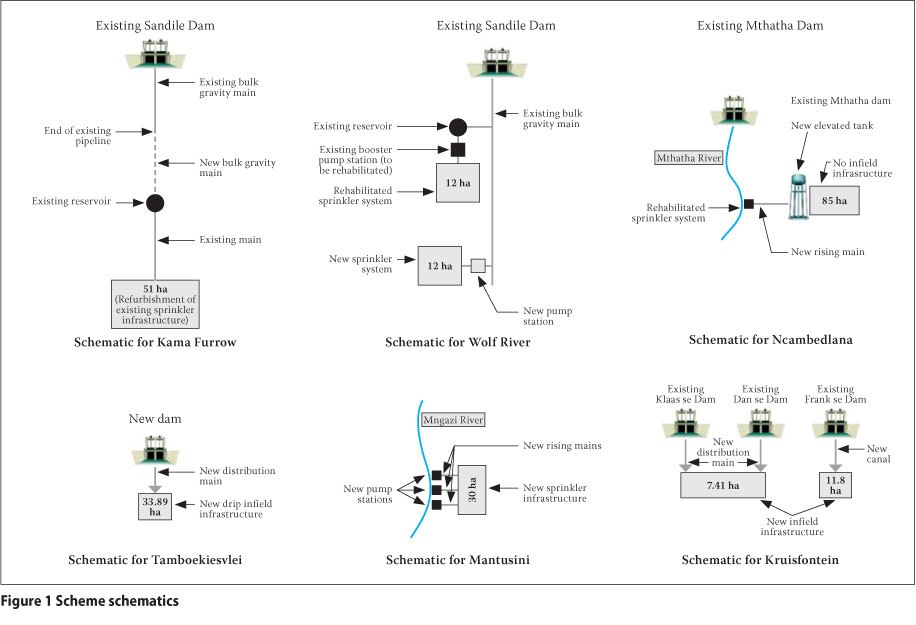
The schemes selected to form the basis of the research are shown in Table 2. Figure 1 shows each scheme schematically.
Design development
The proposed system for each scheme was developed in consultation with the beneficiaries and the characteristics of each scheme. During the study, multiple development options were evaluated for each scheme. The economics of these different options were then evaluated. Only the economically most favourable option for each scheme was used in the analysis presented in this paper.
The most favourable economic option was developed for the commercial farmer and the smallholder irrigator. For each farmer type, the water demands were calculated and the favourable option designed to cater for the required flow capacity of the system to meet the irrigation demand. The water demands were calculated using the SAPWAT (Crosby & Crosby 1999) software. BEWAB (Bennie 1993) software was used to estimate the reduction due to the lower yields and crop density of smallholder irrigators. For the purpose of the study, the term 'level of supply' (LOS) has been used to identify the farmer type and the resulting system capacity design.
The calculation of the costs of the schemes and evaluation does not take into account everything that affects irrigators. The initial capital investment in the selected schemes covers only the construction cost and related engineering fees. The financial impacts of training and organisational and institutional development were excluded. The training requirements are not always directly linked to the scheme type and size, but are more likely to be linked to the number of beneficiaries and existing skill levels.
The scheme types are also limited in the variety of infrastructure options. These were limited to:
■ pump-based schemes with only sprinklers and draglines, and
■ gravity schemes that include sprinklers and draglines, drip irrigation and short furrow flood irrigation options.
The impact of these limited selections for this study on the design, costs and results are as follows:
■ The analysis is biased towards draglines and sprinklers.
■ Results are limited to the cost associated with these pre-selected options.
■ Annual O&M costs are calculated only on the actual infrastructure.
■ A large portion of the O&M costs are attributed to the electrical costs of the pumping equipment.
■ O&M costs allow for water charges of 67 cents per cubic metre of water.
■ Kama Furrow, Wolf River and Ncambedlana have formalised their union as the Water Users Association, with an associated management cost of R250 per hectare per annum.
Financial evaluation
The gross margin analysis was based on one hectare under irrigation, planted with a mixture of field crops and vegetables. The crop types were green mealies, potatoes, tomatoes, carrots, maize and dry beans (summer crops) and cabbage (winter crop). The costs for each crop type excluded management, but included indicative market selling prices and transport to markets. The crop types were chosen to provide a fair representation of crops and a profitability that could realistically be achieved. The hectare would be fully planted with the six summer crops, but only 30% of the area would be used for cabbages in winter. The gross margin was calculated for each LOS considering the overall yield difference between a commercial and smallholder irrigator. In terms of efficiency of production, the evaluation is based on smallholder irrigators achieving production levels of 60% of the commercial yields, as would be expected from the regional
Computerised Enterprise Budgets (COMBUD) published by the Department of Agriculture. Additional key elements of the evaluation were:
■ The financial analysis includes the DWA Bulk Water subsidy of R 10 000 per hectare with a maximum of R 50 000 per eligible farmer.
■ The analysis does not make provision for the replacement of infrastructure.
■ The tax rate used for the financial evaluation is 15%.
■ Infrastructure loans will be at an interest rate of 8%.
■ It is assumed that farmers will require loans for 100% of their operational costs during the first two years and that thereafter they will reduce their requirements to 50%.
SUMMARY OF FINDINGS
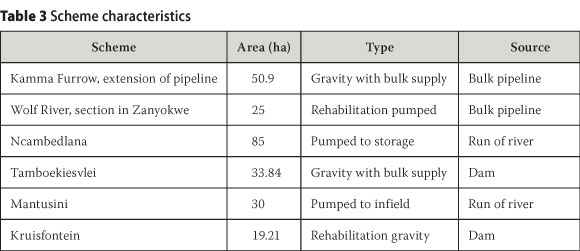
Summarising the costs of the interventions of each of the schemes allows us to evaluate the type of system applied and whether there are similarities between the schemes. Table 3 shows the characteristics of the different types of schemes evaluated in this study.
Capital costs
For each scheme, a design was created for the commercial and smallholder levels. A summary of the associated development capital costs are presented in Table 4. Table 4 shows that the initial capital costs are likely to be linked to the type of scheme. A 'rehabilitated' scheme is likely to cost less than any other type of scheme; a new 'pumped' scheme costs more than a rehabilitated scheme; and a new 'gravity' scheme is the most expensive.
Operation and maintenance costs
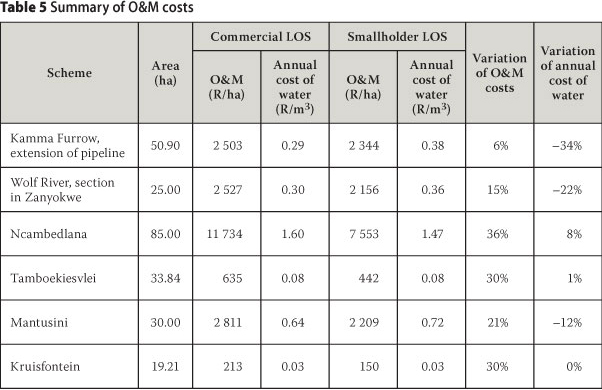
From the capital costs developed for each scheme, the associated O&M costs have been calculated and presented in Table 5. The actual cost per hectare of the schemes, based on the annual O&M costs, reveals four distinct groups. These are: Wolf River and Kruisfontein, Mantusini, Wolf River and Kamma Furrow, and Ncambedlana. Table 5 shows that gravity schemes are likely to have lower O&M costs than pumped schemes. However, a gravity scheme with significant infrastructure would have higher O&M costs, making it similar to a smaller pumped scheme. A pumped-to-storage scheme has higher O&M costs than any other scheme. The costs given in Table 5 include:
■ O&M: These include the annual maintenance costs of the proposed infrastructure; and operational costs, including water charges, water user association charges and electrical operational costs. No additional allowances have been made for increases in electricity costs.
■ Annual cost of water: The value shows the annual O&M cost of water used on the scheme. The cost does not allow for capital repayment. The cost of operating the scheme in R/m3 was based on level of consumption. The lower the cost per cubic metre, the greater the value to the user, because it will cost less to use the same amount of water.
Variation of costs
It is important to determine the impact of the variation between the two LOS designs on capital, O&M and water costs. To illustrate this variation between the costs, the percentage variation of the commercial LOS to the smallholder irrigator LOS is shown in Tables 4 and 5.
Zero percent indicates that there is no variation; a positive percentage that the commercial LOS has a higher value than the smallholder irrigator LOS; and a negative percentage that the commercial LOS has a lower value than the smallholder irrigator LOS.
The capital cost has a variation range of costs between 4% and 34%, with the average about 18%. The increased costs are not proportional to the increased volume of water used, which was expected due to economies of scale. For example, the infrastructure required to deliver 30% more water would not need to cost 30% more.
Commercial under-utilised level of supply
Tables 4 and 5 compare the commercial and smallholder LOSs, and show how they affect the initial capital and on-going operational costs. The impacts on the smallholder irriga-tor caused by over-designing the scheme are revealed, not by simply comparing the commercial and smallholder irrigator costs, but by considering the full scenario of the commercial under-utilised LOS. Commercial under-use occurs when a smallholder irrigator is placed on a commercially designed scheme, but still operates like a smallholder. To evaluate the impacts of this, the costs for the commercial designed scheme and the water use of the smallholder LOS need to be compared. Table 6 summarises the costs associated with this option.

The costs in Table 6 for the commercial under-utilised LOS projects provide the best information for comparison with the smallholder irrigator's costs. The commercial under-utilised LOS and the commercial LOS have been compared to the smallholder LOS in Figure 2.
Figure 2 shows that the capital and O&M costs of the commercial under-utilised LOS is on average 18% more expensive than a correctly sized scheme. If the capital costs do not need to be repaid, it may not have the initial negative impact that it would have if the farmers needed to fund the construction themselves. However, the O&M costs of the larger capacity system affect the farmers on an on-going basis. They are between 5% and 29% higher than if the system were designed for the smallholder LOS only, and farmers must pay these higher costs each year, which affects their financial viability.
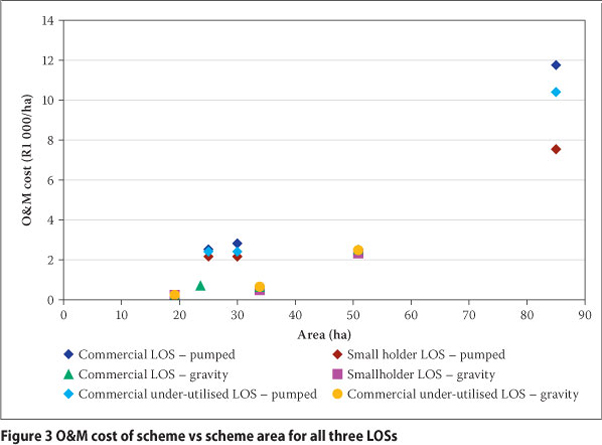
A commercial farmer would be producing a higher yield crop than a smallholder irrigator on the same system, and unlike the smallholder, would recoup the additional costs. The variation in O&M costs for the three LOSs is depicted in Figure 3. It would be expected that the larger schemes would benefit from economies of scale and that the annual O&M cost per hectare would decrease as the scheme size increased. Figure 3 indicates that the characteristics of the selected schemes for the study outweigh the economies of scale and have a greater effect on the annual O&M.
The O&M costs for the commercial LOS are higher and generally vary from 5% to 34% compared to the other LOSs. A further, distinct variation occurs between the gravity and pumped schemes: the pumped system has higher O&M costs, which are largely attributable to electricity charges.
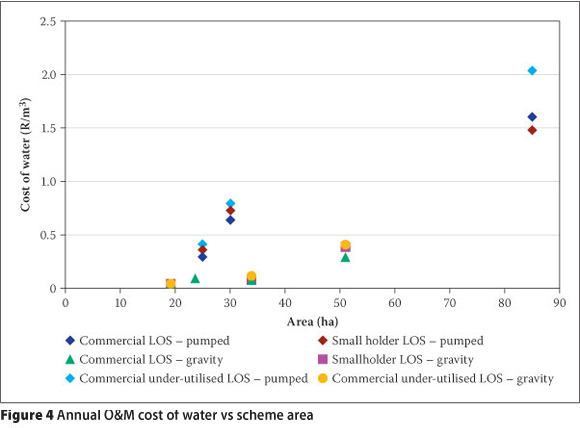
The higher annual O&M cost per cubic metre for the commercial under-utilised LOS is shown in Figure 4. While the O&M cost per cubic metre for the commercial LOS and smallholder LOS are roughly the same, the commercial under-utilised LOS has significantly higher annual O&M cost per cubic metre - between 5% and 29% - than the commercial and smallholder LOSs.
Financial evaluation
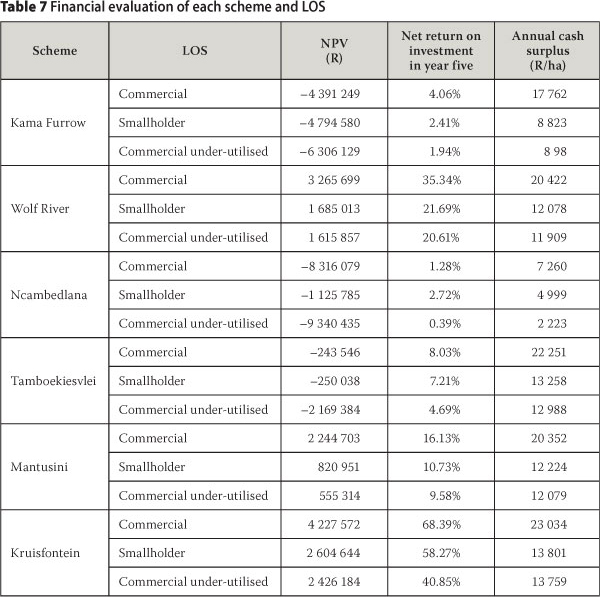
Table 7 presents the results of a financial evaluation for each scheme and LOS. The return on investment presented in Table 7 has been calculated at year 5 when the initial infrastructure capital debt repayments have reduced and normal working capital requirements account for the lending needs of the farmers. The full calculations show the same return on investment from year 5 until year 19 (not presented here). The return on investment was calculated using the net benefit after financing divided by the initial capital outlay. The cash surplus is the net benefit after financing divided by the irrigable area.
The results of the financial evaluation show that a commercially operated farm provides the best net present value (NPV) and cash surplus. The higher NPV is expected, since commercial farmers will have higher returns from their crops. The smallholder irrigator has the second best NPV for each of the schemes, except for Ncambedlana, which provided the best NPV. 'Commercial underutilised' ranks third in each category.
For normal investment purposes, a negative NPV would indicate that a project is not viable in its current form and should be either abandoned or revised to determine a suitable strategy for achieving a positive return.
CONCLUSIONS
The higher water use associated with the commercial LOS results in infrastructure with greater capacity, but with higher construction costs and higher annual O&M costs. The infrastructure for the smallholder LOS has been reduced to suit its lower needs, reducing its capital and O&M costs.
The evaluation of the two LOSs has shown that the capital cost for the commercial LOS is approximately 18% higher than for the smallholder LOS, and the O&M costs are 6% to 36% higher. The initial capital cost may, in some cases, be grant-funded by the government, but the on-going O&M costs will be funded by the farmer. If farmers are producing the yields associated with the different LOSs, they will have no additional financial burden, as the infrastructure has been sized to suit that LOS.
The evaluation, even though based on limited specific projects, provides a general estimate of possible costs associated with each scheme type and LOS. As the calculated costs depend on each scheme's individual requirements and location, they will not be applicable to every similar scheme. The schemes that were investigated can be grouped into five general scheme types:
■ Gravity schemes that need rehabilitation, where the bulk supply is in place and no augmentation or rehabilitation is required (e.g. Kruisfontein)
■ Rehabilitated schemes where water is supplied from a nearby bulk pipeline and pumped directly to the lands (e.g. Wolf River)
■ Run-of-river schemes where water is abstracted and pumped directly to the lands (e.g. Mantusini)
■ Run-of-river schemes where water is abstracted and pumped to storage (e.g. Ncambedlana)
■ Gravity schemes where bulk supplies need to be installed (e.g. Tamboekiesvlei and Kama Furrow)
A summary of the indicative costs of the different scheme categories is provided in Table 8.
A a new irrigation system may have been designed for a commercial LOS because the designer either had not taken into account the irrigator type or had expected that the smallholder irrigator would attain a commercial LOS. If the smallholder irrigator attains a commercial LOS, they would receive a benefit because the system would cater for the higher LOS they require. If the irrigator has neither the desire, necessary skills, maintenance support, sufficient training, access to credit, nor links to markets needed to attain a commercial LOS, they would continue to operate at a smallholder LOS, but with the additional challenges associated with the cost of water, due to the over-designed system. Where the smallholder irrigator is never going to achieve a commercial LOS, they will find they must use a system that is optimised to neither their skills nor their water needs.
A comparison between the commercial under-utilised LOS and the smallholder LOS has shown that the capital cost for commercial under-utilised LOS is 2% to 34% higher, and the O&M costs 5% to 29% higher, than for the smallholder LOS. The O&M variation is higher with the same water use, indicating that the costs of maintaining the higher cost infrastructure and of operating higher capacity pumps have a significant impact on the smallholder irrigator.
The smallholder irrigator on a commercial LOS scheme is therefore at a definite disadvantage to a smallholder irrigator on a smallholder LOS scheme. Even if the initial capital costs are grant-funded by government, the irrigator must pay higher annual O&M costs. The higher O&M costs will directly affect the farmers' margins and how much they will profit from the venture. It could also affect the farmers' sustainability; they would need to consolidate land and manage larger areas to generate greater profits to overcome their higher O&M costs. Failure rates of these farmers would also probably be higher.
A further indication of the cost effectiveness of the smallholder LOS is illustrated in the annual O&M costs per cubic metre of water used. This figure is significant - the commercial LOS and smallholder LOS have similar values, showing that their design and water use are being optimised. The O&M costs of the commercial under-utilised LOS are significantly higher, ranging between 5% and 29%. The higher values indicate that smallholder irrigators using less water on a commercial LOS are not operating optimally and their water use is not as cost-effective as that on the correctly designed schemes.
The financial evaluation provides further evidence that a commercial scheme offers little benefit for a smallholder irrigator. The smallholder irrigator will achieve lower returns and faces additional risk due to high debt. Table 8 shows that the commercial under-utilised LOS provides the lowest NPV, net return on investment and annual cash surplus. A summary of the indicative financial return of the different scheme categories is provided in Table 9.
RECOMMENDATIONS
To appropriately apply the information provided by the study, the individual circumstances of each scheme and the farmers involved in it must be understood.
Business farmers are likely to require the commercial LOS. They are willing to accept higher risk, have financing to cover the higher inputs and have market access to sell their larger amount of produce.
Smallholder farmers will require a design based on the smallholder LOS, as this is most suited to a more risk-averse farming style where inputs are reduced and reliance on outside assistance is not an important component.
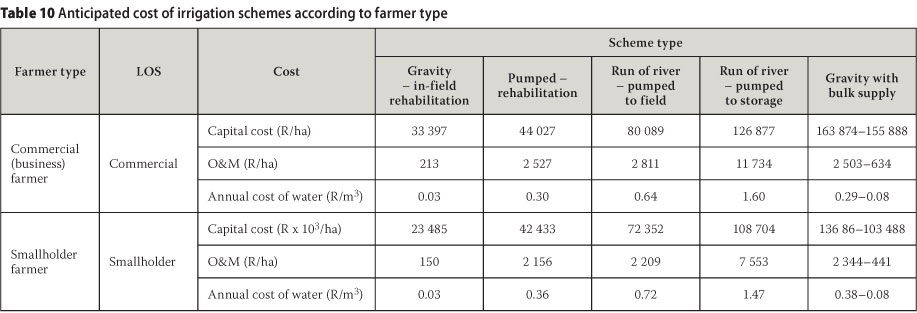
Understanding the farmer types and the appropriate LOS allows the results from the evaluated schemes to be correctly correlated. The farmer types, anticipated LOS and associated costs have been incorporated in Table 10.
The design of any scheme must involve consultation with the end users to determine their main objectives and ability to manage risk. Once these have been determined, the scheme can be designed for an appropriate LOS and the associated costs can be evaluated. When approaching a new project for which the farmer type and scheme type have been determined, Table 10 can be used to provide a starting point for the anticipated LOS and associated costs. Site-specific design and economic calculations will then need to be completed for the proposed scheme to determine its capital costs and financial viability.
REFERENCES
Arcus Gibb 2004a. Eastern Cape Resource-poor Farmers Irrigation Scheme Feasibility Study: Kama Furrow final report. Report No PWMA12/000/00/1807, Pretoria: Department of Water Affairs and Forestry. [ Links ]
Arcus Gibb 2004b. Eastern Cape Resource-poor Farmers Irrigation Scheme Feasibility Study: Kruisfontein final report. Report No PWMA12/000/00/1107, Pretoria: Department of Water Affairs and Forestry. [ Links ]
Arcus Gibb 2004c. Eastern Cape Resource-poor Farmers Irrigation Scheme Feasibility Study: Mantusini final report. Report No PWMA12/000/00/1707, Pretoria: Department of Water Affairs and Forestry. [ Links ]
Arcus Gibb 2004d. Eastern Cape Resource-poor Farmers Irrigation Scheme Feasibility Study: Ncambedlana final report. Report No PWMA12/000/00/2007, Pretoria: Department of Water Affairs and Forestry. [ Links ] Arcus Gibb 2004e. Eastern Cape Resource-poor Farmers Irrigation Scheme Feasibility Study: Tamboekiesvlei final report. Report No PWMA12/000/00/1007, Pretoria: Department of Water Affairs and Forestry. [ Links ]
Arcus Gibb 2004f. Eastern Cape Resource-poor Farmers Irrigation Scheme Feasibility Study: Wolf River final report. Report No PWMA12/000/00/1907, Pretoria: Department of Water Affairs and Forestry. [ Links ]
Arcus Gibb 2005. RESIS - The Limpopo programme for the revitalisation of smallholder irrigation schemes: A description and critique. Report No 5 of WRC Project K5/1464/4, East London: Arcus Gibb. [ Links ]
Backeberg, G R 2004. Research management of water economics in agriculture - An open agenda. Agrekon, 43(3): 357-374. [ Links ]
Bennie, A T P 1993. Besproeiingswater Bestuursprogram (BEWAB): Hersiene weergawe. [Irrigation Water Management Programme, revised version]. Bloemfontein: University of the Orange Free State, Department of Soil Science. [ Links ]
Chaminuka, P, Senyolo, G M, Makhura M N & Belete, A 2008. A factor analysis of access to and use of service infrastructure amongst emerging farmers in South Africa. Agrekon, 47(3): 365-378. [ Links ]
Crosby, C T & Crosby, C P 1999. SAPWAT - A computer program for establishing irrigation requirements and scheduling strategies in South Africa. WRC Report No. 624/1199, Report to the Water Research Commission, Pretoria: MSS Consulting Engineers. [ Links ]
Crosby, C T, De Lange, M, Stimie, C M & Vander Stoep, I 2000. A review of planning and design procedures applicable to small-scale farmer irrigation projects. WRC Report No 578/2/00, Report to the Water Research Commission, Pretoria: MSS Consulting Engineers. [ Links ]
Denison, J D 2005. A comparative analysis of South African and international irrigation revitalisation approaches. Report No 10, WRC Project No K5/1463/4, Pretoria: Water Research Commission. [ Links ]
Denison, J D 2006. Data base on smallholder irrigation schemes in South Africa. WRC Project No K5/1463/4, Pretoria: Water Research Commission. [ Links ]
Denison, J D & Manona, S 2006. Principles, approaches and guidelines for the participatory revitalisation of smallholder irrigation schemes. Vol 1: A rough guide for irrigation development practitioners. WRC Report No TT 308/07, Pretoria: Water Research Commission. [ Links ]
Doorenbos, J & Pruitt, W O 1977. Guidelines for Predicting Crop Water Requirements. FAO Irrigation and Drainage Paper No 24, Rome: Food and Agriculture Organization of the United Nations. [ Links ] DWAF (Department of Water Affairs and Forestry) 2004. Policy on the Financial Assistance to Resource-poor Irrigation Farmers. Pretoria: DWAF. [ Links ] Fan, S & Zhang, X 2004. Infrastructure and regional economic development in China. China Economic Review, 15: 203-214. [ Links ]
Inocencio, A, Kikuchi, M, Tonosaki, M, Maruyama, A, Merrey, D, Sally, H & De Jong, I 2007. Costs and performance of irrigation projects: A comparison of sub-Saharan Africa and other developing regions. [ Links ]
IWMI Research Report No 109, Colombo, Sri Lanka: International Water Management Institute. [ Links ]
Kamara, A B 2004. The impact of market access on input use and agricultural productivity: Evidence from Machakos District, Kenya. Agrekon, 43(2): 202-216. [ Links ]
Nieuwoudt, L & Groenewald, J 2003. The Challenge of Change: Agriculture, Land and the South African Economy. Scottsville: University of Natal Press, 265-282. [ Links ]
Perret, S R & Stevens, J B 2003. Analysing the low adoption of water conservation technologies by smallholder farmers in southern Africa. Working Paper No 2003-01, Pretoria: University of Pretoria: Department of Agricultural Economics, Extension and Rural Development. [ Links ]
Van Averbeke, W & Mohamed, S S 2005. Smallholder farming styles and development policy in South Africa: The case of Dzindi Irrigation Scheme. Pretoria: Tshwane University of Technology, Department of Crop Science, Centre for Organic and Smallholder Agriculture. [ Links ]
Van Averbeke, W & Mohamed, S S 2007. Smallholder irrigation schemes in South Africa: Past, present and future. Pretoria: Tshwane University of Technology, Department of Crop Science, Centre for Organic and Smallholder Agriculture. [ Links ]
 Contact details:
Adrian Hards
Department of Civil Engineering
Stellenbosch University
Private Bag X1
Matielanc
7602
South Africa
T: +27 21 808 4358
F : +27 21 808 4351
E: ahardssa@gmail.com
Contact details:
Dr Kobus du Plessis
Department of Civil Engineering
Stellenbosch University
P/Bag X1
Matieland
7602
T: +27 21 808 4358
F +27 21 808 4351
E: jadup@sun.ac.za

ADRIAN HARDS (Pr Eng, MSAICE, MSAB Designer) has practised in the field of water engineering for 11 years, gaining most of his experience in the Eastern Cape. He is particularly interested in pipeline transient analysis, pump stations, pipe structural design and irrigation Engineering from the University of Natal, and ir 2008 he obtained Approved Designer status from the South African Irrigation Institute.

DR KOBUS DU PLESSIS (Pr Eng, MSAICE, MIMESA) has lectured in hydrology, water engineering and environmental engineering for the past ten years at the Stellenbosch University. During his more than 25 years of experience in the water sector, he has also worked for the Department of Water Affairs, the City of Cape Town and the West Coast District Municipality. His specia interest is integrated management of water resources in South Africa as applied by local authorities. He obtained his PhD (Water Governance), MSc (Water Resource Management) and BEng (Civil) from the Stellenbosch University.

