


Services on Demand
Article
 English (pdf)
 Article in xml format
 Article references
Indicators

Related links
-
 Cited by Google
 -
 Similars in Google
Share

 Permalink
Journal of the South African Institution of Civil Engineering
On-line version ISSN 2309-8775
Print version ISSN 1021-2019
J. S. Afr. Inst. Civ. Eng. vol.55 n.1 Midrand Apr. 2013
TECHNICAL PAPER
Improving water quality in stormwater & river systems: an approach for determining resources
N Nel; A Parker; P Silbernag
ABSTRACT
This paper is a showcase of the approach used to determine the additional resources required to improve inland water quality in the City of Cape Town to an acceptable level. As the improvement of water quality falls in the more complex realm of modern municipal engineering - where many of the issues are so-called "soft" in nature and the problems and solutions are not straightforward - the methods discussed in this paper were instrumental in creating an holistic overview of the state of the rivers and wetlands in the City of Cape Town, highlighting the complexity of the problem and assisting to plot a way forward to provide proactive, sustainable measures for the management of water pollution. The paper discusses: the evaluation of water quality data, catchment analysis and determination of pollution sources, a risk assessment, and a prioritisation exercise, and concludes with the novel points and obstacles encountered. In all, the methods discussed provide a significant contribution towards the quest to improve water quality in the City of Cape Town.
Keywords: City of Cape Town, stormwater, pollution, methodology, resources
In the end, all water is stormwater.
- A Parker, 2010
Whatever its origin or use, all water,
whether from roofs, roads, wastewater
treatment works, boreholes or bottles,
becomes stormwater.
INTRODUCTION
The City of Cape Town (the City) has an extensive network of rivers and wetlands which fulfil diverse ecological, aesthetic, recreational and infrastructure network functions. They form an important part of the natural landscape, provide beauty and a sense of place and belonging to the people, encourage tourism, and provide recreational opportunities, health benefits, natural hazard regulation and other ecosystem services.
Over the past few decades, however, many of these watercourses have been adversely impacted by pollution. In terms of the Department of Water Affairs (DWA) water quality guidelines for recreation and aquatic ecosystems, 69% of vleis and 42% of rivers in Cape Town have poor to bad water quality (City of Cape Town 2008). This poses a significant risk to human health and aquatic biodiversity.
The impacts of poor water quality may be far-reaching, as the forgoing of recreational opportunities, for instance, may result in socially less desirable behaviour, negatively affecting the wellbeing of society and placing strain on social services in the City. Also, poor quality water used for urban farming activities may severely compromise food production, which is a source of income for many. Ultimately poor water quality poses a significant threat to human health, aquatic biodiversity and the added value that good quality water brings to the economy.
The challenge, therefore, is to protect the inland waters from the impact of pollution, and to improve inland water quality to an acceptable level. Current human and financial resources to manage pollution in inland waters are inadequate.
The Catchment, Stormwater and River Management (CSRM) Branch of the Transport, Roads, Stormwater and Major Projects Directorate of the City decided to launch a project to determine the additional resources required to manage pollution in stormwater and river systems to improve inland water quality compliance to an "acceptable level".
This paper is a showcase of the methodology used in this multifaceted and interdisciplinary project where the causes and solutions to water pollution are extremely complex, and large amounts of data, literature, opinions and information were at hand. The methods used to achieve the following project outputs are discussed:
■ Identification of criteria for "acceptable water quality"
■ Identification of catchment pollution sources
■ Risk assessment of catchments to determine their vulnerability
■ Prioritisation of catchments, rivers and wetlands for intervention
■ Provision of prioritised cost estimates per district/region/subcouncil for the management of the various pollution sources, and identification of implementation mechanisms/partnerships.
ACCEPTABLE WATER QUALITY
One of the main challenges in the project was to determine what is meant by "acceptable water quality" in order to verify practical and achievable objectives in terms of water quality and to package vast amounts of water quality data in a meaningful manner to achieve the project objectives. Water quality standards and criteria ultimately drive the interventions necessary to bring water quality to a desired level.
City of Cape Town sampling, monitoring and evaluation of water quality
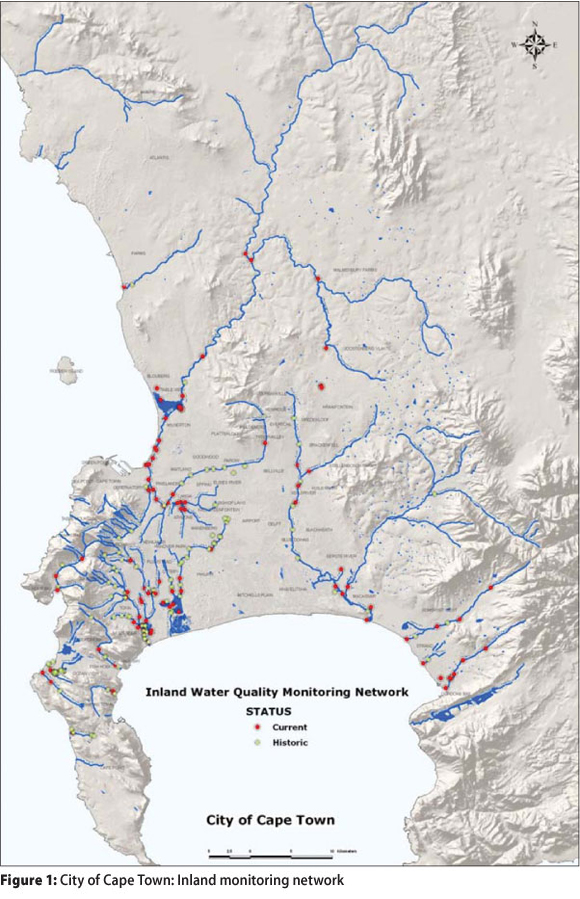
An inland surface water monitoring network with monitoring sites within each of the major catchment areas is maintained by the City. There are approximately 100 active sampling points which are located at strategic locations as indicated in Figure 1. Both rivers and wetlands are monitored and this occurs on a monthly basis, with both historical and current data being available.
Eighteen microbiological and chemical constituents are measured in inland water samples. There are therefore, for a 10 year period, 216 000 data points (18 constituents for around 100 sampling points taken on a monthly basis over 10 years). The key is to present this data in a meaningful way.
Reporting on water quality
For broad reporting purposes, the City currently assesses these monthly water quality results for inland waters from two perspectives: "ecosystem health" and "public health". The relevant Department of Water Affairs and Forestry (DWAF)1 Water Quality Guideline series provides the basis for this evaluation.
Aquatic ecosystem health
For ease of reporting, total phosphorus is used by the City as an "indicator" of general chemical water quality in inland waters and provides a proxy measurement of the state of an aquatic system.
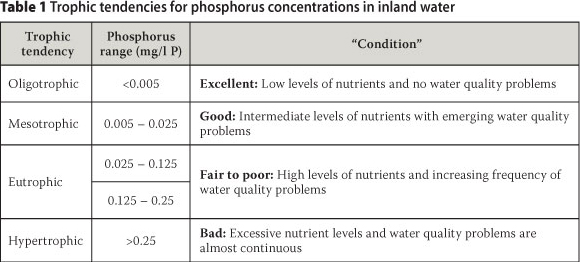
The median2 "total phosphorus" concentration is calculated for river and vlei monitoring points in various systems, and compared to concentration ranges which indicate the trophic tendencies and conditions described in Table 1:
Public Health
"Faecal coliforms" is the constituent used by the City as an indication of the suitability of inland water for intermediate contact recreational use (activities involving an intermediate degree of water contact, e.g. sailing, canoeing and fishing).
The DWAF Water Quality Guideline for Recreation (DWAF 1996a) sets safe standards for the limits of pollutants that may be used for intermediate contact recreational use and states that samples should not exceed 1 000 faecal coliform organisms per 100 ml. The percentage of samples with <1 000 faecal coliform counts for the twelve-month period is thus used as an indication of the level of compliance.
River health programme
The City is a participant in the River Health Programme (RHP) which is a national bio-monitoring programme that uses a range of biological indices for determining the ecological health of rivers. The SASS5 index (South African Scoring System Version 5) is the most widely utilised bio-monitoring index in the RHP and consists of an assessment of aquatic macro-invertebrate communities present to determine ecological river health.
The local bio-monitoring programme of the City has been undertaken annually (where human resources allow) at approximately 40 river locations. Ideally it should be undertaken in spring, summer and autumn, which is now being done (Haskins, personal communication 2010).
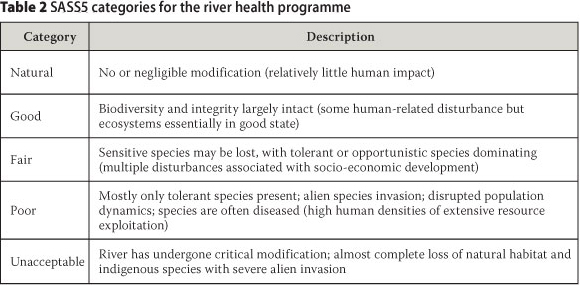
The RHP utilises four descriptive categories of river condition as shown in Table 2. The fifth category ("unacceptable") was introduced for the purposes of this analysis, due to the need to address the severely modified rivers within the municipal boundaries (Belcher, personal communication 2010).
Methodological approach for the determination of acceptable water quality
A Water Quality Sub-Committee was established in order to determine "acceptable water quality" criteria and standards. Participants included the consultant team, water quality specialists and scientists and other relevant parties from the City.
The section below discusses the criteria decided upon, which were used to evaluate and colour-code the water quality data obtained from the City in order to provide a visual depiction of the water quality status of the rivers and wetlands of Cape Town.
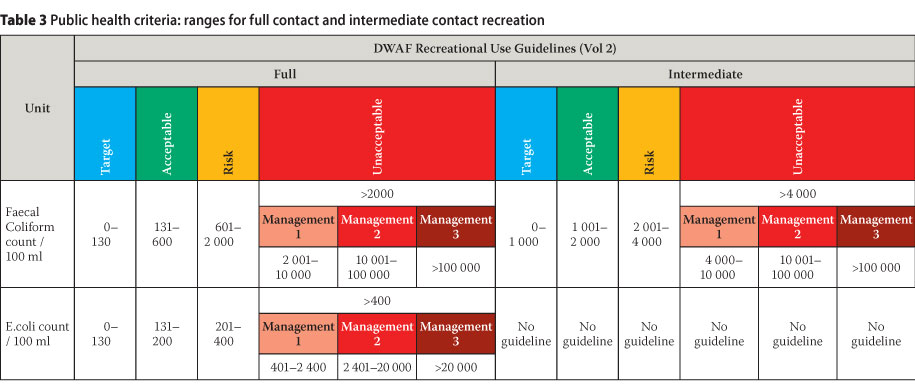
Public health criteria
While it is acknowledged that public health risks associated with recreational water may be due to the presence and interaction of a range of constituents, faecal coliforms and Escherichia coli (E. coli) are considered to be reasonable "indicator" micro-organisms to assess health risks, as these are indicators of probable faecal pollution.
The "target", "acceptable", "risk" and "unacceptable" water quality categories for faecal coliforms and E. coli for both full contact recreation (swimming) and intermediate contact recreation (canoeing, waterskiing, sailing, angling, etc.)3 were based on the South African Water Quality Guidelines (DWAF 1996a) (see Table 3).
As many of the E. coli and faecal coliform counts in the rivers within the municipal boundaries were found to fall within the "unacceptable" category (red); subdivisions of this category named Management 1, Management 2 and Management 3 were created. This is intended as a management tool to help establish the responses and actions needed, to prioritise rivers and wetlands, and to help determine the sources of pollution.
For instance, an E. coli count of 1 000 000 is likely to indicate a different source of pollution (probably a sewer overflow) than a count of 10 000, even though both are "unacceptable".
An analysis of all the E. coli counts for ten years of water quality data for all of the monitoring points in the Cape Town municipal area was undertaken to provide guidance on what the Management 1 to 3 sub-categories should be. It was found that a third of the data above the unacceptable (400 E. coli organisms/100ml) limit fell between 400 and 2 400 E. coli organisms/100ml, a third between 2 400 and 20 000 E. coli organisms/100ml, and the last third above 20 000 E. coli organisms/100ml. These divisions are purely to guide management and to assist with the allocation of resources. These limits were then used for Management 1, 2 and 3 (i.e. the sub-categories of the "unacceptable" range).
The same method was used to determine the three sub-categories of the "unacceptable" range for the faecal coliform counts.
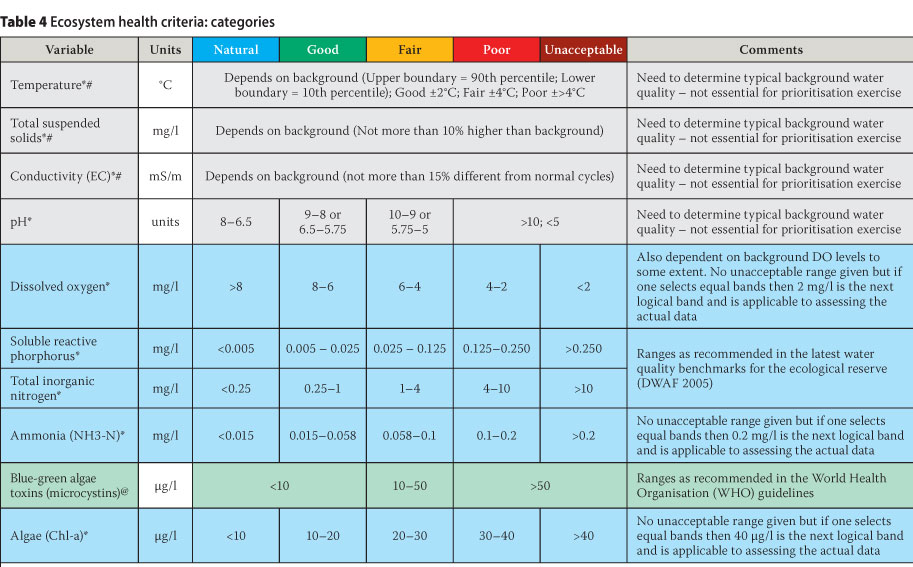
Ecosystem health criteria
The values for the various categories for the ecosystem health criteria were derived from both the South African Water Quality Guidelines (DWAF 1996b) and the ecological reserve water quality benchmarks (Jooste & Rossouw 2002). As many of the rivers in the Cape Town municipal area were found to fall within the "poor" category (red), an additional "unacceptable" category (dark red) was created as a management tool to be able to prioritise rivers, to establish the responses needed and to help determine the sources of pollution (see Table 4).
Temperature, total suspended solids (TSS), conductivity and pH are dependent on vegetation, geology etc, and the background levels of these would need to be determined for each of the water systems to establish applicable water quality ranges for each of these constituents within the various categories. Therefore, for the purposes of the project, the following constituents (highlighted in blue in Table 4) were decided upon under the auspices of the Water Quality Sub-Committee:
■ Dissolved oxygen (DO)
■ Ammonia (NH3)
■ Total inorganic nitrogen (TIN)
■ Soluble reactive phosphorus (SRP)
All of these constituents relay different information in terms of water quality, and they would trigger different management responses. They are, however, all linked and a particular intervention can often result in an improvement in all constituent concentrations.
Algae (A), monitored in some wetlands ("vleis"), was a further constituent used to assess water quality specifically within the vleis. The occurrence of blue-green algae (Cyanophyceae) - a group known to produce toxins under certain conditions - is particularly important for assessing potential health risk.
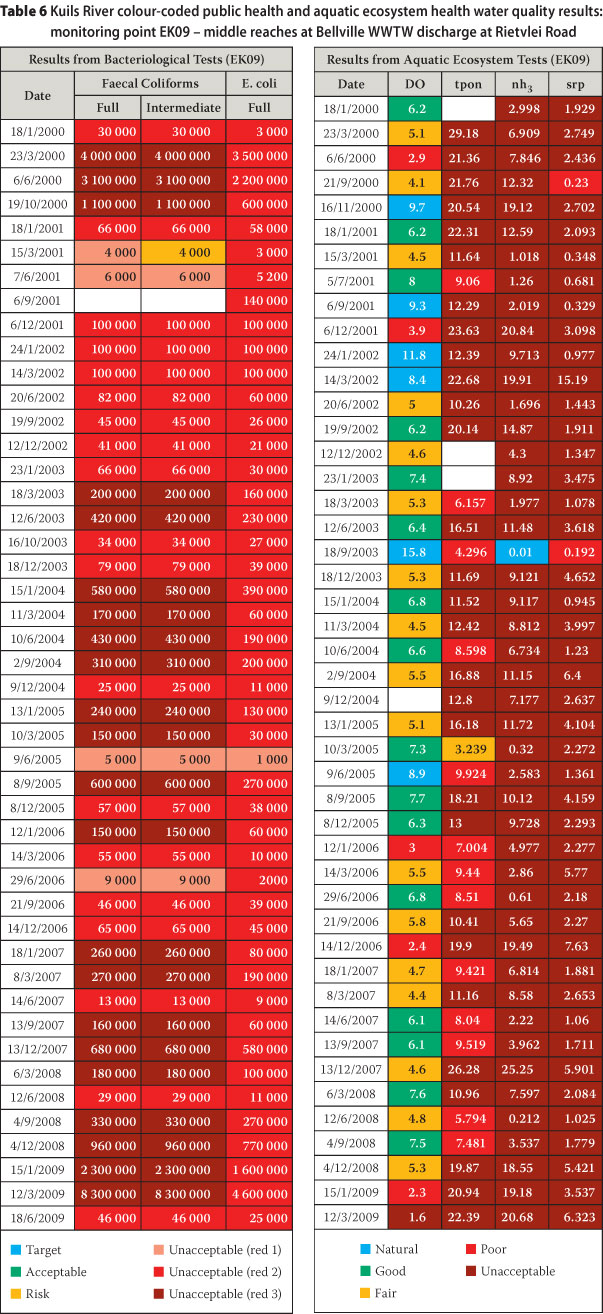
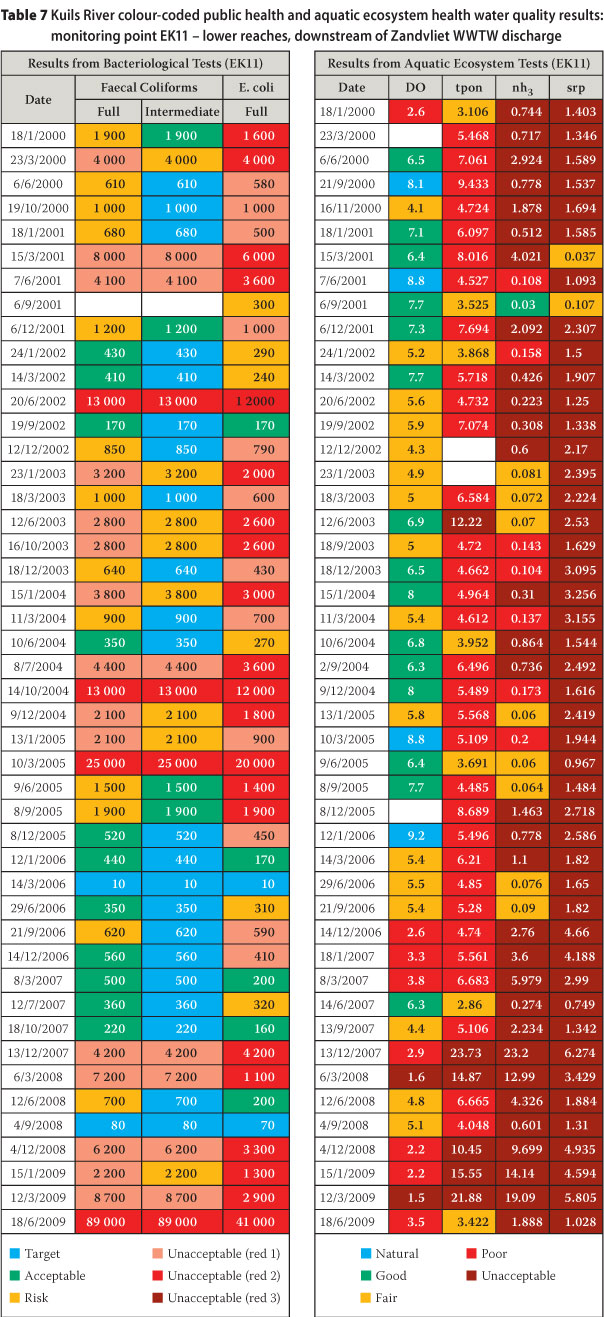
All the public health and ecosystem health water quality data for all of the monitoring points were colour-coded according to the categories discussed above.
By way of illustration, Tables 5 - 7 are examples of colour-coded quarterly data for three monitoring points along the Kuils River (a river east of the Cape Town CBD). The first monitoring point (EK19) is in the northern, upper reaches of the river, upstream of its confluence with the Bottelary River; the second point (EK09) is in the middle reaches at the Bellville Wastewater Treatment Works (WWTW); and the third point (EK11) is in the lower reaches downstream of the Zandvliet WWTW discharge point.
The tables give a visual depiction of the quality of the water at these particular points over a 10-year period, thus creating insight into possible sources of pollution. At monitoring point EK19, shown in Table 5, the "unacceptable" levels of faecal coliforms and E. coli (reds and dark reds) in recent years in an area that is relatively affluent, and where there is no industry and wastewater treatment, is perhaps indicative of leaking sewers and/or stormwater ingress or infiltration. Further downstream, at monitoring point EK09 (Table 6), the water quality worsens (more reds and dark reds) from both a public health and ecosystem health perspective. This is perhaps a result of poor quality effluent from the Bellville WWTW. Even further downstream, at monitoring point EK11 (Table 7), the water quality from a public health perspective improves slightly (more blues, greens and yellows). It can be concluded that, in contrast to the concrete-lined sections higher up in the Kuils River, the natural wetlands in the vicinity of monitoring point EK11 are able to attenuate the bacteriological pollutants. The microbiological constituents, however, remain "unacceptable".
CATCHMENT ANALYSIS AND SOURCES OF POLLUTION
An analysis of each of the catchments, rivers (including canals) or river reaches, as the case may be, depending on the water quality information from the monitoring points, was undertaken to obtain an understanding of the situation in each of these discrete units.
A Project Steering Committee (including any interested parties and all City officials involved in water quality management) was established to provide assistance in this regard. Meetings were held every two months, or as necessary, and involved workshopping of ideas, sharing of knowledge and findings, and seeking consensus between the various City Departments.
Field visits to various informal settlements, industries, wastewater treatment works, pump stations, rivers and wetlands were held to gain further insight into water quality issues around Cape Town.
A literature review of previous reports made available by the City and the evaluation of historic water quality data created insight into the state of the rivers and wetlands in the municipal area of Cape Town.
Consultations were also held with the following organisations and entities in the interest of information-sharing and future collaboration:
■ DWA
■ South African National Parks (SANParks) / Table Mountain National Parks (TMNP)
■ Swartland Municipality
■ Stellenbosch Municipality and
Cape Winelands District Municipality
■ Department of Agriculture
Stakeholder engagement was sought through a two-day workshop (16 and 17 November 2009). The workshop was held with various area managers from the City in order to determine pollution sources, to suggest possible solutions and to gain management consensus. Water quality at the various monitoring points was discussed and attendees filled out templates as per Figure 2.
Through the process the sources of pollution with respect to water quality in river systems and stormwater, which stand out from the many, many types of point or diffuse sources of pollution, were found to be the following:
■ Perceived major pollutors:
■ Blockages and overflows of sewers (whether due to extraneous waste disposed into sewers, illegal rainwater disposal or previous bad practice in construction)
■ Greywater and sewage from informal settlements
■ Sewage pump stations
■ Solid waste in water courses and such open areas
■ Wastewater treatment works
■ Perceived minor pollutors:
■ Agriculture
■ General urban runoff
■ Golf courses
■ Industry and construction
■ Canalisation of rivers4
RISK ASSESSMENT
The purpose of the risk assessment was to determine the vulnerability of a catchment to human and ecological health impacts, should there be a pollution incident or water quality-related set of circumstances. It is not a reflection of what is happening on the ground, but rather an illustration of the inherent risk (without a management system in place) as opposed to the residual risk.
The risk assessment is one of the criteria that was fed into the catchment prioritisation exercise, as described later in this paper.
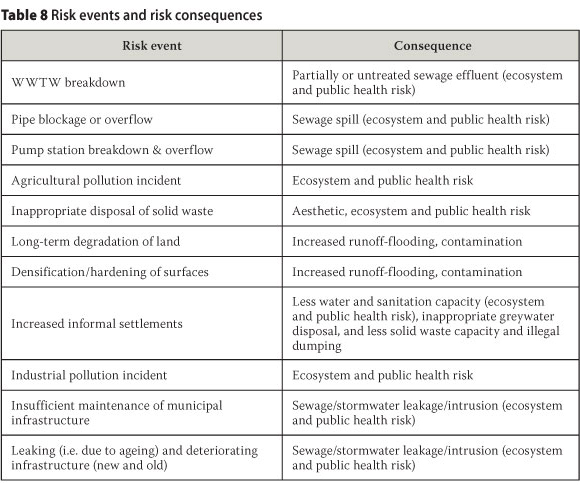
Risk events and their associated consequences were identified by the Project Steering Committee and Water Quality SubCommittee as per Table 8:
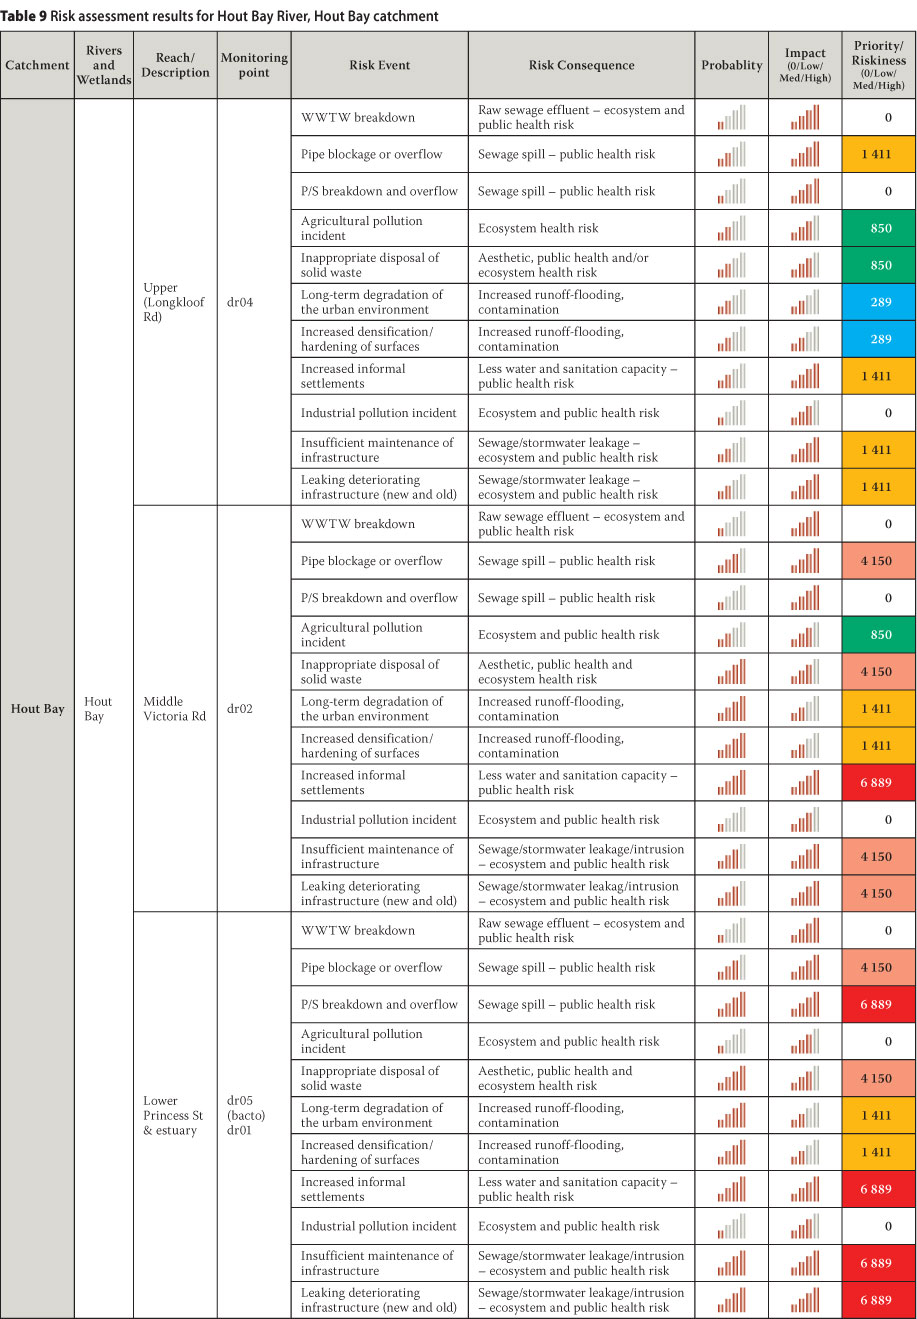
Each inland environmental monitoring point or group of monitoring points (i.e. river reach) was assessed against the above risk events. The probability of the event happening and the potential impact of that risk were determined. A resultant risk or vulnerability score was obtained per river reach, as shown in Figure 3, where a high probability and high impact equate to a high vulnerability (red); and a low probability and low impact equate to a low vulnerability (blue).
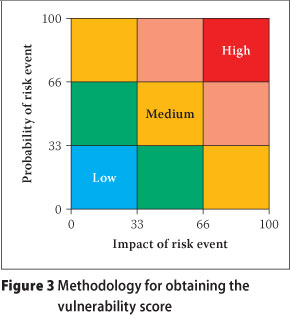
Table 9 shows how the risk assessment works, with results for the Hout Bay River, Hout Bay catchment, as an example of what was carried out for all of the City's rivers and wetlands
Overall, the risk events which resulted in the highest vulnerability scores included:
■ Ongoing and chronic risk events:
■ Deteriorating municipal infrastructure
■ Increased informal settlement
■ Insufficient maintenance of municipal infrastructure
■ Sporadic risk events:
■ WWTW breakdown
■ Pipe blockage or overflow
PRIORITISATION OF CATCHMENTS, RIVERS AND WETLANDS
The catchment prioritisation exercise was intended to assist the City's management structures with the allocation of resources. The exercise provides guidance on a starting point for the allocation of resources. Ad hoc and emergency events that affect water quality will, however, still need to be attended to as the need arises.
The methodology, scores, weighting and input criteria for the prioritisation exercise were workshopped by the Project Steering Committee, Water Quality Sub-Committee and the Consultant Team.
Input criteria
The following criteria were used to prioritise catchments:
■ Water usage (WU)
■ Public health (PH)
■ Ecosystem health (EH)
■ Risk (R)
■ Downstream impact (DI)5 [rivers] or algae (A) [wetlands]6
■ Pollution load (PL)7
Initially "cost of intervention" and "time for implementation" were included as possible criteria, but after intensive debate at the various forums, these two criteria were withdrawn. These could, however, still be considered at a later stage to further prioritise catchments for management interventions.
Point scoring system
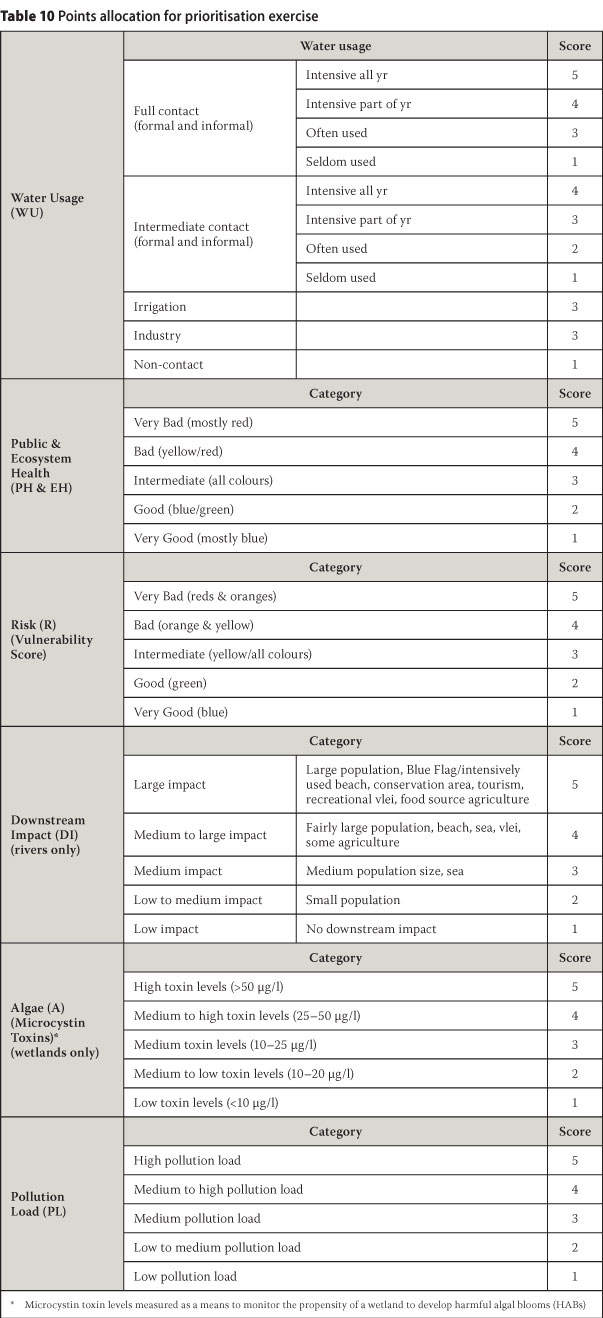
A point scoring system was then developed for each of the criteria given above. The approach for the point allocation was as shown in Table 10.
Catchments (or river reaches) with good water quality, low levels of use, low risk of negative events, low pollution loads and low downstream impacts would have a lower priority for intervention than catchments (or river reaches) where all these attributes would score badly and thus achieve a higher score.
Each monitoring point or grouping of monitoring points (i.e. river reach) was assessed according to the above criteria and given a score between 1 and 5 as per Table 10.
The points allocated for Water Usage and Downstream Impact in each of the rivers and wetlands were derived from literature, and in consultation with the Project Steering Committee, Water Quality Sub-Committee and through the Consultant Team.
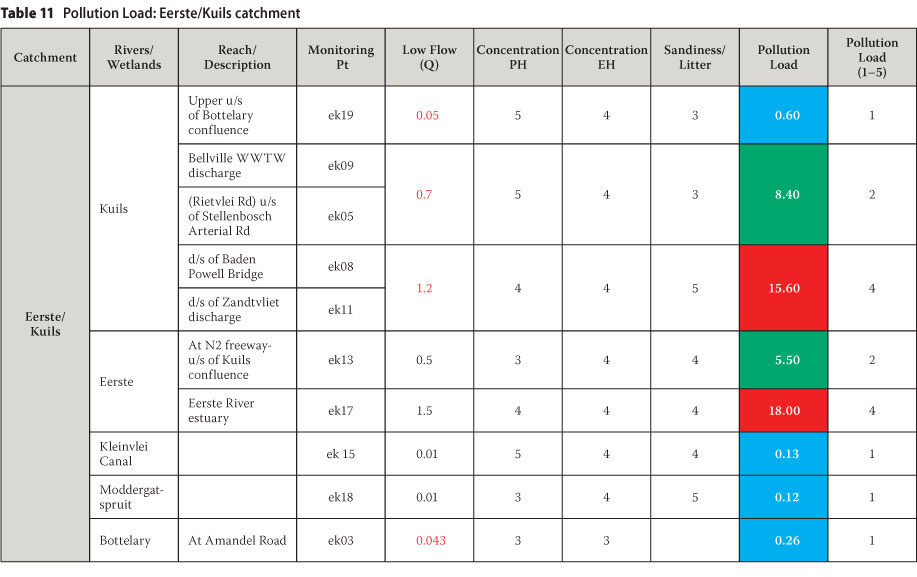
The points for Ecosystem Health, Public Health and Algae were derived from the Water Quality Results, whereas the points for Pollution Load were derived as follows:
■ Pollution Load = {Q (m3/s)*(Ecosystem Health) (points allocated to the concentration (1-5))} + {Q (m3/s)*(Public Health) (points allocated to the concentration (1-5))} + {Q (m3/s)* (Sandiness of the area and/or propensity for solid waste)}
■ Q: Flows for the various rivers and wetlands within the Cape Town municipal area were obtained from reports (Ninham Shand et al 1999), through personal communication with City officials (Wood, personal communication 2010) and from low-flow monitoring undertaken by the City in May 2002. Outstanding flows were further derived through inference of the available flows, the size of the relevant catchment and the land use in the catchment.
■ Ecosystem Health and Public Health: The points allocated for the Public Health and Ecosystem Health Water Quality concentration results (1-5), as described earlier in this paper, were utilised.
■ Sandiness of the area/propensity for solid waste: An allocation of 1 to 5 was given according to an area's sandiness and propensity for litter. A sandy area with high litter such as Guguletu obtained a score of 5 and an urban area with low litter such as Cape Town CBD obtained a score of 1.8
The final values obtained for the Pollution Load equation for each of the river reaches and wetlands ranged from 0 to 25. Values from 0 to 5 were then given a score of 1, values from 6 to 10 a score of 2, values from 11 to 15 a score of 3, values from 16 to 20 a score of 4, and values from 21 to 25 a score of 5 as the final input in the prioritisation exercise. As an example, Table 11 indicates the Pollution Load results for the rivers in the Eerste/ Kuils catchment.
■ Points for risk were derived as described earlier in this paper.
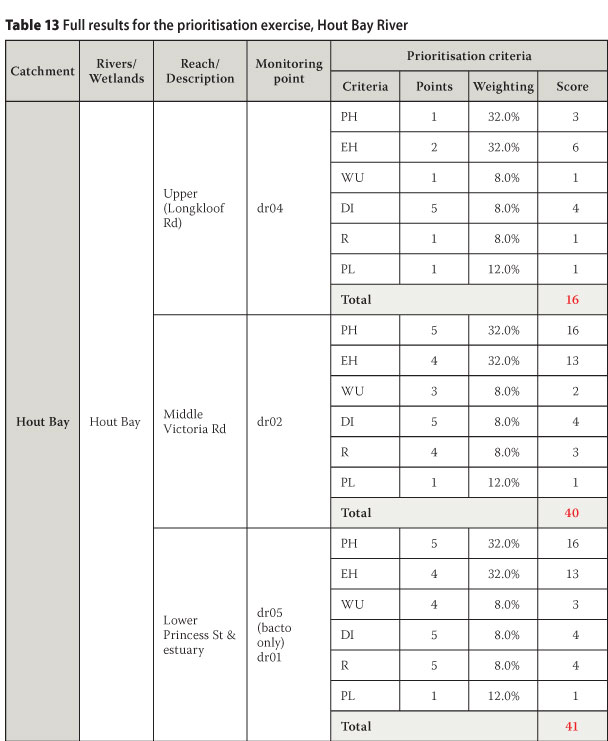
Weighting of criteria
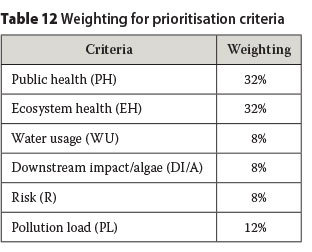
The final scores allocated for each of the criteria were then weighted as per Table 12 and added to obtain an overall prioritisa-tion score for each of the river reaches and wetlands.
The prioritisation scores for each river reach and wetland within the various catchment areas were added and averaged to prioritise entire catchments.
Priority range - colour-coding
All the final prioritisation results were colour-coded in terms of four priority ranges:
■ Red: High priority
■ Yellow: Medium to high priority
■ Green: Low to medium priority
■ Blue: Low priority
These ranges were obtained by determining the difference between the highest and lowest priority scores in the prioritisation exercise and then dividing the number range into four equal 'bands'.
Prioritisation results
Table 13 is an example of the working and final scores for the prioritisation exercise for the Hout Bay River.
Overall prioritisation results for rivers were then obtained by averaging the scores for the various river reaches where applicable. In such cases it is important to view the river prioritisation exercise holistically. In the instance of the Hout Bay River, for example, it gets a low to medium priority in the overall river prioritisation exercise; while the middle to lower reaches are a high priority and the upper reaches are a very low priority.
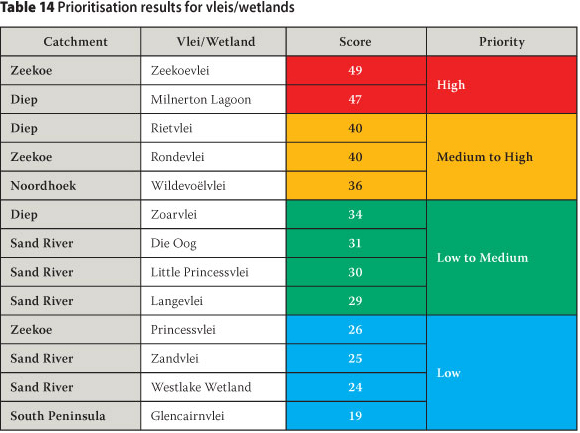
By way of example, the prioritisation results for the vleis/wetlands in the Cape Town municipal area are shown in Table 14.
Prioritisation: way forward
The prioritisation results are based on a multi-criteria model using several inputs to determine those rivers, wetlands and catchments that should receive priority attention for the proposed interventions.
The prioritisation model, although rigorous in its composition, can easily be expanded to include new criteria, or should a sensitivity analysis be required (to answer "what if?" questions).
DETERMINATION OF ADDITIONAL RESOURCES TO MANAGE POLLUTION IN STORMWATER AND RIVER SYSTEMS
The methods discussed above culminated in the determination of interventions, implementation mechanisms, resources and costs required by the City to reduce the burden of pollution in the inland water systems of the Cape Town municipal area. Proactive, sustainable measures were recommended as far as possible and were listed generally and per catchment.
It was concluded that R675.3 million in capital or once-off expenditure and R277.15 million in operational expenditure are required as additional resources to manage pollution in stormwater and river systems.
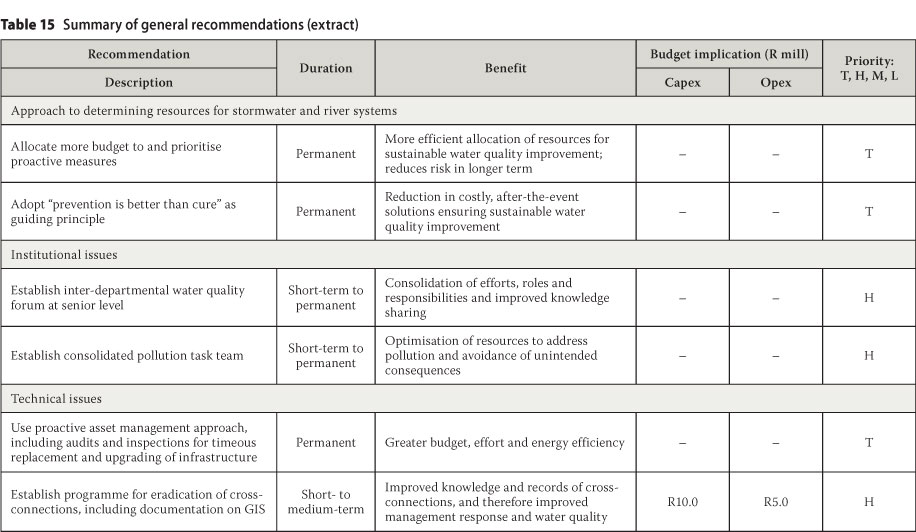
General resources applicable throughout most catchments were discussed under the following headings:
■ Institutional issues
■ Technical issues
■ Planning and policy
■ Communication and liaison
Table 15 is an extract of the summary table used to list general recommendations, indicating the duration, benefit and budget implications for each recommendation (an action and comments column have been omitted for the sake of clarity).
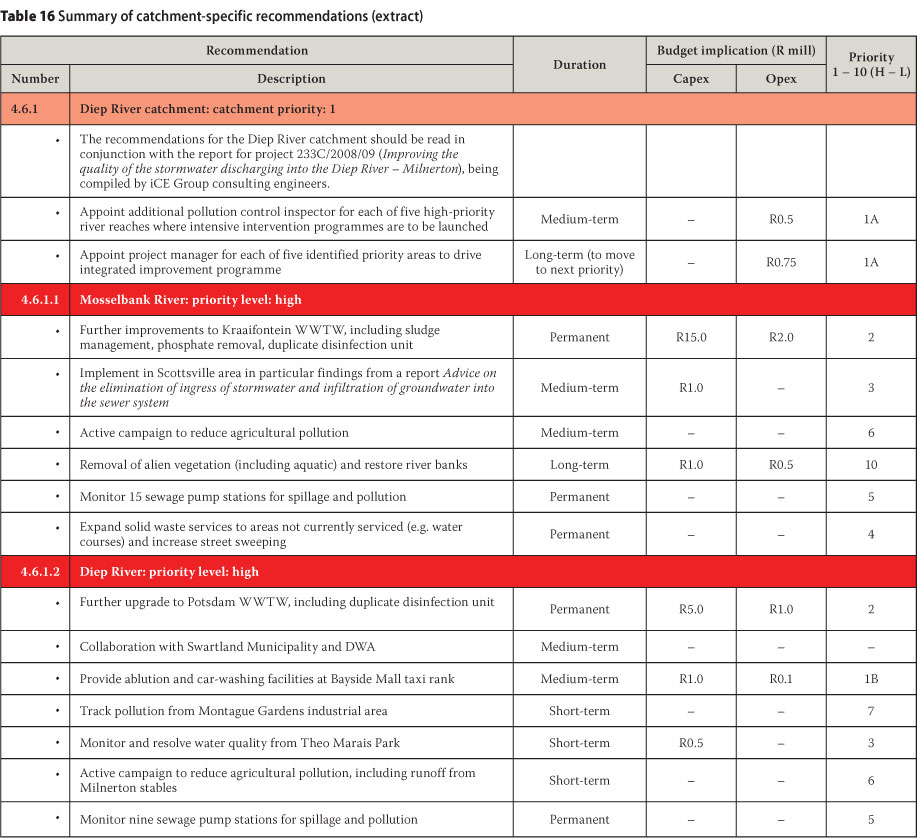
In addition to the general recommendations, the resources required to manage water pollution per catchment were discussed where catchment-specific details were necessary.
Table 16 is an extract of the summary table as used to list the catchment-specific recommendations. The table is in order of priority, as per the prioritisation exercise.
CONCLUSIONS
This paper discussed the inputs towards determining resources to manage inland water pollution in the City of Cape Town.
In the more complex realm of modern municipal engineering (where many of the issues are so-called "soft" in nature, and the problems and solutions are not straightforward) the methods discussed were instrumental in creating a holistic overview of the state of the rivers and wetlands in the City of Cape Town, highlighting the complexity of the problem and assisting to plot a way forward to provide proactive, sustainable measures for the management of water pollution.
The main obstacle was the time-consuming nature of some of the methods. The colour-coding of data and the compilation of inputs from the stakeholder workshops were particularly lengthy.
Another minor obstacle was agreeing on the points allocated for each of the prioritisa-tion criteria. There was the later realisation, however, that the system was fairly robust and slight deviations in these points made little or no difference to the ultimate level of prioritisation of the particular river or wetland.
Some novel points included: the colour-coding exercise which helped to convert vast quantities of hard, scientific data into something meaningful and tangible to all involved; the risk assessment and prioritisa-tion exercise to assist with the allocation of resources; getting inputs from a vast number and array of stakeholders; and the ultimate allotment of actions to City Managers for each recommendation.
In all, the methods discussed provided a significant contribution towards the quest to improve water quality in the City of Cape Town.
ACKNOWLEDGEMENTS
We wish to thank the following persons for their valuable contributions throughout this project:
■ Mr Abdulla Parker for his leadership, patience, unwavering commitment to the cause and passion to make a difference.
■ Mr Barry Wood for his invaluable expertise, guidance and support.
■ Ms Candice Haskins for her commitment and insights into water quality in the City of Cape Town.
■ Ms Jeanette Kane for her unfailing willingness to help with GIS expertise.
■ Mr Johan Massyn for his willingness to share his local knowledge and unique personal experiences.
■ Mr Richard Kotze for his reliability and for sharing his passion and knowledge.
Many thanks to the project team for their time, commitment to improving water quality, enthusiasm, expertise and inspiring insights:
■ Dr Jo Barnes
■ Ms Lyn Viviers
■ Mr Simon Nicks
■ Ms Toni Belcher
Sincere thanks also go to members of the Steering Committee and the Water Quality Sub-Committee, and workshop participants.
NOTES
1 The Department of Water Affairs and Forestry (DWAF) has since become known as the Department of Water Affairs (DWA)
2 Taken over time
3 It is important to note that while some of the City's rivers and water bodies are utilised for formal full and intermediate contact recreation activities (e.g. Zandvlei, Milnerton Lagoon, Zeekoevlei and Rietvlei), the majority of systems are used on a more informal basis.
4 This is an indirect pollution source, as pollution is not attenuated in canals as well as it is in natural rivers, therefore resulting in higher pollution levels. Furthermore, canals are not as aesthetically pleasing as natural river systems, and may therefore induce less considerate behaviour towards their preservation.
5 E.g. Blue Flag beaches, nature reserves, human habitation, sensitive environment, tourism hotspot etc, downstream of the water quality monitoring point.
6 While most wetlands do not have a downstream impact per se, their algal content (not measured in the rivers) had to be taken into account as it is an indication of the propensity for a vlei/wetland to develop harmful algal blooms (HAB) and therefore is significant in terms of public health. A distinction was therefore made between rivers and wetlands with these criteria.
7 It should be noted that the determination of the pollution load did not form part of the original scope of works and was later included as an ad hoc investigation, for which provision existed in the project budget.
8 Relevant data was obtained from Mr Barry Wood (CSRM, City of Cape Town).
REFERENCES
Belcher, A (Aquatic water scientist) 2010. Personal communication. [ Links ]
City of Cape Town (2008) City of Cape Town State of the Environment Report 2007/8. Cape Town: City of Cape Town, Environmental Resource Management Department. [ Links ]
DWAF (Department of Water Affairs and Forestry) (1996a). South African Water Quality Guidelines, 2nd edition. Vol. 2. Recreational uses. Pretoria: CSIR Environmental Services. [ Links ]
DWAF (Department of Water Affairs and Forestry) (1996b). South African Water Quality Guidelines, 2nd edition. Vol. 7. Aquatic ecosystems. Pretoria: CSIR Environmental Ser vices. [ Links ]
Haskins, C (City of Cape Town) 2010. Personal communication. [ Links ]
Jooste, S & Rossouw, J N 2002. Hazard-based water quality ecospecs for the ecological reserve in fresh surface water resources. Report No N/0000/REQ0000, Pretoria: Department of Water Affairs and Forestry, Institute for Water Quality Studies. [ Links ]
Ninham Shand, Southern Waters, Cape Metropolitan Council 1999. Kuils/Eerste River System evaluation of nutrient flux downstream of Bellville Wastewater Treatment Works. Report No 3028/8851, Cape Town. [ Links ]
Wood, B (City of Cape Town) 2010. Personal communication. [ Links ]
World Health Organisation (WHO) 2003. Guidelines for Safe Recreational Water Environments, Volume 1, Coastal and Fresh Waters. Geneva. [ Links ]
 Contact details:
Nicole Nel
Candidate Engineer
PD Naidoo & Associates Consulting Engineers (Pty) Ltc
PO Box 7786
Roggebaa
8012
South Africa
T: +27 21 440 5060
F: +27 21 418 6440
E: nicoler@pdna.co.za
Contact details:
Abdulla Parker
Head of Catchment Planning
City of Cape Town
Catchment Stormwater and River Management Branch
PO Box 1694 Cape Town
8000
South Africa
T: +27 21 400 1385
F: +27 21 400 4554
E: abdullah.parker@capetown.gov.za
Contact details:
Peter Silbernagl
Director
PD Naidoo & Associates Consulting Engineers (Pty) Ltd
PO Box 7786
Roggebaai
8012
South Africa
T: +27 21 440 5060
F: +27 21 418 6440
E: peters@pdna.co.za
NICOLE NEL received her BSc (Eng) in civi engineering from the University of Cape Town in 2003 and went on to complete a Masters in Development Studies in 2008. She is currently employed by PD Naidoo & Associates Consulting Engineers in their Water and Waste Water Division.

ABDULLA PARKER obtained a BSc (Eng) and ar MBA from the University of Cape Town. He is currently head of Catchment Planning for the City of Cape Town: Catchment Stormwater and River Management Branch. He previously worked for the Department of Water Affairs and Forestry where he was involved in water use management, institutional development anc cooperative governance, social and environmental strategies and waterworks management and development.

PETER SILBERNAGL (Pr Eng, CEng, Pr CPM), a past president of Consulting Engineers South Africa) graduated from UCT with a BSc Eng, GDEng and an MBA. His fields of expertise include project management, management of multi-disciplinary teams and subconsultants in general project management, but particularly in the areas of water and waste management. He has developed expertise in human resource and organisational development. He is currently a director at PD Naidoo & Associates Consulting Engineers.

