


Servicios Personalizados
Articulo
 Inglés (pdf)
 Articulo en XML
 Referencias del artículo
Indicadores

Links relacionados
-
 Citado por Google
 -
 Similares en Google
Compartir

 Permalink
Journal of the South African Institution of Civil Engineering
versión On-line ISSN 2309-8775
versión impresa ISSN 1021-2019
J. S. Afr. Inst. Civ. Eng. vol.54 no.2 Midrand ene. 2012
TECHNICAL PAPER
The discontinuity required at an air valve or vent for effective pipeline de-aeration
S J van Vuuren; M van Dijk
ABSTRACT
The location and sizing of air valves to ensure effective de-aeration of pipelines and to provide vacuum break capability was researched. Based on these findings, software was developed to evaluate gravity and pumping systems.
A sound understanding of the factors affecting the hydraulic transportation of air in a pipeline is paramount for locating air valves. When air is hydraulically transported to the position of release from the pipeline, it is necessary that the free air should be intercepted by a discontinuity and expelled via an air valve or vent arrangement.
Research information on the layout and dimensioning of the discontinuity to ensure the interception of air in pipelines is lacking. This paper discusses experimental and numerical model assessments undertaken to compile provisional guidelines for determining the dimensions of the required discontinuity.
Keywords: de-aeration of pipelines, required size of the discontinuity to capture free-moving air, air accumulator
INTRODUCTION
Engineering skill and knowledge of physical laws are required for the design of cost-effective de-aeration facilities for water conveyance systems. Misconceptions regarding the operation of air valves and their positioning have led to ineffective de-aeration of water pipeline systems. An important aspect of air valve installation that has been largely neglected is the dimensioning of the discontinuities in the pipe at which free air is intercepted, conveyed to the air valve and released under operating conditions. The inability of discontinuities to intercept air can result in situations where free air remains trapped in the pipeline and reduces the hydraulic capacity to far less than the design capacity. Another possible consequence of the inability to intercept free air is the uncontrolled release of the air that could lead to high dynamic pressures.
There are basically two types of air release valves, the so-called large- and small-orifice air valves. The differences between the two types are the operating conditions and manner in which they function. Large-orifice valves release and admit air during the charging and draining of water mains respectively, while small-orifice air valves mainly release air under operating conditions. Air valve manufacturers produce a range of pressure classes, functional layouts and sizes.
Effective de-aeration of a pipeline requires that:
■ Free air is transported hydraulically in the pipeline to a position where it can be released.
■ A discontinuity in the crown of the pipeline allows the free air to enter into a holding space (an accumulator) below the air valve; the water in the accumulator needs to be displaced by the air entering it.
■ An accumulator provides temporary storage of the intercepted air.
■ A correctly sized and located air valve or vent releases the air to the atmosphere.
The size of the discontinuity for effective interception of the air has a cost implication and hence has to be sized optimally. Since there is no deterministic relationship and no literature available to define the required sizing of the discontinuity, this aspect was researched experimentally.
EXPERIMENTAL SETUP
The purpose of the experimental investigation was to determine a relationship between the operational parameters of the pipeline and the size of the discontinuity required to intercept free air that is hydraulically transported. Tests were conducted to optimise the following parameters that influence the efficiency of air interception:
■ Mean velocities of the fluid and air bubbles
■ Relative air bubble sizes
■ Pipe slope
■ Size of the discontinuity (off-take) that leads to the air valve.
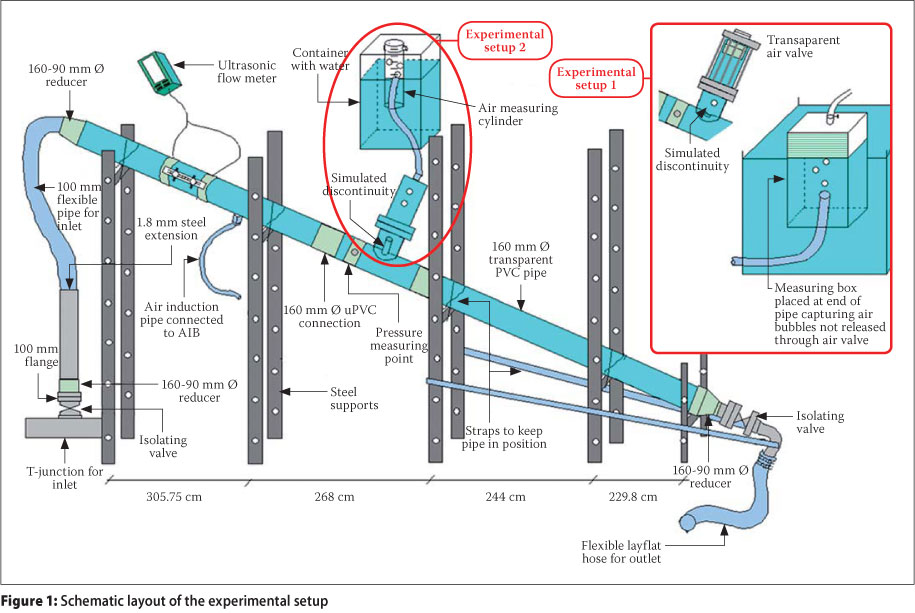
The experimental setups consisted of pipelines that were supplied with water from a constant head tank with the flow rate regulated by a gate valve. Two transparent pipes of different diameters were tested: Test 1 comprised a 110 mm nominal diameter (ND) PVC pipe and Test 2 a 160 mm ND PVC pipe. Figure 1 shows a schematic layout of the experimental setups and highlights some differences between the setups for Test 1 and Test 2.
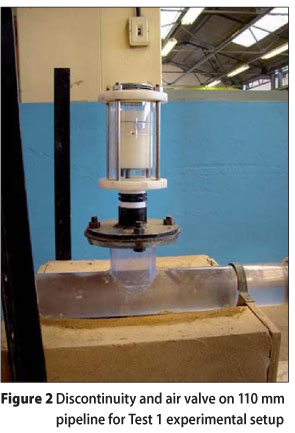
Test 1 experimental setup (110 mm ND pipe)
The 110 mm pipeline supplying water to the experimental setup was fitted with an ultrasonic flow meter. The 110 mm diameter transparent PVC pipe made it possible to track the movement of the air bubbles from the point of injection to the discontinuity where a Perspex air valve was placed on a stub, as indicated in Figure 2. Tests were conducted with various discontinuity (orifice) sizes drilled into the pipe to intercept the air.
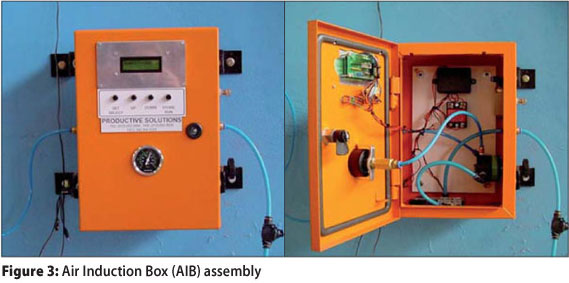
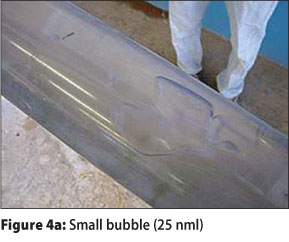
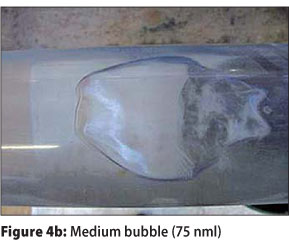
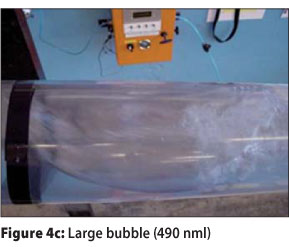
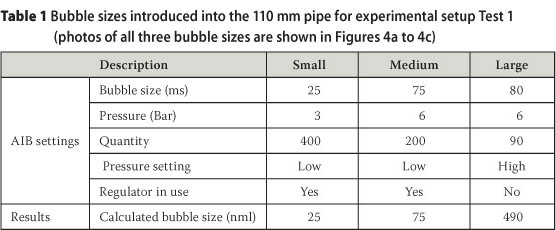
A defined quantity of air was introduced into the system through the custom-built "Air Induction Box" (AIB) shown in Figure 3. The AIB had the facility to set the bubble size (BUB), based on a specific pressure difference, by setting the opening time of a solenoid valve in milliseconds. The time delay between consecutive air bubbles could also be altered (GAP), as well as the number of air bubbles injected (QTY) for a specific test. Figures 4a to 4c give a quantitative indication of the various air bubble sizes that were used in the Test 1 setup (defined as small, medium and large measured in normal millilitres).
As indicated in Figure 1, a collector box was placed at the end of the pipeline to capture the air that bypassed the discontinuity. The volume of air intercepted by the discontinuity was calculated as the mass balance difference between the volume introduced and the volume captured by the interceptor box.
In the Test 1 setup, the pipe gradient was varied between 0° (horizontal) and 15° (downwards in the direction of flow) in steps of 2.5°. For each of the gradients, the size of the discontinuity was varied between 10% and 35% of the 110 mm pipeline's diameter in steps of 5%. The flow velocities investigated for each of the setups were 0.5 m/s, 1.0 m/s and 1.5 m/s.
Test 2 experimental setup (160 mm ND pipe)
The layout of Test 2 was similar to that of Test 1, except that a 160 mm diameter transparent PVC pipe was used. A similar series of tests was conducted for various discontinuity diameters, pipe slopes, air bubble sizes and flow velocities to determine the effectiveness of interception of the air for a range of operating conditions.
For Test 2 the capturing device shown in Figure 5 replaced the air valve of the Test 1 experimental setup. This comprised a 20 cm long equal Tee closed by the discontinuity. Discontinuity sizes of 20 mm and 67.8 mm were tested. This change in the layout of the discontinuity made the Test 2 layout more representative of the layout of normal air valve installations.
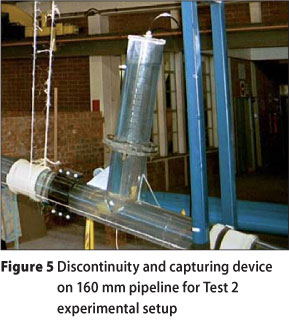
After each test the captured air was released in a controlled manner into a measuring container in which the (normal) volume of air could be determined.
The main differences between the Test 1 and Test 2 experimental setups were:
■ The pipeline diameter was increased from 110 mm for Test 1 to 160 mm for Test 2.
■ The discontinuity for Test 1 functioned as an orifice and was changed to a Tee off-take in the experimental layout of Test 2. This change represents the typical layout of an air valve installation.
■ For the Test 1 experimental setup the air that passed the discontinuity was captured and the portion of the induced air that was intercepted was calculated. For the Test 2 experimental setup, the volume of air that was intercepted was captured and measured directly.
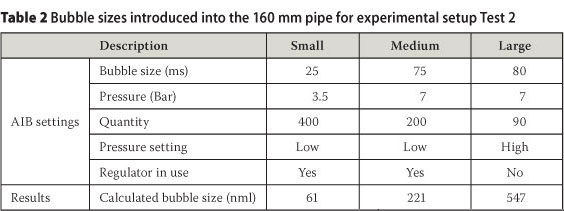
Three different bubble sizes were evaluated with the Test 2 experimental setup. The AIB was programmed to induce a certain size bubble by setting the differential pressure and the time that the solenoid valve remained open to allow a certain volume of air into the system. Tables 1 and 2 contain details of the AIB settings for the different air bubble sizes that were tested in the Test 1 and Test 2 experimental setups.
The variables that were considered in the experimental setups were the air bubble size, the water flow velocity, the pipe gradient and the size of the discontinuity.
The pipe gradients of the pipe in the tests conducted for the Test 2 experimental setup varied from 0° to 15° in steps of 2.5°. The flow velocities investigated were 0.5 m/s, 1.0 m/s and 1.5 m/s. The sizes of the discontinuity that were evaluated were 20 mm and 67.8 mm, i.e. 13% and 44% of the internal diameter of the 160 mm pipeline.
Since no literature could be sourced that defines the required size of discontinuity to intercept transported air, the Test 2 experimental setup was also modelled with a numerical Computational Fluid Dynamics (CFD) model. The results of the tests on the two experimental setups and of the numerical modelling are compared in this paper.
NUMERICAL MODELLING (COMPUTATIONAL FLUID DYNAMICS)
The objective of the numerical modelling was to determine the volume of air intercepted at a discontinuity for comparison with the results obtained from the experimental physical modelling. The commercial software package, FLUENT, which is widely used for incompressible and compressible, laminar and turbulent fluid flow problems, was used.
The modelling of multi-phase flow (air and water) was simulated by incorporation of the Volume of Fluids Model (VOF), which assumes that the different fluids (or phases) are not interpenetrating. The fields for all variables and properties are shared by the phases and represent volume-averaged values. Thus the variables and properties in any given cell are either purely representative of one of the phases, or representative of a mixture of the phases, depending upon the volume fractions.
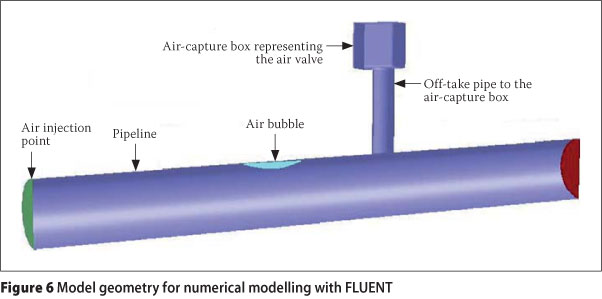
The geometry of a section of the experimental setup was generated in FLUENT's GAMBIT pre-processor, as shown in Figure 6 (Gambit 2001). It was assumed that the model is symmetrical along a vertical plane in the direction of flow, and that the swirl effects are negligible. The geometry shown in Figure 6 represents a pipeline length of 1 000 mm, a pipeline diameter of 110 mm and a discontinuity diameter equal to 35% of the pipeline diameter.
The effectiveness of the numerical simulation is largely influenced by the selected structure of the finite element grid. The grid was divided into quadrilateral and tetrahedral type cells. Cell density in the region of the discontinuity was higher to accommodate the expected high velocity gradients in the flow field. This boundary layer grid structure contributed to an accurate solution of the flow profile near the wall, where a zero velocity or no-slip condition exists at this boundary.
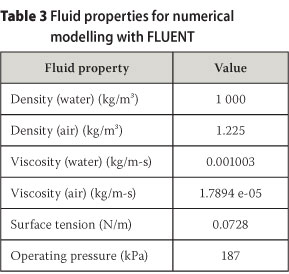
The boundaries used in this model consisted of the symmetrical vertical boundary plane which cuts the pipe in two halves, and the inlet- and outlet-boundaries. The fluid properties for the air and water phases are reflected in Table 3.
Since an unsteady multi-phase solution was desired, the following steps were taken to track the boundary between the two phases:
■ A steady state solution in the pipeline was initialised prior to the introduction of any air pockets.
■ Thereafter, an air pocket was introduced into the flow field. This represented the unsteady flow condition and was solved over defined time steps, which were in the order of 0.0005 seconds for the small bubbles and in the order of 0.076 seconds for larger bubbles.
■ The unsteady flow computation continued with similar time steps, until such time as the air pocket reached the discontinuity/outlet. During this time, the bubble would assume an equilibrium state, influenced by the mean flow velocity and buoyancy forces, introduced on account of the inclination of the gravity vector.
■ Finally, during the period when the air pocket would start to rise into the pipe connected to the discontinuity, smaller time step sizes were implemented. These smaller time step sizes ensured that the solution at each time step size converged correctly in accordance with certain criteria. Computation was slower in this step, due to two major factors, namely the use of tetrahedral grid cells, and an increase in the number of free surfaces due to turbulence and air bubble break-up into smaller bubbles in the region of the discontinuity. Time step sizes for this step in the simulation ranged between a high of 0.0002 seconds and a low of 0.00005 seconds.
Air intercepted at the discontinuity would continue to move up the "riser" pipe into the small box, while un-intercepted air pockets would continue past the discontinuity and would be released via the outlet boundary.
After the initial CFD modelling had been completed, further analyses were conducted in which the geometry and the grid generation were altered. In these evaluations, which are referred to as Phase 2, the length of the pipe was increased from 1 000 mm to 1 500 mm to improve the formation of the flow patterns before reaching the discontinuity. A further geometrical alteration was made for a single case to model the Test 1 experimental setup where the discontinuity was an orifice.
For Phase 2, hexagonal grid cells were generated with the objective of improving the accuracy and reducing the solution time. An effort was also made to ensure cell volume uniformity, as this is considered important when performing free surface simulations. The cell count for the simulations ranged from 350 to 400 thousand grid cells for the entire volume of the pipe modelled.
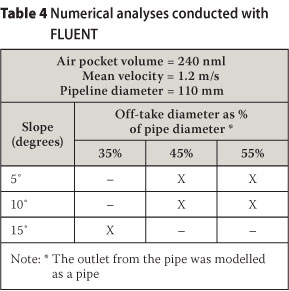
Table 4 shows the details of the different analyses undertaken as part of the Phase 2 numerical modelling.
COMPARATIVE RESULTS
Firstly, the experimental results for Test 1 (110 mm pipe) and Test 2 (160 mm pipe) are reviewed below, and thereafter the numerical modelling results are discussed.
Results of Test 1 setup for 110 mm ND pipeline
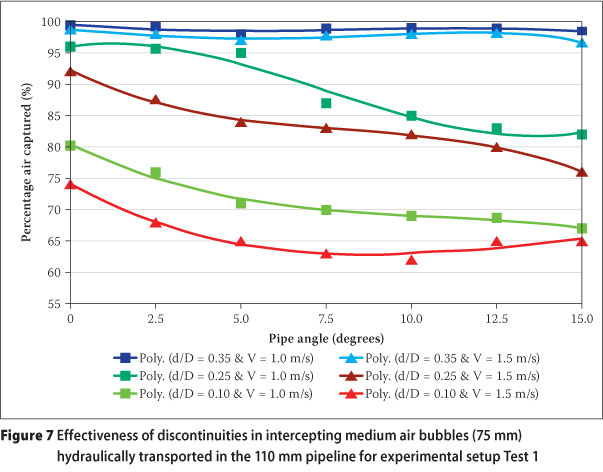
The experimental Test 1 results indicated that the effectiveness of a specific discontinuity is inversely proportional to the slope and the flow velocity. The results suggested that a discontinuity opening (d) of at least 35% of the pipe diameter (D) is required to provide an air removal efficiency of more than 95% for negative slopes up to 15° and a maximum flow velocity of 1.5 m/s.
Table 5 illustrates the efficiencies of air removal for a discontinuity opening (d) equal to 35% of the pipe diameter (D), a flow velocity of 1.0 m/s and a medium air bubble (75 nml).
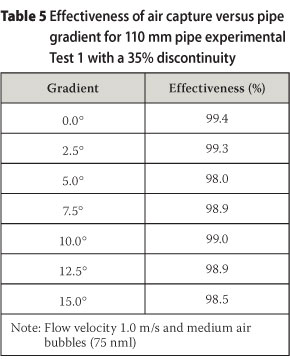
The results of the Test 1 experimental setup for velocities of 1.0 and 1.5 m/s are presented graphically in Figure 7, which clearly indicates that for a constant velocity the efficiency of air removal decreases as the pipeline gradient is increased. It was also established that the efficiency reduces for larger air bubbles on account of higher turbulence at the nose of the bubble, which creates smaller bubbles that are torn from the larger air bubbles. The small bubbles are seldom transported at the crown of the pipeline and hence reduce the efficiency of interception of these small air bubbles.
It was visually observed that smaller bubbles enter the discontinuity (orifice) more easily than the larger bubbles, due to the tendency of larger bubbles to block the discontinuity, making it impossible for the liquid to be displaced by the smaller air bubbles.
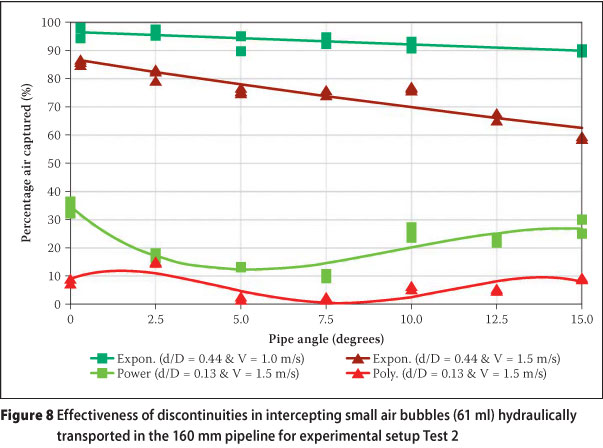
Results of Test 2 experimental setup (160 mm ND pipeline)
In the Test 2 experimental setup the discontinuity was modelled as a "standpipe or riser pipe" which closely resembles the normal installation of air valves.
The results for a discontinuity of 67.8 mm (44% of the pipe diameter) and a small air bubble (25 nml) for velocities of 1.0 and 1.5 m/s are graphically illustrated in Figure 8.
Numerical modelling results
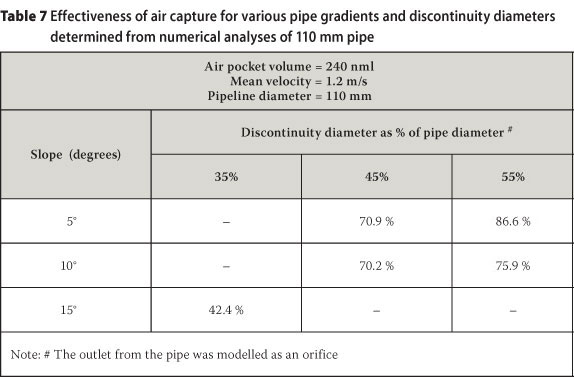
Table 6 provides the results of the numerical modelling of unsteady flow in a 110 mm diameter pipe with a large air bubble (240 nml), a flow velocity of 1.2 m/s and various slopes. The table shows the air capture efficiency.
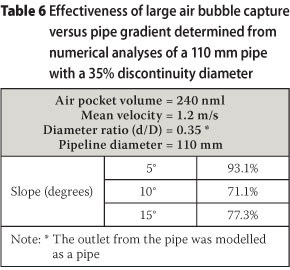
Table 7 shows the numerical modelling results for various off-take ratios (d/D) and slopes where the discontinuity was modelled as an orifice similar to that of the experimental layout of Test 1. Comparing the results for the off-take ratio of 0.35 it is evident that the discontinuity, which was modelled as a stub pipe (Table 6), would intercept air bubbles more effectively than the layout modelled as an orifice (Table 7).
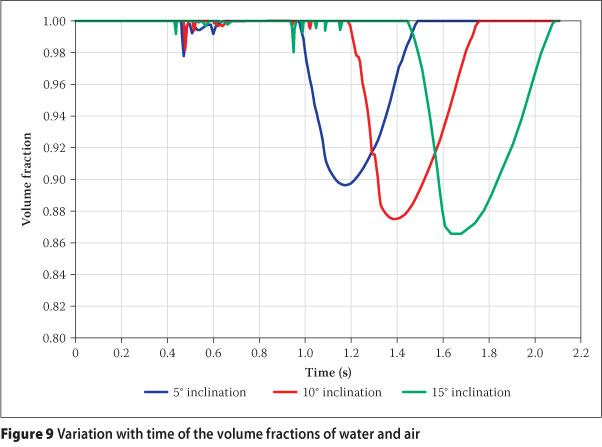
The presence of air in a pipe results in the unsteady flow of air and water in the pipe flow, which was simulated with the numerical model FLUENT. Figure 9 indicates the variations in time of the proportions of water and air when small and large air bubbles are transported past a particular cross-section of the pipe. The results in Figure 9 are shown for three slopes and for an average water flow velocity of 1.2 m/s. The speed at which large and small air pockets pass a particular cross-section can also be inferred from Figure 9. Figure 9 indicates the decrease in the velocity of air pocket movement down the pipe with increasing pipeline slope. The volume-fraction-time relationship represents the changing shape of the bubbles due to the increasing effects of buoyancy and pipeline slope. The increase in small air pocket breakaway from the fronts of the large air pockets with increasing slope is also reflected in Figure 9.
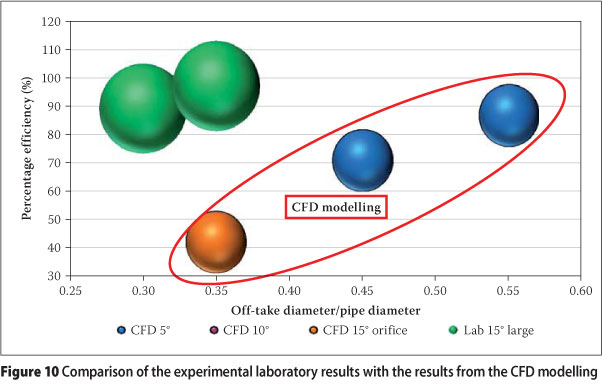
Comparison of results of the numerical and experimental modelling
Figure 10 shows a comparison of the experimental and the numerical modelling results. The air bubble sizes are indicated in Figure 10 by the (circle) sizes.
It seems that the efficiencies of air removal determined by the numerical modelling (CFD) are lower than the efficiencies measured in the experimental modelling. This difference can perhaps be attributed to the different sizes of the air bubbles which were used for this comparison.
CONCLUSIONS
The experimental work indicated that air bubbles do not always travel at the top of the pipe, and that a disturbance can create turbulence which breaks up the air pockets and mixes the air throughout the entire cross-section. This reduces the efficiency of interception of air by the discontinuity, since fewer of the air bubbles have the opportunity to enter the discontinuity.
Tests conducted on the 160 mm pipe (Test 2) indicated that a discontinuity of more than 44% of the pipe diameter was required to intercept the hydraulically transported large air bubble (490 nml) in the pipeline for a slope of less than 15° and an average flow velocity of 1.5 m/s.
The experimental results also indicated that the following aspects should be considered when a de-aeration system is designed:
■ Firstly, the size of the discontinuity should be sufficient to intercept the air bubbles, and
■ Secondly, the air which is intercepted at a discontinuity should be collected in an "accumulator" from where it is released via an air valve.
All tests on discontinuities were undertaken with negative pipe slopes. In the case of positive slopes the bubble velocity would be much greater and hence for a specific discontinuity a smaller portion of the air would be captured. Therefore a larger size discontinuity would be required for positive pipe slopes.
The complex nature of air movement in pipelines and of the factors influencing efficient air removal suggest that a conservative approach should be used when dimensioning a discontinuity to effectively intercept air bubbles in a pipeline.
RECOMMENDATIONS
Based on the understanding of the complexities associated with two-phase water and air flow, it is recommended that the experimental results are conservatively applied within the practical and financial constraints of water pipeline design. Accordingly the following recommendations are made for sizing a discontinuity for effective de-aeration during pipeline operation:
■ The minimum discontinuity required for small pipes diameters (D < 300 mm) should be set equal to the diameter of the pipe. An equal T-piece is a standard pipe fitting for these diameters.
■ For diameters between 300 mm and 1 500 mm the discontinuity should be equal to 60% of the pipe diameter, but always greater than 300 mm.
■ For pipes with diameters in excess of 1 500 mm the discontinuity should be at least 35% of the pipe diameter, with a minimum of 900 mm. It should be noted that a discontinuity to intercept air bubbles should not be sited downstream from a discontinuity in a pipeline where a disturbance could create high turbulence that would break up the air bubble and mix it into the fluid.
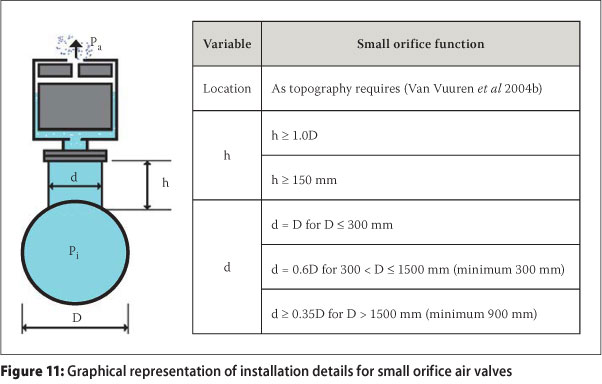
In this paper no reference was made to the required storage facility (accumulator) underneath the air valve where the air volume, intercepted by the discontinuity, should be temporarily stored for release through the small orifice (bleed) of the air valve. With regard to the required storage volume of the accumulator underneath the air valve, it is recommended that the minimum dimensions of the accumulator (standpipe) to create the storage volume should be in accordance with the details reflected in Figures 11 and 12.
For most installations with a pipeline diameter of less than 1.5 m, sufficient vertical height will be available to install an accumulator to capture the intercepted air. For large diameter pipelines it is suggested that the accumulator should be modified to also serve as an access point to the pipe.
An aspect regarding the air valve installation which was not included in this paper, but which remains an integral part of effective de-aeration, is the requirement for the controlled release of air when a pipeline is charged. Figure 13 indicates how air valves could be arranged to ensure sequential closing, to trap some air in the riser pipe so as to reduce dynamic pressure fluctuations, and to provide a cushion of air in the pipeline. Such an air cushion would reduce flow velocity differences that might arise upstream and downstream of an air valve and could cause high waterhammer (dynamic) pressures to occur when all air is suddenly discharged through the air valve.
ACKNOWLEDGEMENTS
The authors wish to thank the Water Research Commission for funding the research project, as well as the two students who contributed to the study (Miss A Kotze and Miss M du Toit).
Input from personnel at the CFDlab, University of Pretoria, who assisted with the CFD modelling (Dr D de Kock and Mr T Kingsley) is appreciated. The authors also wish to thank Dr Mike Shand, who provided valuable contributions to improve this paper.
BIBLIOGRAPHY
Fluent Inc 2001. Gambit, Version 1.3. Lebanon, New Hampshire, US. [Online] http://www.fluent.com. [ Links ]
Val-Matic 1993. Air in pipelines - Sources, system impact and removal. Elmhurst, Illinois, US: Valmatic Valve and Manufacturing Corporation. [ Links ]
Van Vuuren, S J 1995. Air in pipeline design. Part 2. Asbestos cement pipes brochure. Asbestos Cement Underground, 9. [ Links ]
Van Vuuren, S J, Van Dijk, M & Steenkamp J N 2004a. Quantifying the influence of air on the capacity of large-diameter water pipelines and developing provisional guidelines for effective de-aeration. WRC Report No 1177/1/04, Vol 1, Pretoria: Water Research Commission. [ Links ]
Van Vuuren, S J, Van Dijk, M & Steenkamp J N 2004b. Quantifying the influence of air on the capacity of large-diameter water pipelines and developing provisional guidelines for effective de-aeration: Provisional guidelines for the effective de-aeration of large-diameter water pipelines. WRC Report No 1177/2/04, Vol 2, Pretoria: Water Research Commission. [ Links ]
 Contact details:
Department of Civil Engineering
University of Pretoria
Pretoria
000'
South Africa
T: +27 12 420 2438
F: +27 12 362 5218
E: fvuuren@eng.up.ac.za
Contact details:
Department of Civil Engineering
University of Pretoria
Pretoria
0001
South Africa
T: 012 420 3176
F: 012 362 5218
E: marco.vandijk@up.ac.za
PROF FANIE VAN VUUREN obtained MBA anc PhD Engineering degrees from the University of Pretoria. He has 36 years of professiona experience and has served as a director of consulting engineering firms. Besides lecturing locally and abroad, developing air valve sizing and location software for prominent manufacturers, and publishing a number of papers, he has also contributed to various pipeline projects and has presented numerous courses on pipeline engineering. He currently heads the Water Section of the Department of Civil Engineering at the University of Pretoria.

MARCO VAN DIJK obtalnecl his BEng (Civil) degree n 1996 from the University of Pretoria. In 1998, whilst working for Ninham Shand Consulting Engineers, he completed his BEng (Hons) in Water Resources Engineering. In 2000 he joined the academic environment of the University of Pretoria as a lecturer, and in 2004 completed his MEng. He Is currently enrolled fora PhDdegree.

