


Services on Demand
Article
 English (pdf)
 Article in xml format
 Article references
Indicators

Related links
-
 Cited by Google
 -
 Similars in Google
Share

 Permalink
Journal of the South African Institution of Civil Engineering
On-line version ISSN 2309-8775
Print version ISSN 1021-2019
J. S. Afr. Inst. Civ. Eng. vol.54 n.2 Midrand Jan. 2012
TECHNICAL PAPER
A probabilistic approach for modelling deterioration of asphalt surfaces
T F P Henning; D C Roux
ABSTRACT
This paper details findings from the New Zealand Transport Agency's research project by Henning and Roux (2008). It forms part of the overall New Zealand Long-term Pavement Performance (LTPP) programme. The paper documents the development of prediction models for dense-graded asphalt (AC) surfaces and open-graded porous asphalt (OGPA) surfaces. Two models were developed including crack initiation on AC surfaces and ravelling initiation on OGPA surfaces. Continuous probabilistic models were utilised for both crack and ravelling initiation in order to predict the probability of the defect occurring. Models developed during this research use data which is readily available on network level databases, and can therefore be applied to asset management applications such as the New Zealand (NZ) dTIMS system (NZ's nationally adopted pavement management system (PMS)). Although a crack initiation model was also developed, it was not as robust as the ravelling model. Further work required includes refining of the models based on the LTPP data which includes bitumen property data. Although the developments are solely based on NZ data, there are a number of aspects applicable to the South African context. Firstly it presents a novel way of modelling the performance of asphaltic surfaces. Secondly it demonstrates some practical implications of maintenance practices that are sometimes considered for South African conditions.
Key words: asphalt, porous asphalt, deterioration model, Log it model, cracking, ravelling
INTRODUCTION
Background
The entire New Zealand (NZ) road network comprises approximately 120 000 lane km of sealed roads. Although the majority of these roads consist of thin flexible chip-sealed pavements, a large portion of vehicle kilometres travelled occurs on asphalt-surfaced pavements. On average any road carrying more than 10 000 vehicles per day would normally have an asphalt surface constructed on cemented granular pavement layers.
The New Zealand Transport Agency (NZTA) is responsible for funding 100% of the state highways and between 40-60% of the local authority roads, depending on the population size of the local council. Cost-effective management practices of the road networks are not only required by the NZTA, but are also legally required through the Local Government Act 2002 (LGA 2002).
It is realised that PMSs are essential in ensuring cost-effective maintenance planning processes. Pavement deterioration models form an integral part of these PMSs. They provide the predictive capability to forecast future maintenance needs and consequential road conditions. As a result, there has been a strong focus and investment into the NZ pavement model development in order to satisfy advanced asset management requirements specified by the NZ Local Government Act 2002. The NZ LTPP programme has been established primarily to facilitate pavement deterioration model development.
This research in context
Overlaying on existing asphalt layers is a popular maintenance treatment, given that it is more cost-effective and easier to construct compared to full-depth pavement rehabilitation. Overlaid asphalt surface layers are expected to perform well, provided that the supporting granular layers ensure sufficient foundation for the asphalt surface. It has been recognised in NZ that there is a need to improve the decision process for the rehabilitation of highways, given the variable performance results from asphalt surface overlays. Based on network analysis, Henning & Roux (2008) demonstrated that asphalt surfaces last for as little as two to four years, suggesting that these layers simply are not cost effective on sub-performing pavement layers. In contrast, where asphalt surface overlays are applied on appropriate pavement conditions, the surfaces last up to 12 to 16 years.
Although international best practice advice is not to overlay open-graded porous asphalt (OGPA) surfaces (FHWA 2005), this is a common practice in NZ. The South African guidelines do not recommend a specific approach, but emphasise the importance of life-cycle costing considerations during the decision of appropriate rehabilitation options (SABITA 1995). Again, where an overlay treatment is successful, significant savings are experienced in the construction cost, especially in traffic management. However, similar to dense-graded asphalt (AC) surfaces, OGPA surfaces have significant variations in service lives, depending on conditions such as traffic and stiffness of underlying layers.
Given that NZ authorities specify mix properties for asphalt surfaces, the actual properties are not recorded in the asset management system. Decisions on the rehabilitation and maintenance of these surfaces are made based on the condition, traffic and pavement strength data. Therefore, there is a great need to develop performance models that could forecast the behaviour of these surfaces based on the available data. In particular, these models have to be able to take account of the maintenance history, such as the thickness of existing layers.
Objectives of the research
The purpose of this research was to develop pavement deterioration models for asphalt-surfaced pavements in NZ. The models would differentiate between AC surfaces and OGPA surfaces. The models developed as part of this research included:
■ Cracking initiation
■ Ravelling initiation.
Specific goals set for this research included:
■ Given that limited data for asphalt surfaces existed on the LTPP programmes, this research had to assess the feasibility for developing the models on the basis of network level PMS data. Earlier work (Henning et al 2009) suggested that some models, especially initiation models, could be developed based on network level PMS data. However, for progression models such as rutting and roughness, more accurate LTPP data is required.
■ The models had to reflect network conditions and maintenance practices that significantly influence expected performance.
■ The robustness of the models had to be tested to determine whether there is a need for more fundamental or mechanistic asphalt performance models.
■ Ultimately, the models have to be adopted within the national PMS in NZ. Therefore, the model format and data requirements had to fit into the framework adopted.
According to the World Bank's Highway Design and Maintenance model (HDM) definition, crack initiation occurs when a surface displays cracks on more than 0.5% of its area (Watanatada et al 1987). The cracked area is calculated by multiplying the length of the crack by the width of the affected area (for line cracks the affected width is assumed to be 0.5 m). The same definition was adopted for ravelling. This paper covers the development of cracking and ravelling initiation models. The development of the rutting model has been published elsewhere (Henning et al 2009).
THE STATUS OF PERFORMANCE PREDICTION OF ASPHALT SURFACES
Crack initiation
Crack mechanisms
Cracking, in particular crack initiation, is of concern for road engineers as it is one of the early signs that a road is starting to fail. It is also important to keep the cracks sealed as pavements are significantly damaged by water ingress resulting from the cracks. There are a number of cracking mechanisms, and some of the most commonly found mechanisms on asphalt surfaces include:
■ Transverse thermal or visco-elastic fractures, as described by Molenaar (2004)
■ Reflective cracking, as described in NDLI (1995)
■ Load-associated cracking (AUSTROADS 2004).
For this research, the load-associated cracking was of greatest importance, as it is associated with most of the maintenance costs around asphalt surfaces. Load-associated cracks can manifest in a number of ways, but would normally be located within the wheel-path. In addition, they will not be straight and often are referred to as alligator cracks (or crocodile cracks in South Africa (SA)).
According to most mechanistic design methods, failure of an asphalt layer is associated with crack initiation. At this point, the magnitude of tensile strain at the bottom of the asphalt layer is exceeded. Factors that affect the strain conditions at the bottom of the asphalt layer include:
■ Stiffness of the asphalt layer
■ Thickness of the asphalt layer
■ Support from underlying layers, including the subgrade.
Existing modelling approaches for cracking
Three main crack initiation prediction model types are described in the literature review, and these can be categorised according to:
■ Deterministic models, which are based on performance data
■ Mechanistic design models
■ Probabilistic-Mechanistic models. The most widely used deterministic models are the HDM-III and HDM-4 crack initiation models (Watanatada et al 1987). Separate crack initiation model forms exist in HDM-4 for stabilised and granular bases, and for original/new surfaces and resurfaced surfaces.
The mechanistic models are used for design purposes and predict the overall life expectancy of a pavement, and not necessarily the performance of the surface over time. A typical example of such a model is presented in the AUSTROADS design guide (2004).
Bouwmeester et al (2004) used the traditional risk approach of likelihood and consequence, combined with a stochastic model, to define the risk of cracking in asphalt pavements. The advantage of this approach is that it allows for variability in loading and in the existing strength of the asphalt pavement. A graphic presentation of this approach is given in Figure 1. The graph shows a probability of failure, and does not necessarily defect initiation. In addition, it is observed that the probabilities are low, with the 50th percentile not reached after an age of 50 years.
Ravelling initiation
Ravelling mechanism
Ravelling of OGPA is primarily caused by the failure of the inter-particle bonding provided by the bitumen film. This may result as normal fatigue of the layer due to repetitive vehicle loading or due to premature failure as a result of poor design or construction processes. For example, if the stiffness of the bitumen is too high, it is expected to be brittle and therefore more prone to breaking. Figure 2 illustrates a meso-scale model of OGPA in an attempt to model ravelling by investigating the bitumen bonding between particles.
It can be observed from Figure 2(b) that the contact area between particles is relatively small, thus the allowable tensile stresses have to be relatively low. It was concluded that ravelling is caused by a combined effect of binder condition, climate and traffic loading.
Modelling ravelling initiation
Ravelling models developed specifically for OGPA pavements are limited. Three approaches in particular were identified in the literature:
■ The World Bank HDM ravelling model is given by NDLI (1995). It is a deterministic model format that provides a generic ravelling model for all surfaces. Each surface type has associated model coefficients that give the relative performances for the surface types.
■ Mo et al (2008) developed a complex model to predict ravelling of OGPA surfaces by analysing the stresses of the inter-particle bitumen film (see Figure 2). A finite element analysis model was developed to determine the stresses and strains resulting from loading on the OGPA layer. Resulting from this process, the Von Mises stress in the material was developed for the various loading times (Mo et al 2008).
■ In her paper, Miradi (2004) explains a process for modelling OGPA layers using neural networks. A neural network is a self-learning system that considers all factors in predicting an outcome of a variable. These predictions are based on historical outcomes that were caused by a certain contribution of the factors considered. With the introduction of more data, the system learns more about the decision process and the main drivers causing the various outcomes. The main benefit of this system is that it can accurately provide relative weightings and the relative importance of each factor that may influence an outcome of the system. The neural network process, however, does not provide a prediction model that can be used in an external system, with the relation of each factor to the independent variable remaining unclear. Based on this study, the most significant factors influencing ravelling were surface age, asphalt density, bitumen properties and void space.
Conclusions from the review
The main conclusion from the review was that the probabilistic modelling approach considered for NZ (Henning & Roux 2008) was consistent with some of the international trends in deterioration modelling. It is clear that there is a common need to understand risk of failure more than just the condition deterioration over time.
It was also observed that most models, especially for OGPA surfaces, relate to design aspects and data, whereas the intent to develop a model for NZ can be applied to asset management application using in-service data. Studies on OGPA pavements revealed that most factors influencing ravelling are related to the asphalt make-up. It seems that these studies do not include any long-term performance factors such as traffic, or the pavement underlying these layers. Therefore the challenge with this research was to establish the appropriateness of models based on network level data only, or whether more fundamental information would also be required.
RESEARCH DATA
For reasons stated the full data set used in this research consisted of typical network management data. The primary focus was on OGPA surfaced pavements used on the NZTA State Highways in both the Auckland and Wellington regions. Approximately 2 500 sections (data points) were taken from both these networks with typical section lengths being between 200 to 600 m. The network summary is presented in Table 1. Observations from the table include:

■ The traffic volume typically ranges between 3 000 (25th percentile) vehicles per day to 16 000 (75th percentile). This is much lower traffic volumes compared to typical traffic volumes on urban motorways in SA.
■ The mean modified structural number (SNP) is approximately four, which is typical for a flexible granular pavement with asphalt surfaces. It is, however, much lower compared to the expected SNP for asphalt-base pavements typically used for motorways in SA.
■ Typical surface configurations on these pavements normally include a dense-graded asphalt surface of between 30 to 50 mm with an open-graded top surface of between 30 to 40 mm. One would therefore expect that the total surface thickness should vary between 60 to 90 mm for sections where no overlay treatment has been applied. With the median thickness being approximately 80 mm, it thus suggested that a substantial portion of the network had been overlaid, especially since the 75th percentile thickness is 100 mm. Note that an isolated number of asphalt-base pavements were excluded from the data set.
■ The surface age varied between four and eleven years for the 25th and 75th percentile respectively. NZ normally follows a much more frequent resurfacing regime compared to SA. The available data on the network includes full annual high-speed data (HSD) that includes roughness, rutting, texture, and skid resistance (SCRIM), together with full video logs. Cracking and local defects are assessed annually according to the NZ visual rating process, which requires a detail walk-over assessment on rating lengths (50 m long). This equates to approximately a 10% sample of the network. For this research, only the rating sections were analysed, given that both cracking and ravelling are recorded according to the visual rating. For most defects such as cracking and ravelling, the length of wheel-path affected is recorded. According to the NZ rating method, the degree of the defect is not recorded. Initiation of the defect was considered once more than 0.5% of the total area was affected by the defect (Henning 2009).
PREDICTING CRACK INITIATION OF AC SURFACES
The analysis approach
The model development consisted of the following main steps:
■ Data compilation and validation. Given that these analyses relied on network-level PMS data, there was significant manual data processing and validation involved. For example, maintenance records were compared with performance data to ensure that surface ages and composition items were accurate.
■ Statistical exploratory analysis. This was performed in order to gain a better understanding of the over-all data composition, such as distributions and apparent relationships between factors. Although the final model form and factors were finalised during the regression, the exploratory analysis was invaluable for building an understanding of the mechanism leading to the defects.
■ A forward and backwards step-wise regression for model solution. This was performed on the data using the R statistical software (R Development Core Team 2009).
Exploratory statistics
The purpose of the exploratory statistical analyses was to better understand the behaviour of the pavement. An outcome of these analyses is to identify primary predictors of cracking and to investigate potential interrelationships between variables. All analyses were undertaken for both AC and OGPA surfaces, but a satisfactory crack initiation model was developed only for AC surfaces. Only these results are presented in this paper.
Figure 3 illustrates the distribution of crack initiation for AC surfaces. It can be observed that more than 50% of the surfaces have cracked before the age of five years. The crack initiation normally occurs well in advance of any pavement failure as such. The figure also suggests that there is a potential logarithmic relationship between surface age and crack initiation.

Figure 4 illustrates an example of a plot that investigates the combined influence of two factors on the crack initiation of AC surfaces. In this figure, the influence of the number of surface layers and cracked status of the previous surface is investigated. This figure suggests that there is a strong relationship between time to crack initiation and the number of surfaced layers and the cracked status of the previous surface.
Given the significant cost of traffic control on motorways, overlay treatments are used more frequently than mill-and-replace treatments. There is an intuitive view that these surfaces are short-lived, especially when the previous surface was already cracked. Figure 4 confirms this view.
Similar plots were developed for most of the other variables and resulted in the following observations:
■ The traffic loading in equivalent standard axles did not have a significant influence on crack initiation time. However, when the traffic loading and structural strength were considered as a combined factor there was a stronger relationship.
■ Another factor that showed a potential relationship included the radius of curvature, which is derived from the falling weight deflectometer's (FWD) deflection bowl.
Resulting model
A Logit model type was adopted for the AC crack initiation. This model is an empirical-probabilistic type model and forecasts a binary outcome (0 or 1) that is predicted based on the factors that influence the outcome. For example, for a given year, the Logit model predicts whether a surface will be cracked or not, based on the relevant variables that influence cracking. Formally most commonly used in survival-type predictions in the medical and material engineering fields, this model type has since been used with great success in pavement performance prediction models (Henning & Roux 2008). The following expression illustrates how the Logit model (in a linear format) is converted into a proportional model (Chambers & Hastie 1992):

Where:
p The probability that a specific event (Y) occurs (1), p(Y=1)
a The coefficient of the constant term (a would be the intercept, which was not included in this model)
B The coefficient of the independent variable(s)
x The independent variable(s)
The resulting model from the regression analysis is given by (refer to Table 2 for model statistics):
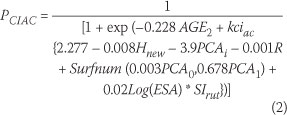
Where:
Pciac The probability of the surface being cracked AGE2 Surface age (years) kciac Calibration coefficient (between 0 and 1)
Hnew The thickness of the top surface layer (mm) PCAi The cracked status of the previous surface layer (i = 0 for false, 1 for true)
Surfnum Number of surface layers (each asphalt surface layer is counted)
ESA Average Equivalent Standard Axles per day (as per AUSTROADS (2004) definition) R Radius of curvature (mm) of pavement based on FWD during the latest survey
SIrut Structural rutting index is a measure of pavement capacity based on subgrade strain criteria and is similar to the HDM-SNP. (Stevens et al 2009). Typical range for the SIrut varies between 1.5 for low volume roads and as high as 8 for highway sections.
The following observations are made from the resulting model and model regression results:
■ All factors, except (R), had a significance of less than 0.001.
■ The calibration coefficient kciac is a user-defined constant that allows for varying climatic regions within NZ.
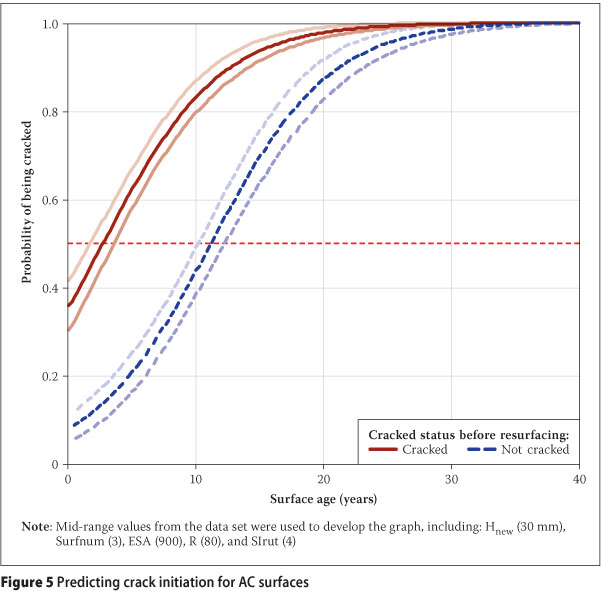
Figure 5 presents the outcome of the model developed for AC surfaces. It shows the probability of a surface to be cracked at a given surface age, for two instances. The solid line is the probability of cracking for overlaid surfaces with the previous surface being cracked. The broken line represents the probability of cracking for new pavement surfaces or overlays on un-cracked surfaces. The lighter lines represent the 95th percentile confidence level for both these instances.
Figure 5 suggests that an asphalt overlay on top of an existing cracked surface will not take long before cracking again. On average, new surfaces will take more than ten years before crack initiation. These results correspond well with intuitive ranges as reported from practitioners managing NZ networks.
Figure 6 was developed in an attempt to test the ability of the model to correctly predict crack initiation (approximately 1 800 data points were used from the same data set). This figure plots the number of sections being correctly or wrongly predicted as either cracked or un-cracked in the data set. For example, true positive means that the predicted and actual status of the surface is cracked. True negative means that in both the predicted and actual instances the surface is un-cracked. In total, the model was capable of correctly predicting the cracked status of pavements for 62% of cases. This figure therefore suggests a weak, though acceptable result for the AC surfaces, although it indicates that some improvement would be desirable. It is believed that this improvement would be possible through considering more detailed data on LTPP sections including some bitumen properties. The success rate on other networks was comparable with this result; on some networks the cracked status was predicted correctly for as high as 70% of the cases. It is, however, not as high as the model on chip seals where success rates of up to 85% were achieved on some networks (Henning 2009).
PREDICTING RAVELLING INITIATION FOR OGPA SURFACES
Motivation for developing a ravelling model
Most urban motorways are surfaced with OGPA surfaces in order to reduce noise pollution and improve driving conditions when raining. Ravelling of OGPA surfaces is one of the primary drivers of maintenance decisions on motorway networks (SABITA 1995). Ravelling in itself may start as a small defect, but it is the signal of more serious defects to follow. Secondary defects of ravelling include a higher degree of ravelling, delamination and potholes.
For this reason, the occurrence of severe ravelling on OGPA surfaces would trigger an overlay or mill-and-replace within one year. Without a doubt the modelling of ravelling on OGPA surfaces is essential in the maintenance decision support system for motorway networks.
Note that a crack initiation model was also considered for OGPA surfaces. However, the resulting model was not accepted, given that it forecasted results outside of expected ranges. Closer investigations revealed that the visually rated cracking was inconsistent between years.
Exploratory statistics
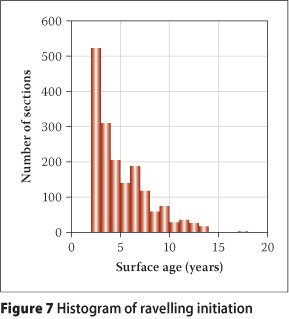
Figure 7 illustrates the distribution of ravelling initiation for OGPA surfaces. It is observed that more than half of sections start to ravel before a surface age of five years. It is accepted that ravelling is a strong function of the construction quality. In addition to that, the open matrix of OGPA surfaces poses a high probability of ravelling, regardless of the bitumen properties and construction practices. It is further observed that ravelling initiation has an approximately logarithmic relation with the surface age. This suggests that similar to crack initiation, ravelling can also be modelled using a Logit model format.
The exploratory statistic revealed that the significant factors predicting ravelling initiation included:
■ Surface age
■ Traffic loading
■ Pavement strength
■ Cracking.
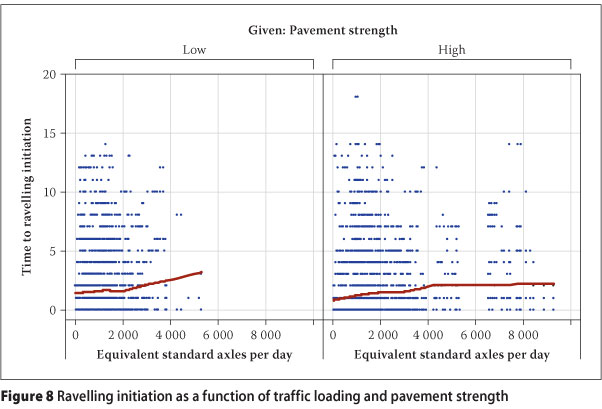
Figure 8 illustrates the relationship between traffic loading and ravelling initiation for pavements classified into two strength categories, high and low strength, based on FWD filed measurements. It is observed that there is not much difference in ravelling initiation times for the two strength classes. However, it was of concern to observe a positive trend between traffic loading and time to ravelling initiation. This means that roads will ravel faster for lower volume roads compared to higher volume roads. This is opposite to what would be expected.
It has been demonstrated in other studies that asphalt has a 'self-healing' characteristic in terms of the way it ravels (Mo et al 2008). For increased traffic volumes, the bitumen would be in constant elasto-plastic motion and would not undergo hardening, which happens with more infrequent loading. For the purpose of this research, it was assumed that the traffic/ravelling initiation trend is valid for the intended model.
Resulting model
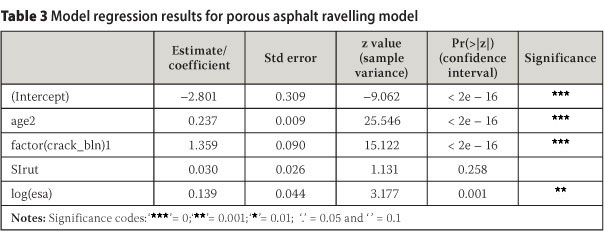
A model similar to that for crack initiation modelling was developed for ravelling. The model is given by (refer to Table 3 for the model regression results):
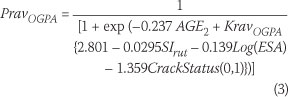
Where:
PravOGPA The probability of an OGPA surface ravelling AGE2 Surface age (years)
ESA Average Equivalent Standard Axles per day (as per AUSTROADS (2004) definition)
SIrut Structural rutting index is a measure of pavement capacity based on subgrade strain criteria and is similar to the HDM-SNP. (Stevens et al 2009).
Typical range for the SIrut varies between 1.5 for low volume roads and as high as 8 for highway sections. CrackStatus Crack status of the surface at present, where 0 is un-cracked and 1 is cracked KravOGPA The calibration coefficient for OGPA surfaces (between 0 and 1)
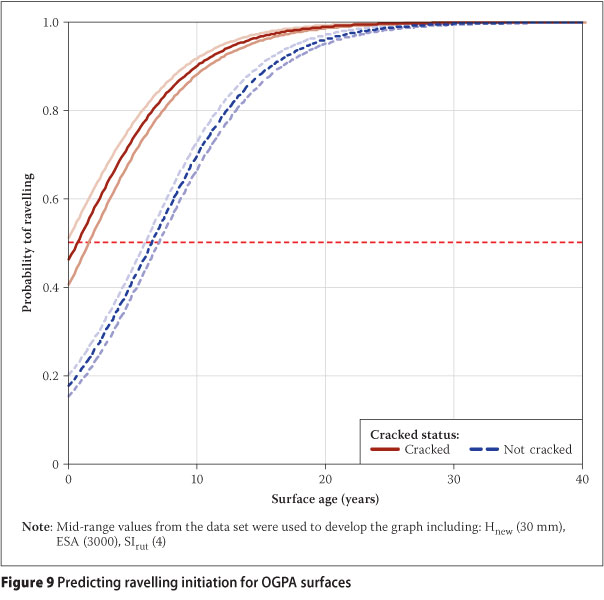
All of the variables, except for the structural rutting index, had a significance of less than 0.01. The resulting model is graphically presented in Figure 9. This figure shows the probability of ravelling initiation for the given age of the surface. Two instances have been presented - the solid line predicts ravelling probability for cracked surfaces, and the broken line for surfaces without any cracking. The lighter lines represent the 95th percentile confidence limits. For non-cracked surfaces the expected (50th percentile) ravelling initiation was approximately seven years. These results are consistent with statistical analysis on the Auckland motorway network which suggests the average life expectancy of an OGPA surface to be approximately six years (Henning et al 2008b). It is accepted that maintenance is triggered soon after ravelling initiation.
It is recognised that OGPA surfaces on NZ networks do not perform as expected, due to maintenance practices that allow overlays of surfaces. While this reduces maintenance costs, it also increases the likelihood of ravelling. With the addition of the ravelling model in the PMS system, it would be possible to calculate real life-cycle cost aspects related to this practice.
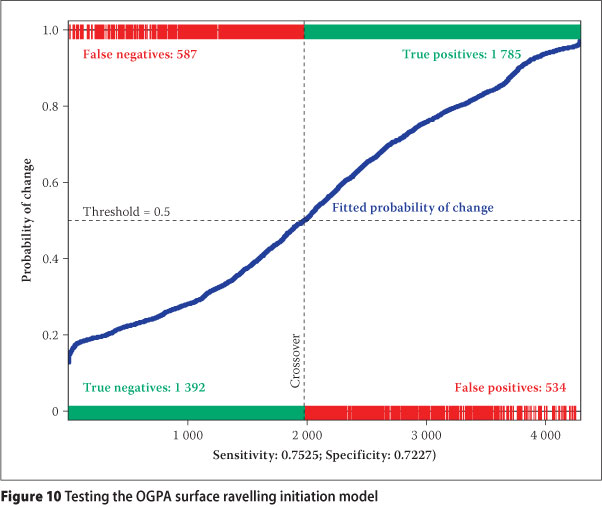
The model was tested on the actual behaviour on the network data and the results are depicted in Figure 10. In this instance, the correlation between the predicted and actual ravelling was as high as 75%, which is a satisfying outcome. It is therefore recommended to adopt the model into the NZ dTIMS system.
APPLICATION OF CONTINUOUS PROBABILISTIC MODELLING
Earlier model development in NZ highlighted a number of benefits of probabilistic modelling, including (Henning 2009):
■ The continuous probabilistic model format in a broad sense is more robust in its approach, because, instead of predicting a discrete point of defect initiation, it predicts a distribution of the defect initiation. Sometimes, understanding the defect initiation distribution in itself assists in understanding network trends. For example, if one assumes that crack initiation occurs on all surface ages at a given percentage, and that all surfaces are cracked at an age of say ten years, a discrete model may suggest that the average crack age is at say six years. However, the probabilistic model would suggest that the probability of cracking for ages more than six years would be higher than 50%, but at a surface age of ten years, all surfaces could be expected to be cracked. Naturally, the latter approach provides more useful information in a decision process.
■ The model format provides significant flexibility to the PMS modelling process as it gives a probability of failure throughout the life of the pavement. For example, it is possible to predict different network level risk profiles as a result of different maintenance investment strategies. Also, it is possible to intervene (schedule maintenance actions) at different probability levels for different road classes. In other words, a different risk appetite can be adopted for different road classes.
The continuous probabilistic models, in particular the Logit model, have some limitations, including:
■ Because the Logit model forecasts a binary outcome (i.e. either a one or a zero), normal over-all goodness of fit techniques becomes problematic.
■ Practitioners are initially reluctant to accept a probability forecast, given that their frame of reference may still refer to typical time outcomes such as expected life or time to cracking initiation. Referring to a probability seems to be less tangible to them.
However, users of the PMSs normally embrace the concept, as it has significant advantages to the traditional descriptive models.
In adopting the initiation models developed through this research, it is recommended that users calibrate these to their respective networks. This calibration involves two parts, including:
■ The model has to reflect the behaviour of a given network. The calibration coefficients provided have to be adjusted in order to maximise the model accuracy for a given network. Standard calibration coefficients were developed for NZ.
■ The model adoption also has to be calibrated to local practices. For example, in some regions with more moisture-sensitive subgrades, resurfaces may be considered at lower crack initiation probabilities than in other regions with more stable subgrades.
CONCLUSIONS AND RECOMMENDATIONS
The objective of this research was to develop pavement deterioration models for application on asphalt pavements. In addition to that, it was aimed to differentiate between the performance of AC and OGPA surfaces.
The research successfully achieved the development of the following models:
■ An empirical-probabilistic model that predicts the likelihood of cracking of an AC pavement. The testing of this model suggests that further refinement to this model would be required.
■ An empirical-probabilistic model forecasting the probability of ravelling of an OGPA pavement. This model was more robust compared to the crack initiation model, and adoption into the PMS was recommended.
This research also attempted to develop a crack initiation model for OGPA surfaces, but the results were not satisfactory. Visually-rated cracking data on OGPA surfaces was inconsistent between years.
Based on the findings of this research it is recommended that the robustness of the models could be enhanced significantly by including the binder types or classification between modified and un-modified binders. It is recommended further that this information becomes a standard data item for network data sets. Naturally, with the data becoming available, the models need to be reviewed to reflect this change in data.
Given the significant cost of traffic control on motorways, overlay treatments are used more frequently than mill-and-replace treatments. There is an intuitive view that these surfaces are short-lived, especially when the previous surface was already cracked. This research highlighted a number of performance and cost issues related to the overlay practices used on OGPA pavements. Best-practice guidelines should therefore be developed that will ensure life-cycle cost efficiencies from these maintenance practices. For example, there should be some criteria related to the maximum number of OGPA surfaces. There also need to be some criteria on minimum stiffness of the pavement before any OGPA surface is considered.
Most of the developments in this research had to rely on network data since the LTPP data on asphalt pavements was limited. The expansion of the LTPP programme to include more asphalt pavements is essential. Although satisfactory results were obtained from this research, it would be necessary to validate the findings based on accurate long-term performance data. Once more appropriate data becomes available the model needs to be refined, especially a crack initiation model for OGPA surfaces. The literature review has indicated that the inclusion of bitumen/mix properties would greatly enhance the robustness of the models.
Despite the identified limitations, the model tests confirmed that the models could greatly enhance decision processes, and it is recommended that the models be incorporated in the NZdTIMS system. It greatly enhances the appropriateness of the maintenance decision-making based on life-cycle costing considerations.
ACKNOWLEDGEMENT
The authors acknowledge the New Zealand Transport Agency for funding this research project.
REFERENCES
AUSTROADS 2004. Pavement design: A guide to the structural design of road pavements, 2nd rev. ed. ARRB Transport Research. Sidney, Australia: Standards Association of Australia. [ Links ]
Bouwmeester, D, Huurman, M, Tolman, F & Molenaar, A A A 2004. Probabilistic analysis of fatigue cracking in asphalt pavements. In: A Millien, C Petit & I L Al-Quadi (Eds), Cracking in pavements, Bagneux, France: RILEM Publications, pp 657-664. [ Links ]
Chambers, J M & Hastie, T J (Eds) 1992. Statistical models in S. Chapman and Hall: London. [ Links ]
FHWA (Federal Highway Administration) 2005. Quiet pavement systems in Europe. International Technology Exchange Program, US Department of Transport. [Online] http://international.fhwa.dot.gov/quiet_pav/index.cfm, retrieved 18 January 2009. [ Links ]
Henning, T F P 2009. The development of pavement deterioration models on the state highway network of New Zealand. PhD thesis, Auckland, New Zealand: University of Auckland. [ Links ]
Henning, T F P, Dunn, R, Costello, S & Parkman, C 2009a. A new approach for modelling rutting on the New Zealand State Highways. Road & Transport Research 18(1): 3-18. [ Links ]
Henning, T F P, Jooste, S & Hallet, J 2008b. Network analysis of the Auckland motorway network. NZTA Auckland Alliance, Auckland: Transit New Zealand. [ Links ]
Henning, T F P & Roux, D C 2008. Pavement deterioration models for asphalt-surfaced pavements in New Zealand. NZ Transport Agency Research Report 367, Wellington, New Zealand. [ Links ]
LGA 2002. New Zealand Local Government Act 2002 No 84. Wellington, New Zealand. [ Links ]
Miradi, M 2004. Development of intelligent models for ravelling using a neural network. Proceedings, IEE International Conference on Systems, Man and Cybernetics, The Hague, Netherlands. [ Links ]
Mo, L T, Huurman, M, Wu, S P & Molenaar, A A A 2008. 2D and 3D meso-scale finite element models for ravelling analysis of porous asphalt concrete. Finite Elements in Analysis and Design. [Online] http://www.sciencedirect.com, [ Links ]
Molenaar, A A A 2004. Presentation on cracking in asphalt pavements. Delft University of Technology, Netherlands. [Online] http://www.citg.tudelft.nl/live/pagina.jsp. [ Links ]
NDLI 1995. Modelling road deterioration and maintenance effects in HDM-4. Final Report ADB BETA 5549, Vancouver, Canada. [ Links ]
R Development Core Team 2009. R: A language and environment for statistical computing. R Foundation for Statistical Computing [Online] http://www.R-project.org. [ Links ]
Southern African Bitumen Association (Sabita) 1995. The design and use of porous asphalt mixes. Manual 17, Roggebaai, South Africa: Sabita. [ Links ]
Stevens, D, Salt, G, Henning, T F P & Roux, D C 2009. Pavement performance prediction: A comprehensive new approach to defining structural capacity (SNP). Proceedings, NZTA & NZIHT 10th Annual Conference, Rotorua, New Zealand. [ Links ]
Watanatada, T, Harral, C G, Paterson, W D O, Dhareshwar, A M, Bhandari, A & Tsunokawa, K 1987. The Highway Design and Maintenance Standards Model, World Bank. Baltimore, US: John Hopkins University Press. [ Links ]
 Contact details:
Department of Civil and Environmental Engineering
University of Auckland
Private Bag 92019
Auckland Mail Centre
Auckland 1142
New Zealand
T: +64 9 3 73 7599 x 8818'
F: +64 9 3 73 7462
E: t.henning@auckland.ac.nz
Contact details:
MWH New Zealand Ltd, Auckland
PO Box 12-941
Penrose
Auckland
New Zealand
T: +64 9 580 4583
F: +64 9 580 4514
E: derek.c.roux@nz.mwhglobal.com

DR THEUNS HENNING is a senior lecturer at the University of Auckland, specialising in the areas of Asset Management and Pavement Design. Theuns received his ME (Transportation) from the University of Pretoria, South Africa, anc completed his PhD at the University of Auckland, New Zealand. He has been involved η the nation-wide implementation of pavement management systems (dTIMS) in New Zealand (NZ) since 1999, and is still managing the dTIMS project in NZ on behalf of IDS Ltd. He was responsible for the establishment of the Long-term Pavement Performance (LTPP) programmes for both the state highways and local authority roads in NZ. Based on these programmes, he completed the development of pavement deterioration models for NZ roads.

DEREK ROUX has been an asset management engineer with MWH New Zealand Ltd since 2006. He previously worked for the Gauteng Provincial Government in South Africa in their pavement management section. As part of the MWH national asset management team, and as a national deterioration modelling expert for MWH NZ, Derek has gained experience in the compilation, management and analysis of data for use in various completed research projects for the NZ Transport Agency (NZTA). His involvement with deterioration modelling extends not only to road network analyses, and pavement deterioration model development, but he is also frequently nvolved in knowledge transfer workshops with clients and consultants, thereby enhancing understanding and ownership.

