


Services on Demand
Article
 English (pdf)
 Article in xml format
 Article references
Indicators

Related links
-
 Cited by Google
 -
 Similars in Google
Share

 Permalink
Journal of the South African Institution of Civil Engineering
On-line version ISSN 2309-8775
Print version ISSN 1021-2019
J. S. Afr. Inst. Civ. Eng. vol.53 n.1 Midrand Apr. 2011
TECHNICAL PAPER
Bulk water distribution power supply failures
D T Nel; J Haarhoff
ABSTRACT
This paper considers the probability of power supply failures at bulk water distribution pump stations. Electrical power supply is important within the bulk water distribution environment, particularly when pumping is required. Reliability of power supply is commonly expressed by means of indices, such as amongst others, the SAIDI and SAIFI indices as defined by the Institute of Electrical and Electronics Engineering (IEEE). These indices are used to calculate the probability of failure associated with power supply. Data was obtained from a number of sources and used to benchmark the reliability of South African power supply against that of other countries. The reliability of power supply from seven South African Water Board (Rand Water) pump stations is also analysed. Limited data seems to be available that allows one to quantify the reliability of pump systems, taking into account the reliability of the various system components.
Keywords: bulk water supply, pump stations, power supply, failure probability reliability
INTRODUCTION
The reliability of bulk water distribution could be compromised by a number of factors. An obvious cause of service interruption is failure of the pipeline itself, while a less commonly encountered cause may be contributed to the failure of a pipeline that passes through a dolomitic area subject to sinkhole formation. For comprehensive risk management, bulk water suppliers have to consider all the possible factors that could impact on their reliability of supply, and find quantitative estimates of each.
This paper considers yet another risk factor, namely the probability of power supply failure at bulk water distribution pump stations. Electrical power supply is important within the bulk water distribution environment when pumping is required. Power supply failures have different causes, such as power generation plant failures, distribution system faults, substation failures, blown transformers, faulty fuses, faulty breakers, lightning storms, natural disasters, etc. From the perspective of the bulk water supplier, these distinctions are of less interest. This paper will therefore only consider their combined effect.
POWER SUPPLY RELIABILITY MEASURES
The characterisation of electricity supply performance is based upon the determination of the number of interruptions per year, as well as the sum of the duration of all interruptions during one year (Bollen et al 2006). Network operators use different definitions to express power supply reliability.
The electricity utility industry commonly uses the Institute of Electrical and Electronics Engineering (IEEE) reliability indices to track and benchmark power supply reliability. The IEEE Standard 1366-2003 defines reliability indices to foster uniformity in the development of electricity distribution reporting practices by utilities (Eto et al 2008).
The two most frequently used indices are the System Average Interruption Duration Index (SAIDI) and the System Average Interruption Frequency Index (SAIFI), denoted by Equations (1) and (2) respectively (Bollen et al 2006; Chatterton et al 2009, Jadrijev et al 2009). The SAIDI index gives information about the average time that customers are interrupted during a period of one year, and it is commonly referred to as the customer minutes of interruption. The SAIFI index gives information about the average frequency of sustained interruptions per customer. Both these indices are normally reported over a time period of one year for a particular area.
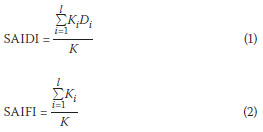
where
| SAIDI | is the System Average Interruption Duration Index in minutes/ consumer/year |
| SAIFI | is the System Average Interruption Frequency Index per year | |
| i | represents an interruption event | |
| Di | is the restoration time for each interruption event. | |
| Ki | is the number of interrupted custom ers for each sustained interruption event during the reporting period | |
| K | is the total number of customers served for the area considered | |
The SAIDI and SAIFI indices, as defined above, allow utilities to integrate their performance across their entire customer base. The customer base can be demarcated into different areas, or may consider different groups of customers to assess and benchmark how they experience interruptions of different durations at different times. The indices do not portray an individual customer's unique experience with respect to power supply reliability, but represent average values as experienced by all the customers in an area. From the perspective of any single customer, however, the interest narrowly lies in the availability of power to that customer at any given moment. The SAIDI index then simplifies to the total minutes of interrupted power per year, and the SAIFI index to the number of interruptions per year.
Nevertheless, the SAIDI index can be used to calculate the average availability of the power supply at a point, and consequently also the probability of failure, as shown in Equations (3) and (4).
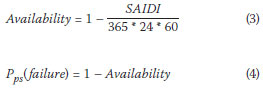
The SAIFI index can be used to calculate the average frequency of power supply outages at a point, as follows:
POWER SUPPLY RELIABILITY DATA
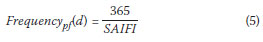
Data obtained from a number of sources that quoted values related to the SAIDI and SAIFI indices are given in Table 1, namely:
Equations (3), (4) and (5) were used to calculate the power supply availability, probability of failure and the frequency of power outages in respect of the data obtained, and the calculated values are reflected in Table 1.
The data provided above should be used to compare performance and reliability of power supply within an area, or even amongst different areas. It is not recommended that it is used to compare the performance of utilities with one another, since a range of issues could influence the values of the reported indices, such as local conditions, the network characteristics, the available operations and maintenance personnel, the definition of an interruption event, climate, etc.
THE OVERALL RELIABILITY OF PUMP UNITS
The reliability of a pump unit is a function of a number of sub-system reliabilities (Cullinane 1985). Cullinane indicated that the reliability of a pump unit, in essence a series system, can be calculated by applying Equation (6).
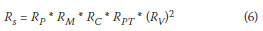
where
| Rs | is the reliability of the pumping system |
| RP | is the reliability of the pump |
| RM | is the reliability of the motor |
| RC | is the reliability of the control unit |
| RPT | is the reliability of the power transmission |
| Rv | is the reliability of the valves (1 intake and 1 delivery valve) |
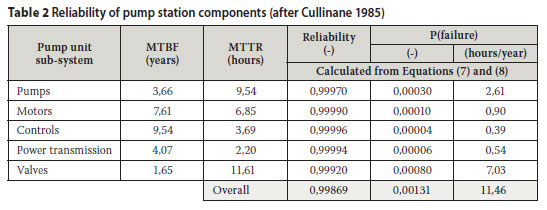
Table 2 (Cullinane 1985) quotes failure values reported in 1981 by Schultz, namely the mean time between failure (MTBF) and mean time to repair (MTTR), related to the different pump system components. From these parameters, the reliability (R) was calculated using Equation (7), while the probability of failure was calculated using Equation (8).
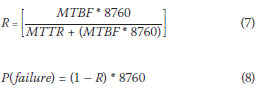
where
| R | is the reliability of the relevant component of the pump system | ||
| MTBF | is the mean time between failures in years MTTR is the mean time to repair in hours | ||
| P(failure) | is the probability of failure of the power supply in hours/year | ||
BULK WATER DISTRIBUTION PUMP STATION POWER FAILURES
To provide more detailed insight into the reliability of power supply of a bulk water supply utility, data collected by Rand Water (a Water Board in South Africa) from seven of its pump stations was obtained. Rand Water uses the term "trip" to define any failure of a pump unit to operate (irrespective of the cause). Trips, in turn, are divided into internal and external trips (Fredericks et al 2007).
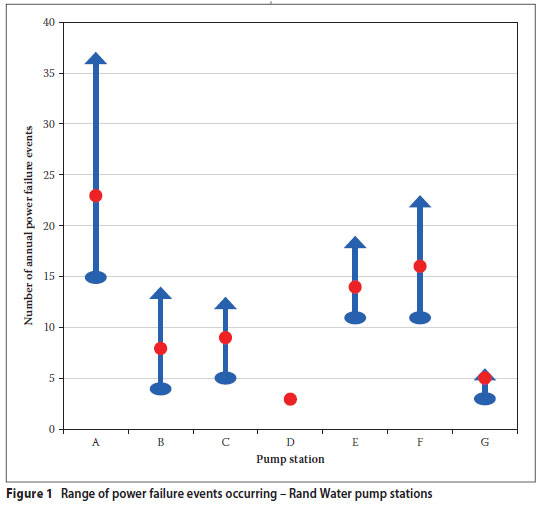
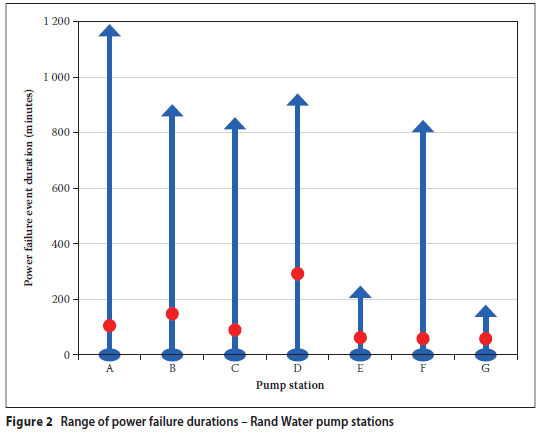
The power supply failure data (external trips only) for seven of Rand Water's large pump stations (Mbula 2008) were analysed and the results are summarised in Table 3. For strategic reasons, the names of the pump stations are omitted.
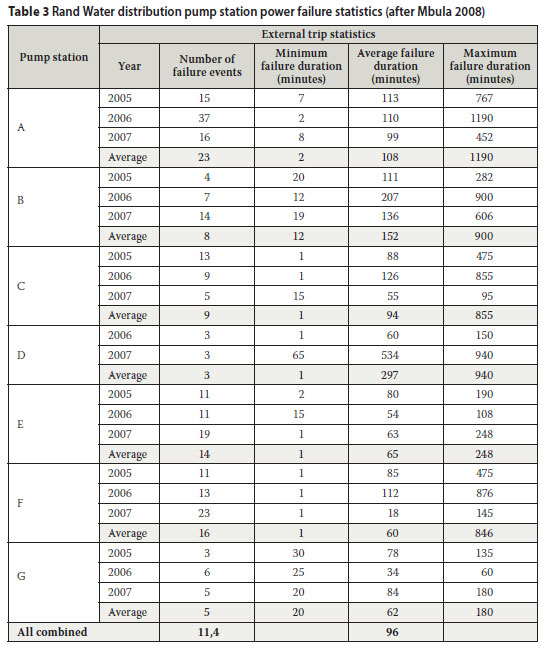
The minimum, average and maximum values in respect of the number of power failures and the power failure durations recorded at the various pump stations are presented graphically in Figures 1 and 2 respectively. Over all the pump stations the average number of external trips was 11,4 per year, and the average duration of the external trips was 96 minutes.
The data presented in Table 3 was used to determine the probability of failure associated with power failures at the Rand Water pump stations using Equations (7) and (8). The results thereof are presented in Table 4.
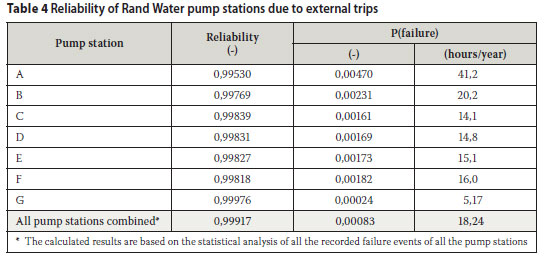
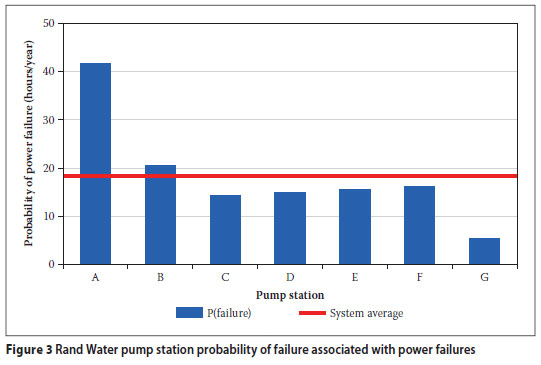
The probability of failure of power supply at the various pump stations, compared to the system average, is shown graphically in Figure 3.
THE STOCHASTIC NATURE OF POWER FAILURES
The data above merely presents the probability of a power failure and the duration thereof as single values. However, the statistics presented graphically in Figures 1 and 2 indicate that both the number of external trips, and their duration, show variability. This aspect is important for modelling power failure events within a hydraulic network simulation program using Monte Carlo simulation methods.
Monte Carlo simulation methods require that each stochastic variable be described by its cumulative frequency distribution function. A logical model of the system being analysed is repeatedly analysed, each time with a different set of input parameters for every time step. The selection of each of the stochastic input parameter values is made randomly, governed by the cumulative frequency distribution function of each variable parameter and its performance criterion.
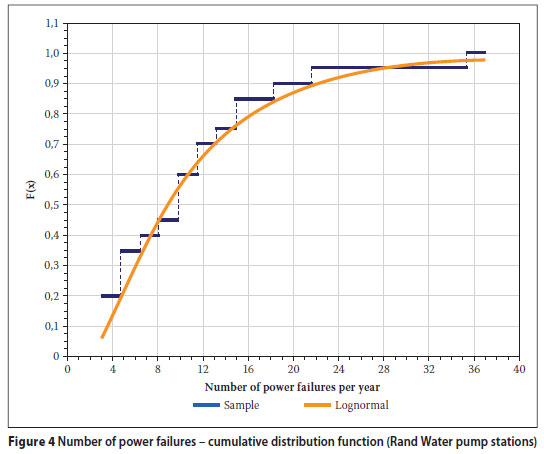
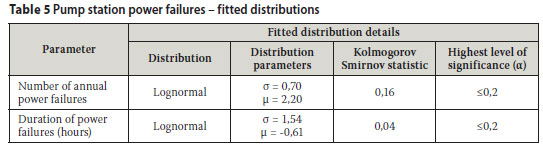
The power failure data was analysed using a software program (EasyFit Professional Version 5.1) to select the numerical function that provides a good fit in respect of the number and duration of the power failures respectively. The Kolmogorov-Smirnov test was applied to test the goodness of fit of the data compared to a range of hypothesised distribution functions. The Kolmogorov-Smirnov statistic is based on the largest vertical difference between the theoretical and empirical cumulative distribution function. The program also calculates the so-called P-value, based on the test statistic, and this value is used to verify the threshold value of the significance level in the sense that the null hypothesis (H0) will be accepted for all values of a less than the P-value. The respective cumulative distribution functions for the sample data, as well as the selected statistical distributions in respect of the number and duration power failure events, are reflected graphically in Figures 4 and 5 respectively. The parameters of the probability density functions that may be used to simulate the pipeline failure rates in respect of the power failure duration and the number of power failure events occurring, as well as the Kolmogorov-Smirnov statistic and the value of the highest significance level associated with the fitted distribution functions, are given in Table 5. The variables in the lognormal distributions are to the base e.
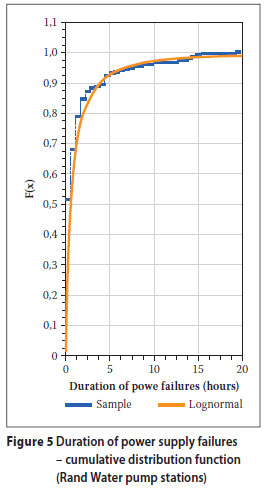
Further credence to the lognormal fit obtained is given by the analysis of Zaretski et al (2009). The authors reported on largescale power failures recorded in the USA during the period 1984 to 2006, using data obtained from the Department of Energy's Information Administration website and the North American Electric Reliability Council Disturbance Analysis Working Group. The incident data was analysed in terms of the MW load lost. A total of 861 power failure events were reported, and in 277 events the load loss exceeded 300 MW. It was found that the lognormal distribution provided a good fit for the data set. This finding is significant if one were to assume that a linear relationship exists between the MW load lost and the duration of the power failure event. Incidentally, the Rand Water external trip duration data also follows a lognormal distribution.
SUMMARY AND CONCLUSIONS
This paper considered the effect of power outages on bulk water distribution. Reliability of power supply is commonly measured making use of indices, such as amongst others, the SAIDI and SAIFI indices as defined by the Institute of Electrical and Electronics Engineering (IEEE). It was shown how the SAIDI and SAIFI indices can be used to determine the power supply availability, the power supply probability of failure, as well as the frequency of power supply failures at a point.
Data was obtained from a number of sources and used to benchmark the probable extent of power supply reliability. The probability of failure of power supply varied, but generally fell within a range of less than approximately 8,3 hours per year in developed countries. In South Africa, a developing country, the probability of failure of power supply is of the order of approximately 50 hours per year.
The reliability of power supply from seven of Rand Water's (South Africa) pump stations was obtained and analysed, and it was noted that:
REFERENCES
Bollen, H J & Hager, M 2006. What is reliability? -Reliability and reliability indices in the viewpoint of the network operator and the viewpoint of the customer. Electrical Power Quality and Utilization, II(2): 14-20. [ Links ]
Chatterton, B, Koch, R & Mccurrach, R 2009. Highvoltage (HV) and extra-high-voltage (EHV) network interruption performance measurement and reporting: Development of the NRS 048-8 specification. Proceedings, Cigre 2009, 6th South African Regional Conference, Paper P303. [ Links ]
Cullinane, M J 1985. Reliability evaluation of water distribution system components. In Waldrop, W (Ed), Hydraulics and Hydrology in the Small Computer Age, New York: ACE, Vol 1, pp 353-358. [ Links ]
Eskom 2007. Annual Report - Directors' report: ensuring reliable electricity supply. http://www.eskom.co.za [ Links ]
Eto, J H & LaCommare, K H 2008. Tracking the reliability of the U.S. Electric Power System: An assessment of publicly available information reported to State Public Utility Commissions. Sacramento, CA: Ernest Orlando Lawrence Berkeley National Laboratory, Report LBNL-1092E, 11. [ Links ]
Fredericks, M & Khan, F 2007. Report on plant reliability for Rand Water for 2006/2007. Internal Rand Water report, 9 July, Johannesburg: Rand Water Head Office. [ Links ]
Jadrijev, Z, Majstrovic, M & Majstrovic, G 2009. The relationship between reliability indices and daily load curve. Proceedings, CIRED, 20th International Conference on Electricity Distribution, Prague, 8-11 June, Paper 0909. [ Links ]
Mbula, V 2008. Rand Water pump stations external trip data. Maximo data sheets. Johannesburg: Rand Water Head Office. [ Links ]
Ramakrishna, S V & Gupta, S A 2009. Reliability of power supply. http://www.powermin.gov.in/distribution/apdrpbestprac/CEA-reliabiliy.pdf [ Links ]
Zaretski, R L, Briggs, W M, Sterling, M & Shankar, M 2009. Distributions of large-scale power outages: Extreme values and the effect of truncation. International Journal of Power and Energy Systems, 29(1): 65-72. [ Links ]
 Contact details:
PO Box 112
Meyerton 1961
South Africa
T: +27 (0)16 362 0772 F: +27 (0)86 550 3544
E: daclc@absamail.co.za
Contact details:
PO Box 524
Auckland Park 2006
South Africa
T: +27 (0)11 559 2148 F: +27 (0)11 559 2395
E: jhaarhoff @uj.ac.za
 | DANIE NEL, who is a member of SAICE, obtained his bachelor and master's degrees in civil engineering at the then Rand Afrikaans University and his D Ing degree at the University of Johannesburg. He spent his career in the municipal and bulk water supply environment and is currently an independent consultant. He has vast experience in many of the disciplines related to the provision, operation and maintenance of civil engineering infrastructure, bulk water supply infrastructure projects, risk assessment related to bulk water distribution, management, pipeline risk assessment in dolomitic areas, as well as bulk sanitation services. | |
 | JOHANNES HAARHOFF, who is a Fellow of SAICE, graduated as civil and environmental engineer at the University of Stellenbosch and Iowa State University. Prof Haarhoff spent the fi rst part of his career in municipal employ, civil construction, design and project management before joining the University of Johannesburg in 1990, where he leads the Water Research Group. This group focuses on both applied and fundamental aspects of drinking water treatment and supply. | |

