


Services on Demand
Article
 English (pdf)
 Article in xml format
 Article references
Indicators

Related links
-
 Cited by Google
 -
 Similars in Google
Share

 Permalink
Journal of the South African Institution of Civil Engineering
On-line version ISSN 2309-8775
Print version ISSN 1021-2019
J. S. Afr. Inst. Civ. Eng. vol.53 n.1 Midrand Apr. 2011
TECHNICAL PAPER
Correlating Standard Penetration Test and Dynamic Probe Super Heavy penetration resistance values in sandy soils
C MacRobert; D Kalumba; P Beales
ABSTRACT
This paper presents a statistical method used to develop an empirical equivalence between the Standard Penetration Test (SPT) and the Dynamic Probe Super Heavy (DPSH) in sandy material. Penetration resistance values from the two tests are often taken as equivalent for design purposes, as the same drive energy is used in both. SPT and DPSH resistance values from different geological depositional and weathering environments were examined. The data came from the following areas across southern Africa: Matola in Mozambique, Gope in Botswana, Umdloti and Cape Town in South Africa, and Illha de Luanda in Angola. It was apparent that energy losses were greater in the DPSH test than in the SPT, leading to higher resistance values in the former. The SPT is carried out within a borehole, whereas the DPSH is continuously driven into the soil. The dynamic force applied to the DPSH rods causes soil to fill the small air annulus around the rods, exerting a frictional resistance. The different geological settings of the test sites revealed that, although different factors cause the friction, the equivalence varied in a similar manner. Hence a single correlation formula is suggested to determine equivalent SPT values from raw DPSH resistance values.
Keywords: Standard Penetration Test (SPT), Dynamic Probe Super Heavy (DPSH), Empirical Equivalence, Geotechnical Site Investigations, Dynamic Penetration Testing
INTRODUCTION
A major requirement of geotechnical engineering is an understanding of the soil and rock profile below a proposed development. In southern Africa a major method of doing this is by in situ test methods. The Site Investigation Code of Practice, published by the South African Institution of Civil Engineering - Geotechnical Division (2009) - categorises in situ tests in two broad groups: penetrometer tests carried out from ground level and borehole probes. An example of a penetrometer test is the Dynamic Probe Super Heavy (DPSH) test, and an example of a borehole probe is the Standard Penetration Test (SPT).
In 1988 International Reference Test Procedures (IRTP) were outlined for both the SPT and the various Dynamic Probe (DP) tests, into which the DPSH test falls, so that the testing methods worldwide could be consolidated. However, the IRTP fell short of standardising practice, as a standard would result in loss of local knowledge accumulated from local adaptations (Decourt et al 1988). Countries have different levels of capital investment, and adaptations are made to drilling techniques according to local ground conditions (Clayton 1995). In particular, various different DP configurations exist in which the drop height and hammer weight are varied. The IRTP suggested that further research should be carried out within its guidelines to facilitate international adoption of findings. A survey of South African practice in conducting the two tests has shown that the tests are carried out to a large extent consistently with the IRTP (MacRobert et al 2010).
Both tests are dynamic in that a 63,5 kg hammer is repetitively dropped 760 mm along a guide rail onto an anvil driving a string of rods with a probe attached at the end. However, the tests are different in the procedure followed and the probe shape. To undertake the SPT a small diameter (±76 mm) borehole is sunk and at set intervals (±1 m) a 50,5 mm diameter split spoon sampler is lowered into the borehole and percussed. The number of blows to penetrate 450 mm is recorded. The number of blows to penetrate the initial 150 mm is disregarded to account for material disturbed by the borehole process. Hence the SPT N value is the number of blow counts to penetrate 300 mm. In the case of the DPSH a cone with a diameter of 50,5 mm and apex angle 60º is driven continuously from ground level. Although common practice is to refer to DPSH penetration resistance values as DPSH n values, this can lead to confusion, as a number of DP test configurations exist. These variations are in the drop height, hammer weight and distance over which blow counts are recorded. The various different DP configurations were brought together in the IRTP and incorporated into Eurocode 7 Part 2 (EN1997-2:2007) along with a nomenclature for identifying each test's resistance values. The South African DPSH testing method, as described above, conforms to most of the DPSH-B provisos. One difference is that the cone used has an apex angle of 60º instead of 90º (MacRobert et al 2010). This makes the apex angle similar to that used in the SPT. Further research by Aggarwal (1982) showed that apex angle has negligible effect on penetration resistance. Eurocode 7 Part 2 (EN19972:2007) further suggests that the blow count be recorded over 100 mm or 200 mm. DP test method and penetration distance are incorporated by two subscripts following a capital N, for instance N20SB. South African practice, however, is to record DPSH penetration values over 300 mm, making the correlation with the SPT N value easier, as the blow count depth increments are the same. The Eurocode 7 Part 2 (EN1997-2:2007) nomenclature is thus adopted in this paper and DPSH n values are referred to as N30SB.
The most widely used of the two tests has been the SPT. This was due mainly to the publication of Terzaghi and Peck's Soil Mechanics in Engineering Practice (1948), which led to a great deal of research into the test and ensuing empirical relationships (Broms & Flodin 1988). However, the popularity of the DPSH has grown as it closely models the SPT, providing cheap and easy data (Warren 2007). The Franki Blue Book, a widely used geotechnical engineering manual in southern Africa, suggests that the two tests should be taken as roughly equivalent in initial design (Braatvedt et al 1995). This equivalence is based on the fact that the same drive energy is imparted to the probe per blow. This, however, assumes that energy losses due to friction along the drive rods are the same. A survey of engineers in South Africa has shown that the uncertainties around energy losses due to friction are the biggest stumbling block in adopting the DPSH in design (MacRobert et al 2010). This paper develops an empirical equivalence between the two tests so that correlations between design parameters and the respective penetration resistance values can be used interchangeably. This was done by examining field data in which both tests were conducted in slightly silty sand material formed in different depositional environments in southern Africa. The data came from countries that included Angola, Botswana, Mozambique and South Africa, and the maximum distance between two of the sites was roughly 4 000 km.
AIMS AND OBJECTIVES
The aim of the study was to evaluate the equivalence between SPT N and N30SB values, and hence to determine an empirical method to correlate data between the two tests. Wroth (1988) stated that any empirical correlation should be: (1) based on physical insight, (2) set against a theoretical background, and (3) expressed in dimensionless form. These three considerations formed the objectives of the study.
METHODOLOGY AND TEST SITES
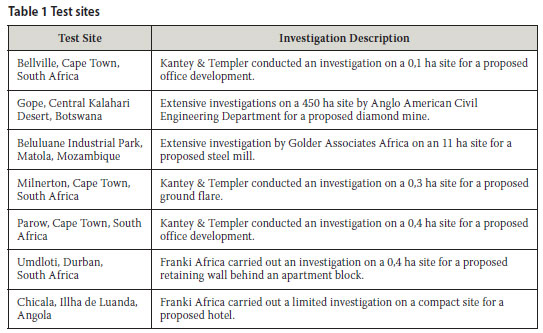
To correlate the data between the DPSH and SPT, it was necessary to collect data in which both tests had been carried out within 5 m of each other. This was assumed to be close enough for similarity of geological conditions. Eight different data sets from different geological depositional and weathering environments were analysed. Data was obtained from previously conducted geotechnical site investigations undertaken by various practitioners, as carrying out the tests on the scale required for analysis was not financially feasible. Testing was therefore not carried out in a controlled manner by the authors, but was instead actual field data. This was not seen as a source of error, but rather an acknowledgement that in practical geotechnical investigatory work, painstakingly calibrating testing equipment is not often viable. The research therefore absorbed these errors and presents a practical solution. Table 1 describes various aspects of the test sites from which data was obtained.
In many of the investigations studied, the exact location of each probing was given on respective site diagrams, and therefore adjacent tests, within 5 m of one another, could be easily determined. However, when this was not the case, the mean, maximum and minimum values from each set of testing were compared. In the latter cases the investigated sites were compact, as defined by the Site Investigation Code of Practice (2009), and hence small enough to assume homogeneity of geotechnical parameters.
SPTs were either undertaken every 1 or 1,5 m within a profile, whereas the DPSH tests gave a continuous record. It was therefore necessary to create continuous and comparable data. This can be done by either averaging the N30SB values over the depth closely matching the SPT N value or estimating the SPT N values between results, which can then be compared to individual N30SB values. The latter method was adopted as it did not decrease the amount of collected data. One method to do this is with a natural cubic spline which has four constants and hence has enough flexibility to satisfy the differentiability requirement at the data points (Theobald 2008). A number of simultaneous equations needed to be solved and this was done with the aid of a computer program, resulting in data that could then be compared.
Borehole logs accompanied all the SPT data collected. The more extensive geotechnical studies included test pits, grading testing, and microscopic and mineralogy testing. These sources of both qualitative and quantitative data allowed a comprehensive discussion of the trends to be undertaken. This was then used to set the theoretical background to the correlation, as well as to give physical insight into the phenomenon as per the objectives of the study.
The data was correlated in a method similar to that used by Cearns and McKenzie (1988) for DPSH and SPT results in sand and gravel material in East Anglia, England. More recently the same method was used by Warren (2007) in fine clayey sands with some clayey layers at Aldershot Garrison, England. The papers written by these authors provided a description of the statistical method used and hence it was easy to adopt and change the method as necessary. Cearns and McKenzie plotted the SPT N/ N30SB ratio against the respective N30SB value. Plotting the data in this manner produced an inverse relationship that was then fitted with a curve to determine the correlation factor at each N30SB value. The mathematical formula of the fitted curve was not presented in their papers, and therefore only a graphical interpretation of the correlation factors could be readily determined.
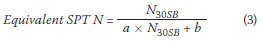
Changes to this method were deemed necessary, as a formula would be easier to apply practically. The ratio was thus reversed, and so the N30SB /SPT N ratio, KDPSH value, was plotted on the y axis against the respective N30SB value on the x axis. This resulted in a simple linear relationship, defined by Equation 1, which was easier to analyse. Various linear regression significance tests were then used to determine how well the relationship fitted the data. This produced a non-dimensional function that gives the correlation factor at each N30SB value, defined by Equations 2 and 3, as per the final aim of the paper.

where a and b are the slope and intercept of the linear regressions respectively.
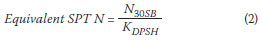
Equation 1 is then substituted into Equation 2 to give the non-dimensional function:
The effectiveness of using the proposed correction formula was then compared to the graphically interpreted correction values determined by Cearns and McKenzie (1988) and Warren (2007). An example is then given illustrating how one of the collected data sets was corrected, showing how similar the corrected N30SB values were to the respective SPT N values.
DATA AND TRENDS
Gope site
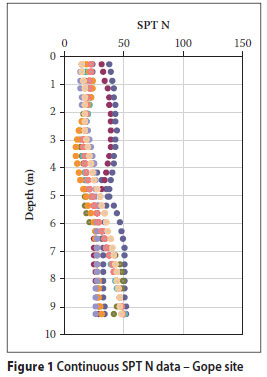
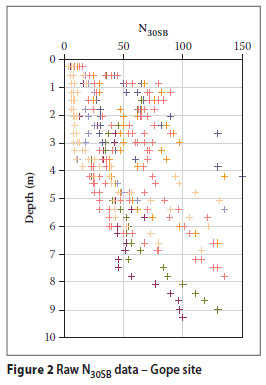
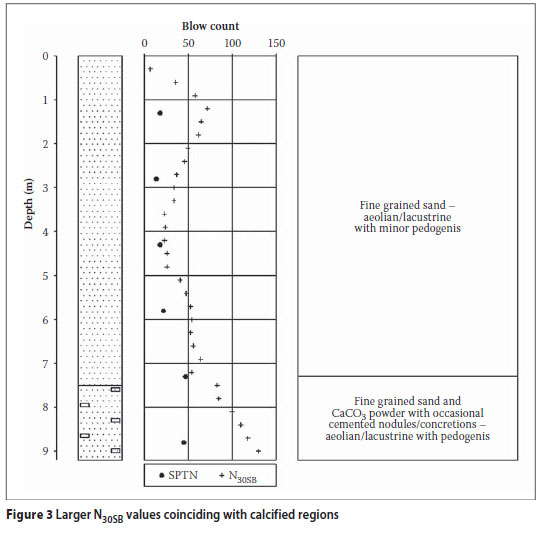
Tertiary and quaternary aeolian and fluvio-lucastrine sands cover the site with a variable layer of poorly developed calcified pedogenic material within. Microscopic analysis of material recovered at varying depths within a borehole found the material to have a high collapse potential (Fourie & Copeland 1998). Mineralogy analysis found the sand to be between 96-98% quartz and 2-4% smectite interstratified clays. The fines content was roughly 7% but increased to roughly 40% in the calcified regions. Data presented in Figures 1 and 2 are from a number of different adjacent test pairs over a large area between 100 and 1 300 m apart, which explains the variation in resistance values in each test. The minimum resistance values from both tests generally agree over the entire profile. However, it was found that at set instances the N30SB values were much higher than the corresponding SPT N values. It is evident that the instances with high N30SB values on closer inspection appeared to coincide with the regions of calcified sand, located at different depths for each test pair, as illustrated by Figure 3.
Matola site
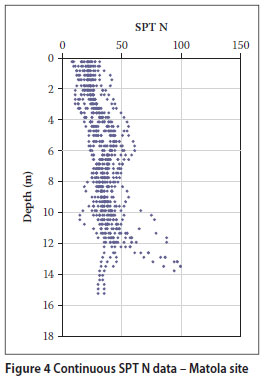
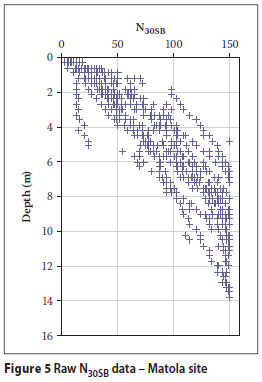
The site comprised an extensive silty sand dune deposit which became progressively consistent with depth. Investigations showed that the soil had an open-voided structure which results in a medium to high collapse potential (Golder Associates Africa 2008). Respective SPT N and N30SB data undertaken at Natural Moisture Content is presented in Figures 4 and 5. The SPT N values increased slightly with depth; however, the results became more scattered with depth. The N30SB values increased steadily with depth. The increase in N30SB values with depth for the majority of the data was assumed to be caused by collapse of soil onto the DPSH rods, which does not happen in the case of the SPT, due to differences in test procedure. In an investigation that altered the amount of fine material in the soil of this region it was found that increasing the fines content significantly increased the cohesion (Bloomfield & Jermy 2003). The grading analysis at the Matola Site showed that on average the fines content was 15% (Golder Associates Africa 2008). As this material collapsed onto the rods, it is assumed that cohesion properties of the fines in the sand exert a frictional force on the rods.
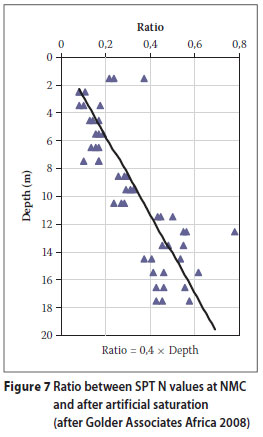
According to Rust et al (2005), when saturated, the soils of this region show a decrease in strength due to a reduction in suction pressures associated with an increase in moisture content. Site investigation work showed that, when artificially saturated, there was a corresponding decrease in the recorded SPT blow count in the profile, as illustrated by Figures 6 and 7 (Golder Associates Africa 2008). This phenomenon must be kept in mind when analysing data in soil profiles that show a decrease in strength when saturated. SPT and DPSH tests undertaken in dry conditions may overestimate the minimum strength mobilised when saturated.

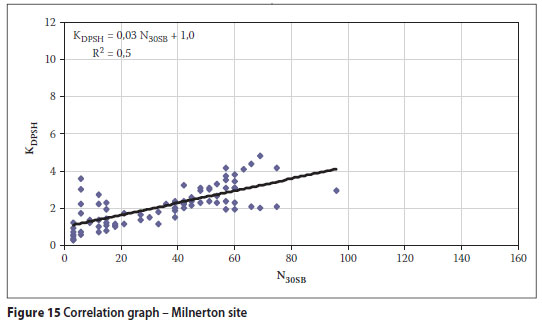
Milnerton site
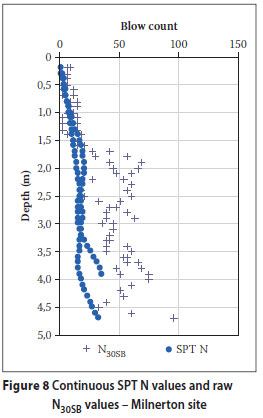
The site was characterised by a cover of transported loose to medium slightly silty fine sand, and residual very stiff clayey silt underlain by completely to highly weathered and fractured very soft greywacke rock (Kantey & Templer 2008). Data obtained from this site is presented in Figure 8. In the top 1,5 m section the results from both tests were relatively similar. However, below this the N30SB values increased rapidly. This rapid increase was assumed to be a result of the saturated slightly silty fine sand below this level collapsing onto the rods and exerting a frictional force (MacRobert 2009).
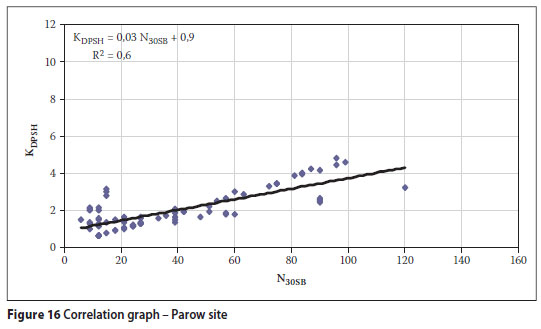
Parow site
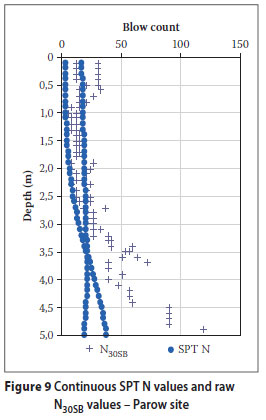
The geology was reported to dip across the site resulting in different thicknesses of fill (layerworks), transported material (medium-dense to dense variably silty fine sand), and residual material (firm becoming stiffer with depth slightly clayey silt). The water table was at a depth of between 1,2 m and 1,25 m (Kantey & Templer 2009). Data obtained from this site was plotted in Figure 9. Although this entire profile was reported to be saturated, the depth at which material appeared to collapse onto the rods is deeper. This is probably responsible for the deeper depth at which the N30SB values increase above the SPT N values.
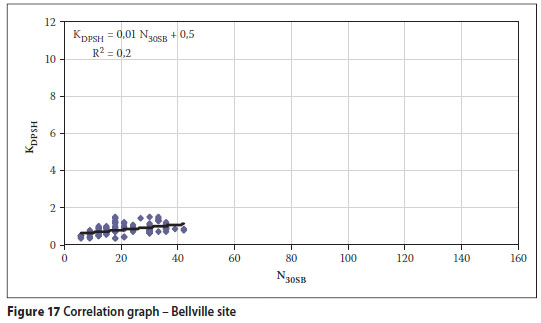
Bellville site
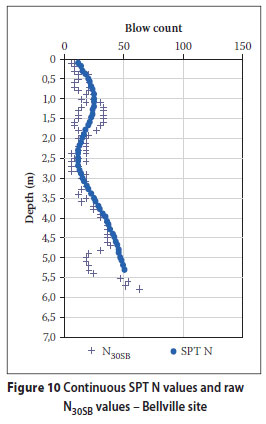
The entire probed profile consisted of a transported fine- to medium-grained locally calcareous sand with a water table roughly between 1,5 to 2 m below ground level (Kantey & Templer 2007). Data obtained from this site is presented in Figure 10. The penetration resistance values obtained by both tests were very similar. However, the range of penetration resistance values recorded in the tests was much lower than in the case of all the other test sites.
Chicala site
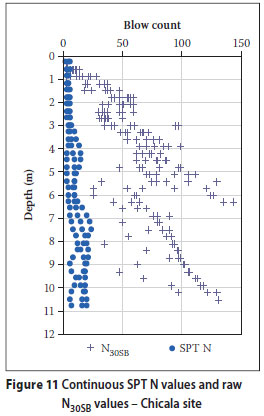
A fine- to medium-grained sand covered the entire Chicala site to a depth roughly between 18,5 and 21 m, with abundant shell fragments scattered over the profile. The ground water table was at a depth of between 16 and 12,5 m, and hence probing was assumed to be in essentially dry material (Franki Africa 2008). A number of DPSH and SPT probes were conducted at this site and the data produced are presented in Figure 11. Although on all the other sites the N30SB values tended to be higher than the respective SPT N values, for the Chicala site the N30SB values were particularly higher. The N30SB values also show a great deal of scatter. The borehole log recorded a large fraction of shell fragments in the profile. It is more probable that the shell fragments, randomly scattered in the profile, will come into contact with the continuous DPSH probe than the SPT probe carried out at set intervals. The shell fragments will impede the probe. It is thus assumed that the higher and scattered N30SB values are a result of this factor. However, the borehole log was very limited and hence other factors may have been at play.
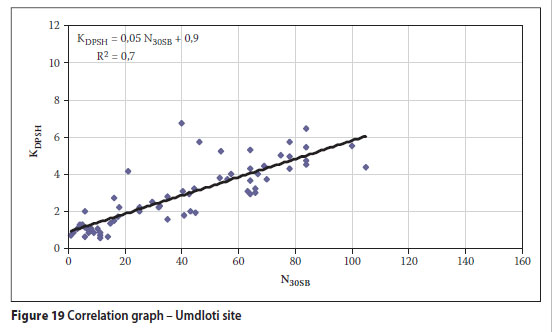
Umdloti site
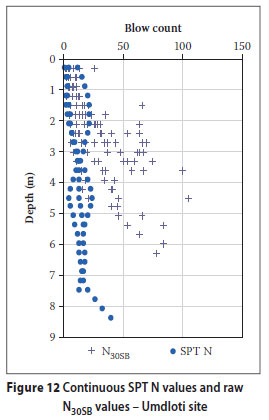
A 6 to 7,50 m thick slightly moist to moist, fine to medium through coarse-grained sand was found to underlie the Umdloti site with the water table sitting at a depth of between 5,30 and 8,50 m (Franki Africa 2003). Umdloti is a coastal town to the north of Umhlanga and is known to be underlain by recent littoral sands which have been locally redistributed and differ from the older Berea Formation with its characteristic collapsible fabric (Brink 1985). N30SB and SPT N data from this site are presented in Figure 12. The borehole log from this site was very limited, but note that the profile consisted of fine moist material which has been shown to result in larger N30SB values.
DEVELOPING AN EMPIRICAL RELATIONSHIP
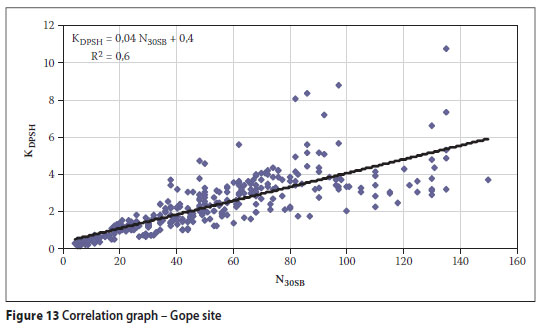
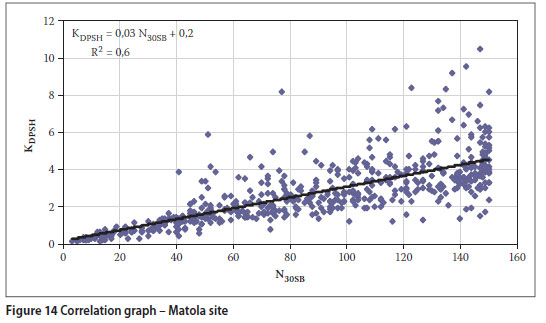
Correlation factors for each site, K DPS H values, were determined and plotted on the y axis against the respective N30SB values on the x axis as illustrated in Figures 13 through to Figure 19.
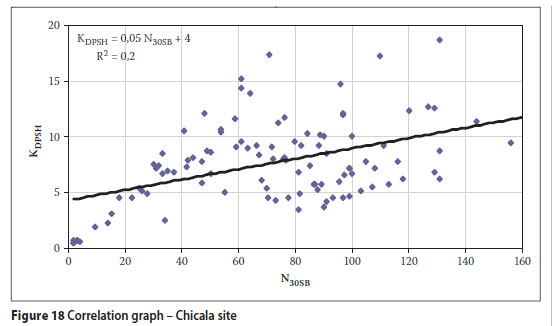
During the analysis of trends from each individual site it was envisioned that each site would result in site-specific correlation factors due to the different depositional environments. However, the trends obtained appeared to be very consistent with one another, barring data from the Chicala site. The Chicala site correlations showed a great deal of scatter and were much larger relative to all the other data sets. The large shell fraction and limited borehole information do not fully explain the Chicala site trends, thus proving justification for excluding this data set from further analysis.
It was found that low N30SB values (approximately below 20 blows per 300 mm) were approximately equivalent to the corresponding SPT N values. Gradual or sudden increases in the N30SB values over the entire profile, or at certain layers within the profile, can lead to erroneously high values.
A number of geological variables in soil profiles, as a result of the various depositional environments and pedogenic processes that formed the profiles, led to the differences in penetration resistance values recorded by the two tests. However, the nature in which the tests were undertaken also led to different penetration resistance values, although similar specific energies were imparted to the probes of the respective tests. No one common cause of the differences can be highlighted and so only a framework of variables can be highlighted and these are outlined below:
Pedogenic layers can develop to differing degrees within profiles, resulting in either weak or strongly cemented layers. At the Gope site the cementation was poorly developed, but resulted in an increase in both the fines and gravel fractions. Weak cementation between sand particles can be overcome by repeated vibrations or wetting. It is postulated that either the fines caused friction along the rods or the weak cementation and gravel particles impeded the DPSH probe. The continuous nature of the DPSH resulted in a to collapse into the air annulus around the DPSH rods. The fines fraction then exerted a frictional force on the rods, resulting in steadily increasing N30SB values which were not observed in the SPT N values. The fact that the SPT was carried out in a borehole resulted in a larger air annulus around the rods, which did not become filled with soil, as this would have resulted in cessation of the test. The SPT and DPSH values that had been correlated were undertaken in dry soils. However, when saturated, the strength of this soil can decrease. SPT N values determined after artificially saturating the profile were found to be much lower than those undertaken in the dry. These observations were made from the qualitative and quantitative data obtained from the Matola site.
Although a number of factors have been outlined to influence the penetration resistance results, there appears to be a common trend in the data. Data from all the sites, except the Chicala site, were therefore combined (see Figure 20 for the resulting correlation graph).
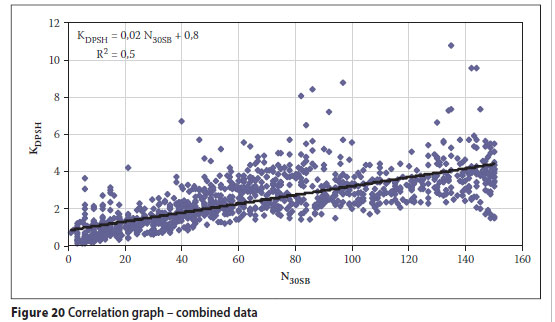
A number of linear regression statistical tests were undertaken on the data and these are presented in Table 2. The regression statistics showed that the linear model fits the data well, albeit with a relatively large standard error in y. This can be expected, due to the variable nature of geotechnical properties and testing practices.
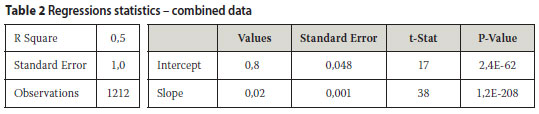
Using the values for the slope and intercept from the correlation graph for the combined data, the correction function, Equation 3, could now be fully defined:
Cearns and McKenzie (1988), as well as Warren (2007), presented graphical correlations based on smaller data sets in sand and gravel and fine clayey sands with clayey layers respectively. Although these tests sites were formed in different geological depositional and weathering environments to southern Africa, the results can be compared to the results obtained in this study. The comparison is presented in Table 3.
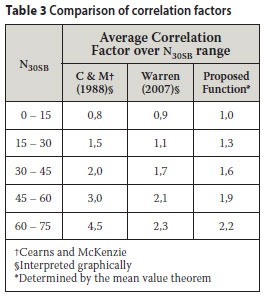
It is clear that the correlation factors obtained with the formula fit closer to the correlation presented by Warren over the entire range of N30SB values. The Cearns and McKenzie's correlation factors up to a N30SB value of 45 are similar to the ones obtained by the equation. Above this the correlation factors diverge. However, very few data points above a N30SB value of 30 were presented by Cearns and McKenzie. Reading values from the graphs could have introduced errors, as could the different geologies and testing procedures. The research by Cearns and McKenzie, and by Warren, appears to validate the research reported.
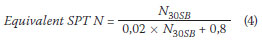
APPLICATION EXAMPLE
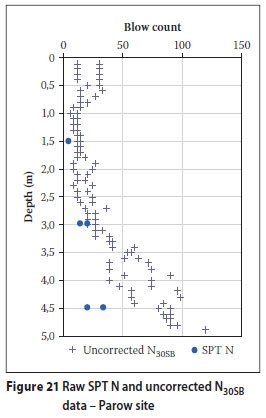
To obtain equivalent SPT N values, raw N30SB values (unaltered for rod friction by methods such as re-drive or torque corrections) are entered into the function defined by Equation 4. The equivalent SPT N values can then be used in various empirical design methods and correlated with various design parameters. Raw data from the Parow site is presented in Figure 21 and it is clear that differences between the two tests exist due to different energy losses during testing. Figure 22 shows the N30SB values corrected for the energy losses by the proposed function.
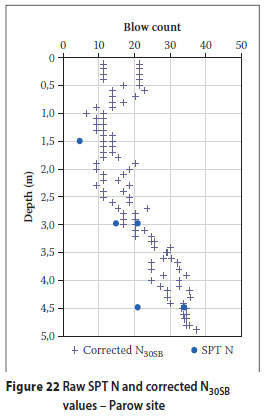
It can be seen that the correlation function transforms the N30SB values to equivalent SPT N values with relative satisfaction.
CONCLUSIONS
The aim of this paper was to evaluate the equivalence between the SPT and DPSH tests and hence determine an empirical correlation to account for the different energy losses during testing. This was accomplished by analysing various data sets from around southern Africa. Penetration resistance values were not just correlated statistically. Instead, quantitative and qualitative geotechnical information gathered during the investigations was used to obtain physical insight to set a theoretical background to the discrepancies in energy losses. It was proposed that, because the SPT is carried out in a borehole, the extension rods do not come into contact with the soil. Although the DPSH is carried out with rods of a smaller diameter than the cone, material falls into the annulus surrounding the rods due to the dynamic nature of the test and ensuing vibration of the rods during impact. This material then exerts a rod friction resulting in larger energy losses in the DPSH than in the SPT. Probing in sandy material from a number of different depositional and weathering environments was analysed and different mechanisms are proposed that can lead to the rod friction:
Although the proposed mechanisms varied, the statistical correlation showed a close relationship. However, a few anomalies did exist. At one site an abundance of shell fragments in the profile appeared to result in excessively high N30SB values and hence a local knowledge of geology is required for any interpretation of penetration resistance values. The effects of moisture content must also be analysed, as radical changes in soil strength can result, which will affect the penetration resistance recorded by either test. The close statistical relationship between the majority of the data allowed for the development of a correlation function. This function allows for equivalent SPT N values, which can be used in design, to be obtained from N30SB values, making this cheap and easy test even more practical.
ACKNOWLEDGEMENTS
The authors wish to acknowledge Anglo Technical Services (45 Main Street, Marshall Town, Johannesburg, South Africa), Golder Associates Africa (244 Surrey Ave, Ferndale, Randburg, South Africa), Kantey & Templer Consulting Engineers (3rd Floor BDO House, 119 Hertzog Boulevard, Foreshore, Cape Town, South Africa), as well as Franki Africa (688 Main Pretoria Road, Wynberg, Johannesburg, South Africa) for kindly providing the analysed data. Acknowledgement also goes to Anglo American for their financial support.
REFERENCES
Aggarwal, V 1982. Two decades of dynamic cone penetration testing in India. Proceedings, 2nd European Symposium on Penetration Testing, Amsterdam: A A Balkema, pp 215-222. [ Links ]
Bloomfield, E M & Jeremy, C A 2003. Geotechnical properties of the northern KwaZulu-Natal coastal sand dunes, South Africa. Heavy Minerals, 29-32. [ Links ]
Braatvedt, I H, et al 1995. A Guide to Practical Geotechnical Engineering in Southern Africa, 3rd ed. Johannesburg: Frankipile South Africa. [ Links ]
Brink, A B A 1985. Engineering Geology of Southern Africa, Vol. 4. Silverton: Building Publications. [ Links ]
Broms, B B & Flodin, N 1988. History of soil penetration testing. Proceedings, 1st Symposium on Penetration Testing, Orlando, FL, Amsterdam: A A Balkema, pp 157-220. [ Links ]
Cearns, P J & McKenzie, A 1988. Application of dynamic cone penetrometer testing in East Anglia. Proceedings, Geotechnology Conference: Penetration Testing in the UK, Birmingham, London: Thomas Telford, pp 123-127. [ Links ]
Clayton, C R 1995. The Standard Penetration Test (SPT): Methods and Use. London: CIRIA. [ Links ]
Decourt, L, Muromachi, T, Nixon, I K, Schmertmann, J H, Thorburn, S & Zolkov, E 1988. Standard Penetration Test (SPT): International reference test procedure. Proceedings, 1st Symposium on Penetration Testing, Orlando, FL, Amsterdam: A A Balkema, pp 3-26. [ Links ]
EN1997-2:2007. 2007. Eurocode 7: Geotechnical design. Part 2: Ground investigating and testing. [ Links ]
Fourie, P M & Copeland, A M 1998. Geotechnical investigation report for mining infrastructure at the Gope prospect in central Botswana. Johannesburg: Anglo American Civil Engineering Department. [ Links ]
Franki Africa 2003. Raw SPT and DPSH records for project name: Apartments Umdloti (T06/1205). Obtained from Franki archives in Johannesburg after discussions with Gavin Byrne and Nicol Chang. [ Links ]
Franki Africa 2008. Raw SPT and DPSH records for project name: Chicalla, Illha de Luanda. Obtained from Franki archives in Johannesburg after discussions with Gavin Byrne and Nicol Chang. [ Links ]
Golder Associates Africa 2008. Geotechnical investigation for proposed Mittal steel plant Beluluane Park, Matola, Maputo, Mozambique. Johannesburg: Golder Associates Africa. [ Links ]
Kantey & Templer 2007. Report on geotechnical investigation for Senate Building at CPUT Bellville. Cape Town: Kantey & Templer. [ Links ]
Kantey & Templer 2008. Report on geotechnical investigation for new ground flare, Milnerton Refinery. Cape Town: Kantey & Templer. [ Links ]
Kantey & Templer 2009. Report on geotechnical investigation for UNISA, Phase 2 Development. Parow, Cape Town: Kantey & Templer. [ Links ]
MacRobert, C J 2009. Correlations between the dynamic probe super heavy test and the standard penetration test and their application within southern Africa. Undergrduate thesis, Cape Town: University of Cape Town. [ Links ]
MacRobert, C J, Kalumba, D & Beales, P 2010. Penetration testing: test procedures and design use in South Africa. Civil Engineering, 18(3):29-38. [ Links ]
Rust, E, Heymann, G & Jones, G 2005. Collapse potential of partly saturated sandy soils from Mozal, Mozambique. Journal of the South African Institution of Civil Engineering, 47(1): 8-14. [ Links ]
SAICE - Geotechnical Division 2009. Site investigation code of practice, 1st ed. Working paper. [ Links ]
Terzaghi, K & Peck, R A 1948. Soil Mechanics in Engineering Practice. New York: Wiley. [ Links ]
Theobald, M 2008. MAM3080FNumerical Methods Course Notes. Cape Town: University of Cape Town. [ Links ]
Warren, G 2007. Heavy weight. Ground Engineering, 40(3): 36-39. [ Links ]
Wroth, C P 1988. Penetration testing - a more rigorous approach. Proceedings, 1st Symposium on Penetration Testing, Orlando, FL, Amsterdam: A A Balkema, Vol 1, pp 303-311. [ Links ]
 Contact details:
Anglo American Technical Services
45 Main Street, Johannesburg, 2001
South Africa
T: +27 (0)11 638 2032
E: cmacrobert@angloamerican.co.za
Contact details:
Department of Civil Engineering University of Cape
Town Rondebosch, 7701
South Africa
T: +27 (0)21 650 2590 F: +27 (0)21 689 7471
E: denis.kalumba@uct.ac.za
Contact details:
Kantey & Templer Consulting Engineers
PO Box 3132
Cape Town, 8000
South Africa
T: +27 (0)21 405 9600 F: +27 (0)21 419 6774
E: pbeales@ct.kanteys.co.za
 | CHARLES MacROBERT received his BSc (Eng) in Civil Engineering from the University of Cape Town. He works for Anglo Technical Services in the Civil and Structural Consulting Division. His interests are the interactions between the various soil states and how these relate to strength and stability. Currently he is involved in a number of large-scale fi eld tests to analyse the process of sedimentation, consolidation and desiccation of slimes that leads to strength gain in deposited tailings. This research is also aimed at unlocking any potential water savings. His research interests furthermore include experimentation with new and novel methods to ascertain the in situ strength of soils, such as resistivity. He is an Associate Member of the South African Institution of Civil Engineering, and is registered with the Engineering Council of South Africa as a Candidate Engineer. | |
 | DENIS KALUMBA is a Senior Lecturer in the Department of Civil Engineering at the University of Cape Town (UCT). He holds an MSc degree in Geotechnical Engineering from UCT and a PhD in Civil Engineering and Geosciences from the University of Newcastle-upon-Tyne in England. He is the convener of all geotechnical engineering courses at both undergraduate and postgraduate level at UCT. A member of the British Geotechnical Association and the International Society for Soil Mechanics and Geotechnical Engineering, Dr Kalumba's main expertise / scientifi c research interests include: soil/foundation interaction behaviour, soil reinforcement, application of soil models in the analysis of geotechnical problems, electro-kinetics, and waste minimisation. | |
 | PATRICK BEALES is an Associate Geotechnical Engineer with Kantey & Templer Consulting Engineers in Cape Town. He holds Bachelor and Masters Degrees obtained at the University of Cape Town (Civil Engineering) and is a part-time lecturer at that university. His passion for geotechnics was initiated in the geotechnical laboratory and through experience gained while working for major geotechnical fi rms in the United Kingdom on a wide variety of mining and waste engineering projects. He is registered as a Professional Engineer with the Engineering Council of South Africa and is a member of the South African Institution of Civil Engineering. |

