


Servicios Personalizados
Articulo
 Inglés (pdf)
 Articulo en XML
 Referencias del artículo
Indicadores

Links relacionados
-
 Citado por Google
 -
 Similares en Google
Compartir

 Permalink
Journal of the South African Institution of Civil Engineering
versión On-line ISSN 2309-8775
versión impresa ISSN 1021-2019
J. S. Afr. Inst. Civ. Eng. vol.53 no.1 Midrand abr. 2011
TECHNICAL PAPER
Response of a full-scale dry-stack masonry structure subject to experimentally applied earthquake loading
A Elvin; H C Uzoegbo
ABSTRACT
This paper presents the response of a full-scale dry-stack masonry structure subject to earthquake loads. The following earthquakes were applied to the base of the structure: (a) North Ridge, (b) Llolleo, (c) El Centro and (d) Llolleo for the second time. The earthquake displacement signals had to be filtered by removing the slow-varying frequency components so that the available servo-hydraulic test machine could be used. The filtering produced acceptably low error when comparing the applied histories with the real earthquake histories. A 4 x 4 m structure was constructed on a 1o of freedom shake table out of mortarless interlocking bricks with minimum reinforcement. A 2 560 kg mass was superimposed on the structure to model the roof. The test structure was instrumented with accelerometers and LVDTs.
The results showed that the simulated Llolleo earthquakes caused the most damage. This damage was minor: several bricks cracked, other bricks shifted, vertical gaps opened up between the bricks, and the skim plaster spalled in several places. The Llolleo earthquake damage was estimated to be Grade 2 on the European Macroseismic Scale (EMS). During the earthquake simulations the walls deflected up to 42 mm. However, the maximum permanent deformation recorded due to bricks shifting was only 4,6 mm - a small fraction of the wall thickness. Although the peak ground acceleration (PGA) was 0,7 g, the maximum acceleration experienced by the structure at a door opening was 3,4 g.
The tests were concluded by applying two harmonic base excitations. The first 5 Hz harmonic test, which corresponded to the undamaged structure's resonant frequency, produced less damage than the Llolleo earthquake. The second 15 s, 3 Hz sinusoidal base motion, which corresponded to the damaged structure's resonant frequency, caused major damage (EMS Grade 4). Despite major cracks in two walls forming the characteristic "X" failure, the structure continued to support the roof mass. Video analysis clearly demonstrated that dry stacking can result in large brick movements when the base is excited.
The ability of the test structure to withstand the applied earthquakes and base harmonic motions is attributed to energy absorption and dissipation due to inter-brick friction and bricks cracking and crushing.
Key words: earthquake testing, full-scale testing, brick structure, brick friction, energy dissipation
INTRODUCTION
Although South Africa is not considered to be a highly active seismic zone, earthquakes do occur. From 1964 to 2005, Saunders (2005) reports 25 earth tremor events greater than 5,0 on the Richter scale. The greatest was measured at 6,3 on the Richter scale in the Tulbagh area in the Western Cape in 1969. Most of the tremors are attributed to mining activity, as well as to intra-tectonic plate seismicity.
The South African building industry is expanding to other parts of the world where seismicity is high and has to be designed for. There are books (such as those by Tomazevic 1999 and Beale 2003) and building codes (such as Eurocode 6 2006 and ACI 530-05 2005) available on earthquake design of masonry structures. Although masonry buildings have been constructed for several thousand years, their response to earthquake loading is still not well understood. It is commonly accepted that for masonry buildings to withstand earthquakes, mortar has to be used between the bricks (see e.g. Eurocode 8 2004 which specifies that the mortar must have a compressive strength of at least 5 MPa). In this paper the response of dry-stack or mortarless construction to earthquake excitation will be investigated.
The definition of a dry-stacked brick or block structure is one in which there is no mortar to bind the bricks together. The bricks are held in place by gravity using a lock-and-key type mechanism (see Hydraform 2009 for a comprehensive summary of such systems). Since no mortar is used, the construction is simplified and becomes economically competitive. However, the analytical design of drystack brick structures is complicated for a number of reasons, including the non-linear behaviour of the friction and keys between the bricks.
Research groups around the world have been investigating the seismic-related performance of masonry structures experimentally. These tests have typically been performed on small-scale models or structural components such as single walls (e.g. see Griffith et al 2004). Experiments on a larger scale have been performed by Ngowi (2006), and Mofana and Rathebe (2005). These researchers considered a full-scale, single-story, dry-stack house subjected to pure sinusoidal base excitation. The question that now arises is: How does a full-scale dry-stack masonry structure respond to real earthquakes?
In this paper three earthquakes are considered: (a) El Centro (1940); (b) North Ridge (1994); and (c) Llolleo (1985). The displacements associated with the accelerograms of these earthquakes can be large, falling well outside the capabilities of most servohydraulic test actuators. The recent work of Elvin (2009) has shown how to filter the slow-varying components of the earthquake signals. Although this filtering produces an error, the earthquake signals can now be applied by the test equipment. For the three earthquakes considered in this investigation, Elvin (2009), and Elvin and Elvin (2008) have shown that the error is acceptably small.
The paper is structured as follows: firstly, the equipment available for applying the earthquakes is described. Next, the dry-stack masonry test structure and the sensor instrumentation are presented.
The earthquake acceleration and resulting filtered displacement time histories used in the experiments are discussed. The sequence of earthquakes, as well as the base harmonic motions, applied to the test structure is specified. The results in the form of damage observed and typical measured displacements and accelerations are presented. The maximum values from each earthquake event are tabulated. The resulting damage and recorded motion are then discussed. The earthquake load testing is compared with design code response spectra requirements. The paper concludes by summarising the findings and identifying limitations that need to be addressed in further research.
EARTHQUAKE TESTING EQUIPMENT
The earthquakes were simulated on a 4 x 4 m, one degree of freedom shake table. This shake table has its first natural resonant frequency at 25,6 Hz when fully loaded by 20 tons. This frequency is well above the expected fundamental natural frequency of the test structure. For more details on the shake table, the reader is referred to Uzoegbo and Senthivel (2010) and De Kock (2002). The actuator attached to the shake table has a capacity of ± 250 kN and a stroke of 150 mm (+75 to -75 mm). The servohydraulic machine used to drive the actuator was an MTS 493 Flex Test GT, supplied by four hydraulic pumps with a capacity of 1 000 litres per minute. The displacement time history for each of the earthquakes was imported as the control signal. The earthquake simulation was run at the Track Testing Facility of Transnet Freight Rail, Jeppestown, Johannesburg, South Africa (Transnet Facility for short).
THE TEST DRY-STACK MASONRY STRUCTURE
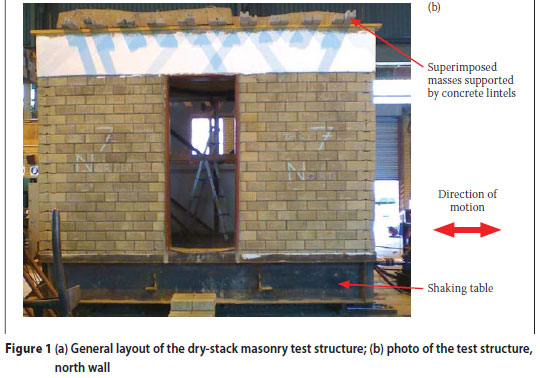
A full-scale 3,9 x 3,9 m dry-stack masonry structure, 2,76 m high, shown in Figures 1a and 1b, was built on the shake table. The masonry block dimensions were: 220 x 230 x 115 mm.This structure corresponds to a single room, constructed according to the requirements of Hydraform (2009). In general, such a room could be part of a larger dwelling, e.g. (a) four such rooms in an 8 x 8 m house or (b) multiple 4 x 4 m rooms connected in a line. A standard doorway (2,07 x 0,813 m) was introduced on two adjacent walls (north and west walls). The other two walls had fullsized windows (1,022 m wide x 0,949 m high) (see Figures 1a and 1b). A second door was included as a conservative measure to reduce the stiffness of the structure.
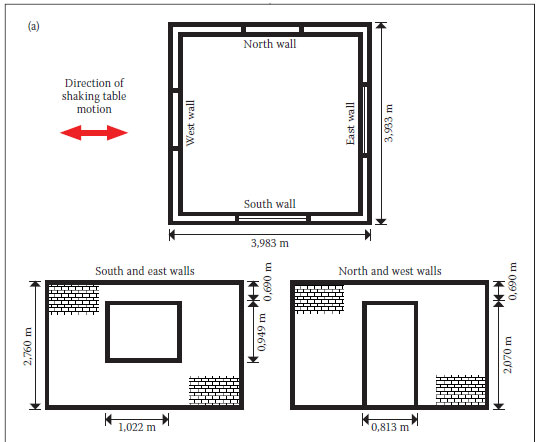
The inside of the masonry structure and the top portion of the outside (see Figure1 b) were skimmed by a thin (4 to 5 mm) layer of painted plaster. Since the test structure simulated an actual dwelling, this is a realistic addition. The plaster also served as a useful identifier of where cracking occurred during the testing.
To simulate the foundation, the bottom layer of bricks was laid in a steel channel welded to the shake table. Four 325 kg masses were placed on top of the structure to simulate the weight of the roof (see Figure 1b). These masses were supported by concrete lintels spanning over the structure. The lintels were not built into the structure but rested freely on the north and south walls. The mass configuration at the top of the structure was directional: the north and south walls were directly compressed by the masses resting on the lintels; the east and west walls were compressed via the interlocking interaction with the other two walls. The total mass at the top of the structure, made up of lintels and concrete weights, was 2 560 kg. This mass simulated the effect of roof loading and precompressed the dry-stack masonry, thus stabilising the structure. Placing such a large mass at the roof level produced an unconservative loading scenario; in general, the higher the mass is from the foundation, the more severe the effect of earthquake loading. Furthermore, the mass loaded the structure, producing higher stresses and hence strains in the supporting walls.
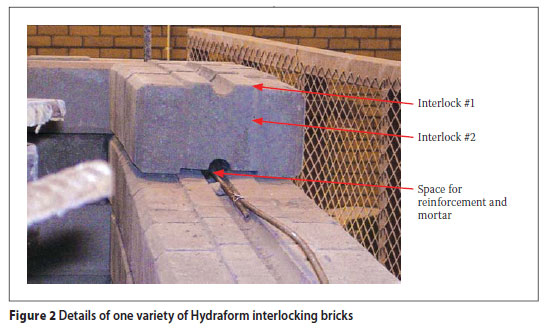
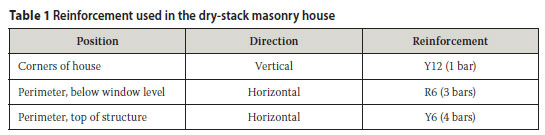
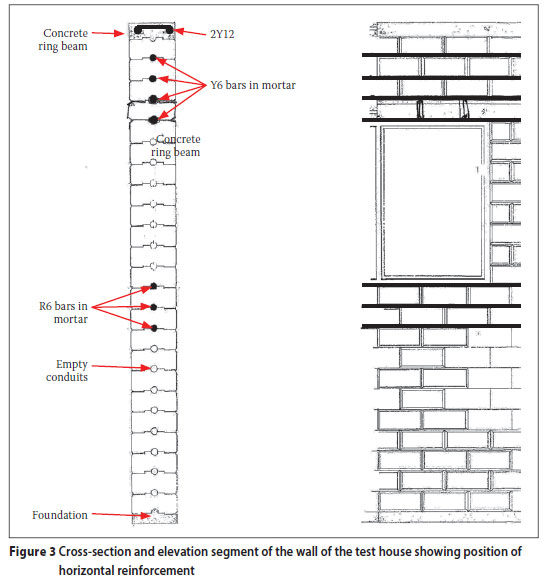
The test structure's walls were made of 7 MPa Hydraform (2009) bricks. Two varieties of bricks were used. Both had interlocking keys in two directions, but only one variety also had a conduit space for reinforcement bars and mortar (see Figure 2). In the test structure, the interlocking bricks were drystacked and the only reinforcement used was as shown in Table 1 and Figure 3. Note that the reinforcement consisted of one bar per conduit space between the bricks, embedded in mortar, and placed only at certain locations in the test structure. In addition, a 75 mm deep, 15 MPa, concrete ring beam with two Y12 reinforcement bars, and Y6 stirrups spaced every 150 mm, was cast at the top of the structure. The reinforcement pattern (Figure 3) shows that the structure was tied together along its perimeter: (a) just below the window and (b) at the level of the eaves.
Instrumentation
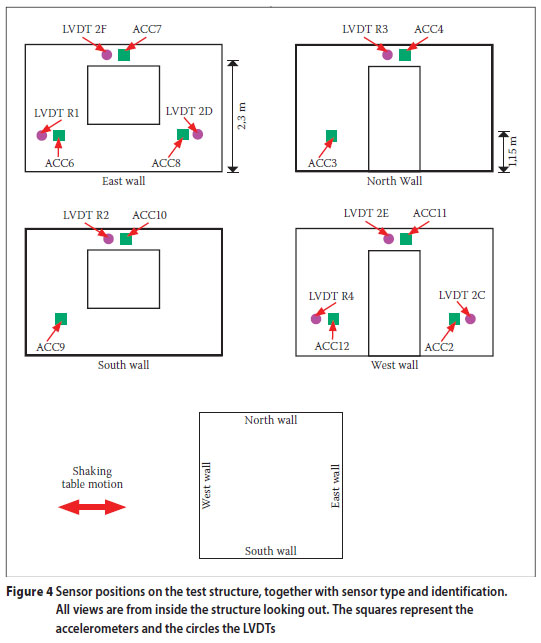
The test structure was instrumented with two types of sensor: nine ± 5 g accelerometers (ADXL105JQC by Analog Devices Inc) and eight LVDTs of various stroke lengths. All sensors were placed on the inside of the structure with their measuring axes perpendicular to the wall to measure outof-plane behaviour. Special care was taken to protect the sensors in steel enclosures from flying debris. Despite this precaution, several sensors were severely damaged. The positions of all active sensors and their identifying numbers are shown schematically in Figure 4. The sensors were positioned at 2,3 m (referred to as "top") and 1,15 m (referred to as "mid") above the top surface of the shake table. The LVDTs were attached to a stiff steel instrumentation frame, which in turn was welded to the shake table. The instrumentation frame did not interact with the test structure.
All sensor signals were acquired using a standard analog-to-digital converter, sampling at 200 Hz (see Ngowi (2006) for details). Each accelerometer and LVDT was calibrated.
THE EARTHQUAKE LOADING
Acceleration time histories
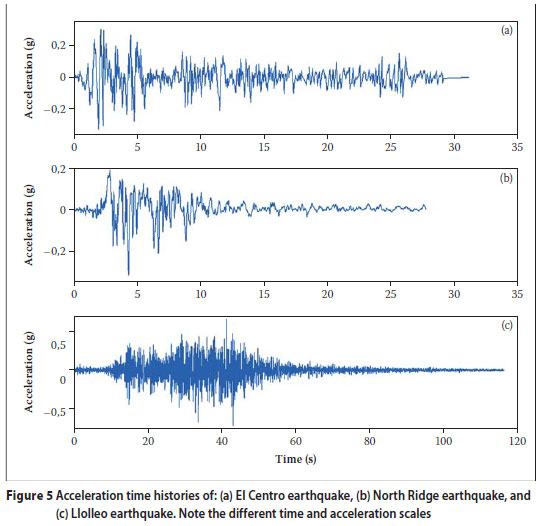
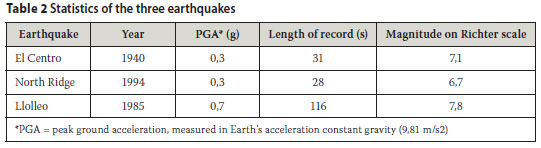
The three earthquakes that were considered were: (a) the El Centro earthquake of 1940, (b) the North Ridge earthquake of 1994, and (c) the Llolleo earthquake of 1985. The acceleration time histories for these earthquakes are shown in Figure 5. Table 2 gives some statistics of these earthquakes.
Displacement time histories
The usual control parameter for servohydraulic test machines is displacements. To obtain the displacement time histories of the earthquakes, the acceleration traces were double-integrated numerically using the trapezoidal rule (see Elvin (2009) for details and discussion). The resulting histories showed that the range of displacements of each earthquake was large, falling well outside the range of the 150 mm stroke of the Transnet Facility actuator used. The displacement histories were high-pass filtered using the moving average approach, as described in Elvin (2009), to produce the time sequences shown in Figure 6. As can be seen from this figure, the filter was designed so that the displacements of the three earthquakes were within the stroke range of the actuator.
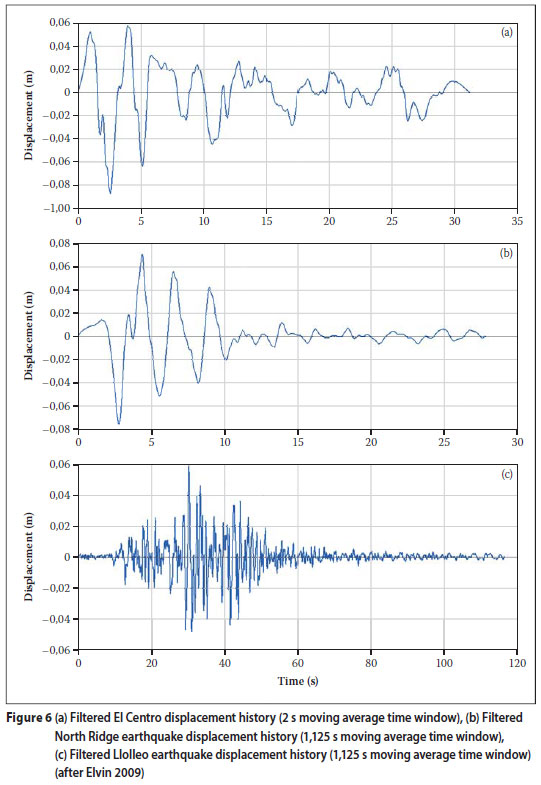
The maximum errors that are produced by filtering the time sequence are 3,5% or 0,0252 g for the Llolleo, 4,6% or 0,0146 g for the El Centro and 11,9% or 0,0376 g for the North Ridge earthquakes (Elvin 2009). Note that these values correspond to single points in time. A broader indication of the error is the root mean square measure. The root mean square errors due to the filtering are: Llolleo 0,0037 g or 0,5% of the peak; El Centro 0,0031 g or 0,98% of the peak; and North Ridge 0,0111 g or 3,5% of the peak (Elvin & Elvin 2008). These errors were deemed acceptable (Elvin 2009; Elvin & Elvin 2008) and were the price that had to be paid in order for the signal to fit into the stroke of the available actuator.
Sequence of applied earthquakes
Any damage occurring softens the structure (reduces the structure's stiffness) and changes the dynamic characteristics of the structure in further testing. However, since building a new full-scale structure after each earthquake simulation would have been prohibitively expensive, in both time and cost, the same test structure was subjected to a series of earthquakes. It must be pointed out that this procedure was conservative, since a damaged structure would be subject to the full force of the remaining filtered earthquakes.
The filtered El Centro displacement time history was applied first. Due to incorrect settings, the MTS servohydraulic test machine's controller became unstable while executing the El Centro time sequence and had to be shut down. On visual inspection the structure showed no signs of damage. The MTS servohydraulic control parameters were reset and the results from this test were ignored.
The dry-stack masonry structure was then subjected to the following sequence of filtered earthquakes: (a) North Ridge, (b) Llolleo, (c) El Centro, and (d) Llolleo a second time. After each earthquake the structure was inspected visually and all damage recorded; the European Macroseismic Scale (1998) was used to specify the damage.
The absolute maximum base accelerations recorded during the three earthquakes studied were: 0,31 g for the El Centro, 0,32 g for North Ridge, and 0,71 g for the Llolleo.
To complete the tests two harmonic base excitations were applied: (a) 9 mm amplitude at 5 Hz for 6 seconds; and (b) 22 mm amplitude at 3 Hz for 15 seconds. The former harmonic test corresponds to a peak acceleration of 0,9 g and the latter to 0,8 g. The durations of the sinusoidal excitations were chosen in line with the maximum energy content of typical earthquakes.
RESULTS
Damage observed
Table 3 gives a brief visual damage description and the European Macroseismic Scale (EMS) (1998) damage to the test structure due to the sequence of earthquakes. Note that the damage was cumulative as each earthquake was applied.
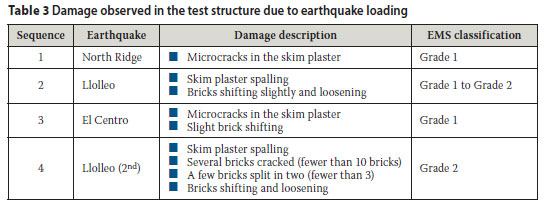
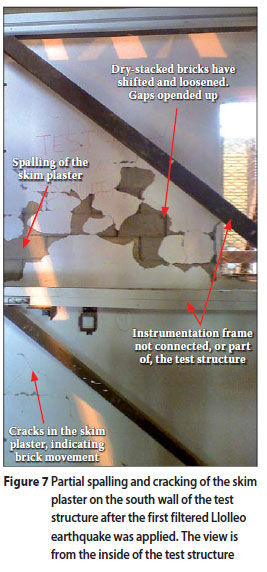
The North Ridge earthquake, which was the smallest one in the sequence, produced only microcracks in the skim plaster. As shown in Figure 7, the Llolleo earthquakes produced significant spalling of the skim plaster and brick loosening. In addition, the second Llolleo earthquake caused the gaps between the dry-stack bricks to grow and produced vertical cracks in several bricks (i.e. split the bricks). The damage started from the windows and doors, i.e. from the weak points in the structure. In general, however, the test structure was only mildly damaged by the sequence of four earthquakes and the house still had sufficient structural integrity to allow occupants to exit safely. It is estimated that after all the earthquake simulations, the damage to the test structure can be classified conservatively as Grade 2 damage on the European Macroseismic Scale (1998). After all the synthetic earthquakes had been applied, the structural damage was minimal and the damaged test structure appeared as shown in Figure 1(b).
Measured displacements and accelerations
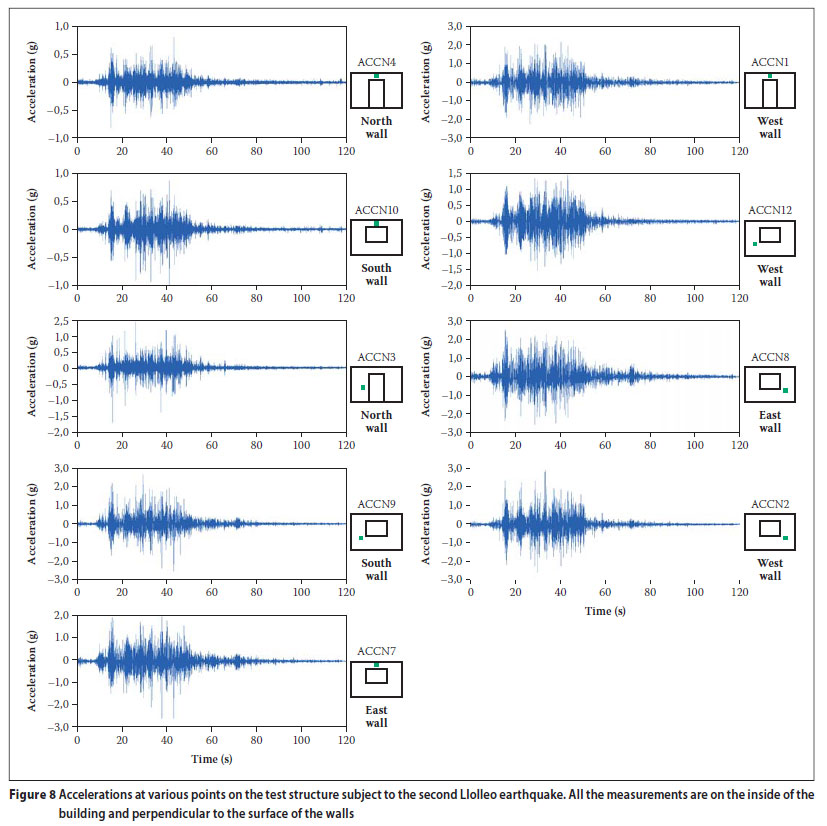
The test structure responded in a similar way to the various earthquakes. The second Llolleo earthquake applied produced the most severe loading on the structure. Not only was this earthquake the largest considered, but the structure had also been softened by the previous simulated earthquakes. For brevity, in this section, the acceleration and displacement results only from the second Llolleo earthquake will be plotted.
Figure 8 shows the accelerations of the points on the test structure perpendicular to the planes of the walls. The north and south walls are parallel to the earthquake motion. Note that the data are unfiltered.
Figure 9 plots the displacements, as measured by the LVDTs, of points perpendicular to the planes of the walls on the test structure. The data are unfiltered. Note that the sensor readings can be offset from the zero mark due to the previously applied earthquakes. Furthermore, the displacement scale is not the same in each plot.
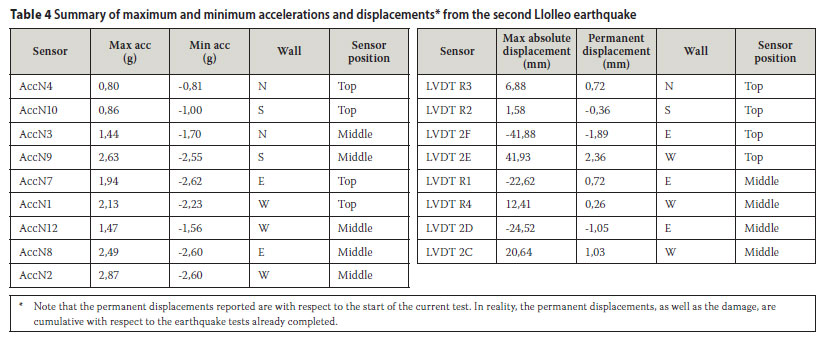
Table 4 summarises the maximum and minimum readings from each sensor during the second applied Llolleo earthquake.
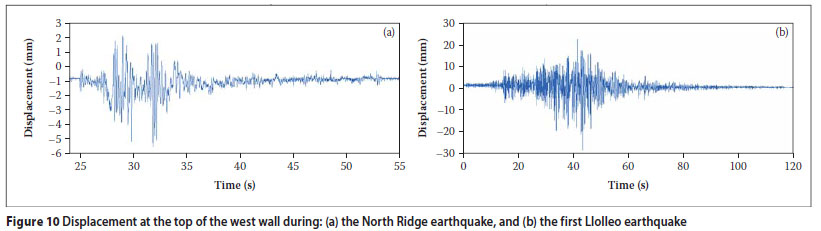
To emphasise the strength of the Llolleo earthquake, Figure 10 shows the deflections at the top of the west wall during the North Ridge and the first Llolleo earthquakes.
Table 5 compares the acceleration and displacement maxima and minima for all the applied synthetic earthquakes.
Damage observed due to harmonic base excitation
To demonstrate the possible severity of loading and the resulting damage, the test structure was subjected to two harmonic ground motions after the earthquake sequence. The first harmonic base excitation of 9 mm at 5 Hz, which was close to the previously measured undamaged structure's natural resonant frequency (Mofana & Rathebe 2005), produced the damage shown in Figure 11. It is estimated that the damage was of Grade 2 on the European Macroseismic Scale (1998).
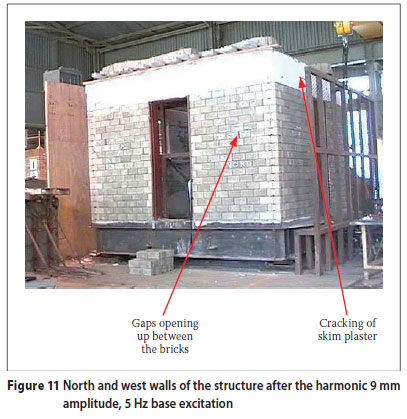
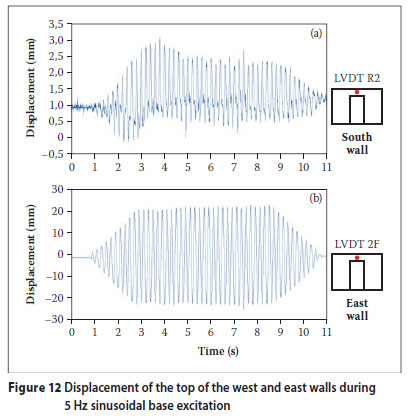
As expected, the sensor readings showed periodic responses (due to the periodic base excitation). This can be seen in the typical results of Figure 12. Depending on the location, the sensor response (both displacement and acceleration) showed a base frequency of 5 Hz, with higher superimposed frequencies. The maximum displacements (24,47 mm) and maximum accelerations (2,71 g) measured were smaller than in the Llolleo earthquake tests. The permanent, perpendicular-to-thewalls displacements were all less than 1 mm.
The second harmonic ground excitation of 22 mm and 3 Hz, which was close to the damaged structure's natural resonant frequency (Mofana & Rathebe 2005), resulted in extensive damage, as shown in Figure 13. Although the structure was still standing, the structural integrity had been compromised. The dry-stack bricks had shifted significantly and many had cracked, split, been crushed or were even missing. Note that the predominant damage had occurred in the two walls that were aligned with the direction of the earthquake.
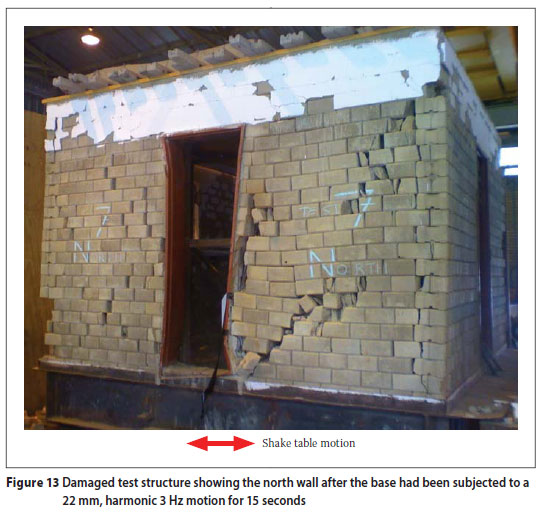
Despite the severe damage, the mass representing the roof was still being carried by the structure and would-be occupants could have left the damaged structure unaided. The steel doorway in Figure 13 not only deformed plastically (thus dissipating energy), but also contained the dry-stacked blocks. Most importantly, the doorway remained open. It was estimated that the damage is of Grade 4 on the European Macroseismic Scale (1998).
DISCUSSION
Displacements, accelerations and resulting damage
The sensors showed that the maximum displacements during the simulated earthquakes occurred at the top of the walls. These walls were perpendicular to the direction of the base excitation. This is expected since these walls were most flexible with respect to the loading and, furthermore, did not have direct precompression due to the superimposed roof mass. The door opening in the west wall reduced the stiffness of the wall, and the deflections in the middle of this wall were also large. The walls that were in-plane to the base motion (north and south walls) exhibited the smallest deflection, since their plane stiffness was large compared with the out-ofplane stiffness of the east and west walls. The sensors confirmed that: (a) openings such as doorways and windows weaken the structure and hence greater deflections are encountered during the base excitation; (b) when walls are tied together, the structure is stiffened, resulting in smaller deformations.
The sensors showed that for all the earthquakes considered, the out-of-the-wall-plane permanent deflections were small compared with the wall thickness (see Table 5 for the maximums). This indicates that the structure was either fully elastic or almost elastic. The maximum deflections (Table 5) for the North Ridge earthquake caused only minor observable damage (in the form of microcracks in the skim plaster). After the larger El Centro and Llolleo earthquakes, the sensors showed that larger deflections perpendicular to the plane of the walls did occur. As an example, Figure 10 shows that the top of the west wall deflected ten times more for the Llolleo than for the North Ridge earthquake. Note that the structural member response is considered as a whole, versus the deformation of single blocks.
As to be expected, in the Llolleo earthquake the bricks shifted more than in the El Centro earthquake. However, the permanent deformation was not large - less than 5 mm - when compared with (a) the maximum displacement, which could be as high as 42 mm, or (b) the wall thickness of 220 mm. Nonetheless, as can be seen from the photo in Figure 7, the maximum and permanent deflections were big enough to cause the skim plaster to crack and spall, and several dry-stack bricks to crack and split.
Since the same structure was tested under several earthquake events, the damage, in the form of bricks both cracking and shifting/loosening, accumulated. It is interesting to note that comparing the second Llolleo event with the first (see Table 5) shows that: (a) the maximum deflections increased by 44%, (b) the average deflections are larger, and (c) the permanent deflections and accelerations are of the same order of magnitude. Note that the deformation of the bricks in the plane of the walls was not measured.
The accelerometers showed similar responses to the LVDTs, namely the walls that were perpendicular to the earthquakes exhibited larger accelerations than the walls aligned with the base motion. The door and window openings, which weakened the walls, underwent large accelerations as well. The accelerations at the openings were larger than at the top of the structure. Of the earthquakes simulated, the largest magnitudes of maximum accelerations were measured during the Llolleo tests. The North Ridge and the El Centro produced similar magnitudes of maximum accelerations of the walls. As was to be expected, the accelerations of the components of the structure were larger than the input base excitation. In the first Llolleo event, for example, the mid-west wall underwent maximum accelerations as high as 3,4 g, with a peak base acceleration of only 0,7 g. The acceleration histories for these two Llolleo tests show very different profiles. Although humans are more sensitive to accelerations than to displacements, the measured results emphasise that the acceleration readings are much more difficult to interpret and visualise than the displacements.
Video analysis of the second base harmonic excitation at the damaged structure's natural frequency showed that the east and west walls perpendicular to the direction of excitation experienced visible out-of-plane deformation. This deformation was approximately half of the wall thickness (i.e. about 100 mm). The north and south walls, which were in line with the base motion, showed little out-of-plane displacement. As can be seen in Figure 13, although there was substantial structural damage in the form of the characteristic "X" cracking in the north and south walls, the building remained standing. The reason for this is that a large portion of the input energy was absorbed and dissipated in first shifting, then cracking and finally crushing the bricks in the wall planes (north and south walls), until significant gaps had opened up. Video analysis also showed that bricks can move a large fraction of their lengths with respect to their neighbours. This results in large damping due to the interbrick friction which bounds the displacements and accelerations, despite the base excitation being close to the natural frequency of the damaged structure.
It is important to point out that if the test structure had been built according to typical masonry construction, i.e. with mortar between the bricks, then the friction energy dissipation mechanism would have been eliminated or significantly reduced.
Load testing versus design code requirements
The experiments conducted clearly show that the dry-stack masonry test structure survived not one but four major earthquakes with low levels of damage (Grade 2 on the European Macroseismic Scale 1998). The question that now arises is: if the test structure was designed to code, how do the applied earthquakes compare to building code loading? The answer to this question is: if the response spectrum for the test earthquake is larger than the requirements of the code's design response spectrum, at the natural period of the structure, then the structure is adequately loaded by the test earthquake.
For illustration purposes, the following three design response spectra, constructed using the Uniform Building Code (1997), will be considered:
I. A small earthquake in a low-seismicity zone (Zone 2A), with the soil profile being hard rock
II. An earthquake in Zone 2, with the soil profile being very dense soil and soft rock
III. An earthquake in Zone 4, with a soil profile being stiff soil, and the seismic source being 10 km away
The response spectra for the El Centro, North Ridge and Llolleo earthquakes were constructed as explained by Elvin (2009). Both the original and the filtered signals were used, with an assumed damping ratio of 5%. The results are shown in Figure 14.
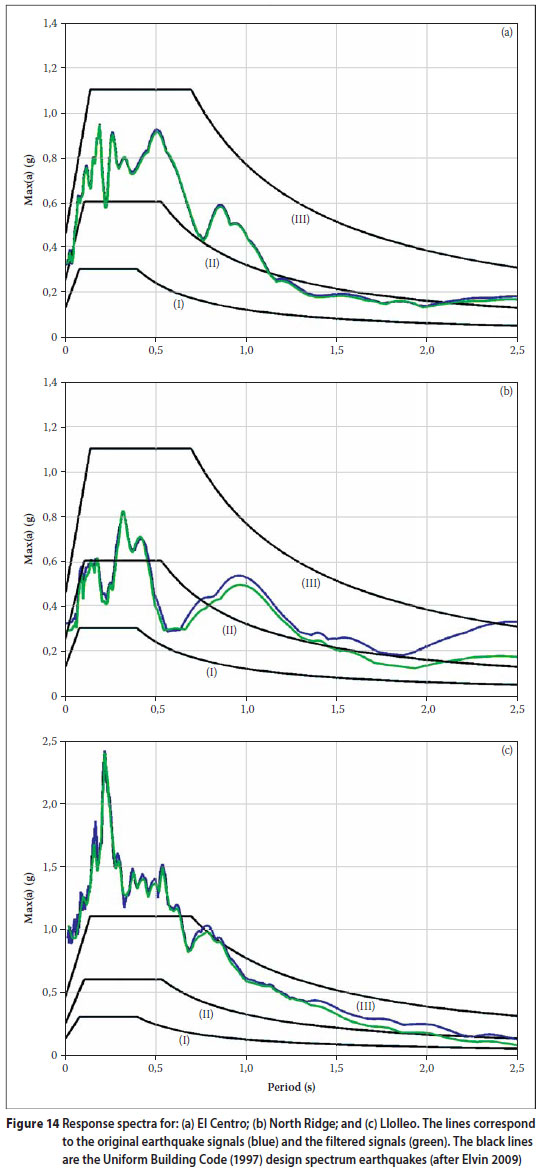
The undamaged test structure's natural frequency is approximately 5 Hz (Mofana & Rathebe 2005) or the natural period is 0,2 s. The damaged structure's natural frequency is approximately 3 Hz (Mofana & Rathebe 2005) or its period is 0,333 s. At these periods, Figure 14 shows that the applied earthquakes produce more severe loading than the design spectra: compare Llolleo to earthquake response spectrum (III), El Centro to earthquake response spectrum (II), and North Ridge to earthquake response spectrum (I). In fact, for the test structure, the applied Llolleo earthquake is almost twice the loading magnitude required by the Uniform Building Code (1997) for earthquake response spectrum (III). It can be concluded that, due to the high natural frequency of the dry-stack masonry test structure, the earthquake simulations produce conservative loads as compared with the Uniform Building Code (1997).
CONCLUSION
In this paper the response of a full-scale dry-stack masonry structure, with minimal reinforcement, which was subjected to base excitation, has been presented. The base excitations applied were based on three earthquakes: El Centro, North Ridge and Llolleo. The original earthquakes had to be filtered in order for earthquake displacement time histories to fit into the stroke range of the MTS servohydraulic test system available. Previous work (Elvin 2009) showed that this filtering removes the slow-varying components and introduces acceptably low levels of error.
Four earthquakes were applied in the following sequence: North Ridge, Llolleo, El Centro and Llolleo for the second time. Applying one earthquake after the other to the test structure resulted in a small, but cumulative, amount of damage. The smaller earthquakes, North Ridge and El Centro, resulted in very minor damage (minor cracking and small areas of skim plaster spalling, European Macroseismic Scale 1998, Grade 1). The Llolleo earthquake caused more damage, but it was still relatively small (European Macroseismic Scale 1998, Grade 2). The damage was in the form of bricks shifting, a few bricks splitting and cracking, and the skim plaster cracking and spalling.
The sensors, located at various points on all four walls at 2,3 m and 1,15 m above the base, recorded various magnitudes of accelerations (up to 3,4 g) and perpendicular-to-the-wall deflections of up to 42 mm. Some deflections were permanent, showing that the structure was behaving inelastically and that the bricks had shifted after the test was complete. The bricks' permanent deflection perpendicular to the wall surface was generally about 1 mm, but could be as high as 4,6 mm.
Two additional tests involving harmonic base excitation near the (a) undamaged and (b) damaged structure's fundamental frequencies were performed. The first harmonic base excitation lasted for 6 s, had an amplitude of 9 mm, a frequency of 5 Hz and produced minor damage (European Macroseismic Scale 1998, Grade 2). Although the peak base acceleration was 0,9 g versus the Llolleo's 0,7 g, the sensors recorded out-of-the-wall-plane deformations smaller than that of the Llolleo earthquake.
The second harmonic base excitation lasted for 15 s, with an amplitude of 22 mm and a frequency of 3 Hz, i.e. a peak acceleration of 0,8 g. The applied frequency was close to the damaged (or softened) structure's natural frequency and produced significant damage (European Macroseismic Scale 1998, Grade 4), especially in the walls collinear with the earthquake direction. Bricks shifted and were damaged in the plane of the wall to such an extent that brick-sized gaps opened up. Many bricks were split, cracked or even crushed. The result was that the characteristic "X" damage pattern was created in the two walls collinear with the direction of the base motion. Despite this severe damage, the test structure remained standing, supporting the superimposed 2 560 kg roof load.
The earthquake and harmonic base motion energies were dissipated through inter-brick friction, and in some cases by bricks cracking and crushing. The fact that the bricks were dry-stacked allowed them to move and hence dissipate energy.
FUTURE WORK
The ability of the test structure to withstand the applied earthquakes relied heavily on energy dissipation through friction. Future work should focus on characterising the nature of the dry-stack inter-brick friction and how this mechanism dissipates energy. In particular, the magnitude and effect of the directionally carried 2 560 kg roof mass, and how this weight precompresses the bricks, need to be investigated. The in-the-wall-plane behaviour should be quantified by implementing a second set of sensors. Furthermore, only horizontal ground motion was considered in this paper, so earthquakes with vertical acceleration components, which might reduce inter-brick interaction, need to be studied. Finally, the earthquakes were all applied "square on" to the structure (in an east-west direction). Off-axis earthquakes and the structure's response to them is a subject for future research.
ACKNOWLEDGEMENTS
This research was funded partly the National Research Foundation (NRF) and partly by Hydraform Holdings. Permission to use the Track Testing Facility of Transnet Freight Rail, Jeppestown, South Africa, is appreciated. The technical assistance of Mr Josia Meyer and Mr Chris de Jongh, both of the Transnet Testing Facility, is gratefully acknowledged. The Hydraform Group is thanked for building the test structure. In particular, the technical help of Mr John Roxburgh and Mr Quintin Booysen of Hydraform is gratefully acknowledged. The assistance of Prof Niell Elvin of CCNY, New York, is also acknowledged. A special tribute is paid to the late Mr Andrew Hofmeyer for his setting up of the entire original instrumentation system.
REFERENCES
ACI 530-05/ ASCE 5-05/ TMS 402-05, 2005, Building Code Requirements for Masonry Structures. [ Links ]
Beale, C 2003. Masonry design and detailing, 5th ed New York: McGraw-Hill. [ Links ]
De Kock, M J 2002. Conceptual design of vibration table for testing of brick structures. Report Number: M57276.02, Megmet (Pty) Ltd, Shijiazhuang, China. [ Links ]
Elvin, A A & Elvin, N G 2008. Experimental earthquake loading of a full-scale dry-stacked masonry structure. Report for Hydraform Holdings (Pty) Ltd. [ Links ]
Elvin, A A 2009. Experimentally applied earthquakes and associated loading on a full-scale dry-attacked masonry structure. Journal of the South African Institution of Civil Engineering, 51(1): 15-25. [ Links ]
Eurocode 6 2006. Design of masonry structures, EN 1996-1-1: 2006. [ Links ]
Eurocode 8 2004. Design of structures for earthquake resistance, EN 1998-1: 2004. [ Links ]
European Macroseismic Scale, EMS-98 1998. [ Links ]
G Grunthal (ed). Potsdam: German Research Centre for Geosciences. [ Links ]
Griffith, M C, Lam, N, Wilson, J L & Doherty, K 2004. Experimental investigation of unreinforced brick masonry walls in flexure. Journal of Structural Engineering, ASCE, 130(3): 423-432. [ Links ]
Hydraform 2009. Hydraform Holdings (Pty) Ltd. www.hydraform.com/files/english_manual.pdf [ Links ]
Mofana, N C & Rathebe, T K 2005. Dynamic response of masonry structures, Unpublished BSc report, Johannesburg: University of the Witwatersrand. [ Links ]
Ngowi, J 2006. Stability of dry-stack masonry. Unpublished PhD thesis, Johannesburg: University of the Witwatersrand. [ Links ]
Saunders, I 2005. South African National Seismograph Network (SANSN). FSDN Report 2005, Council for Geoscience, South Africa. www.fdsn.org/FDSNmeetings/2005/South_Africa_FDSN_2005.pdf [ Links ]
Tomazevic, M 1999. Earthquake-resistant design of masonry buildings. In Elnashai, A S & Dowling, P J (Eds), Innovation in structures and construction, Vol 1. London: Imperial College Press. [ Links ]
Uniform Building Code 1997. Volume 2: Structural engineering design provisions. Washington DC: International Conference of Building Officials (now International Code Council (ICC). [ Links ]
Uzoegbo, H C & Senthivel, R 2010. An effective retrofitting system for dry-stack masonry subject to seismic loading. Masonry International, Journal of the International Masonry Society, 22(3). [ Links ]
 Contact details:
School of Civil and Environmental Engineering University of the Witwatersrand
Johannesburg South Africa
T: +27 (0)11 717 7145 F: +27 (0)11 717 7045
E: Alex.Elvin@wits.ac.za
Contact details:
School of Civil and Environmental Engineering University of the Witwatersrand
Johannesburg South Africa
T: +27 (0)11 717 7128 F: +27 (0)11 717 7045
E: hc.uzoegbo@wits.ac.za
 | ALEX ELVIN graduated from the Department of Civil Engineering, University of the Witwatersrand, in 1989. He completed his Master's in 1991 and his PhD in 1996, both at the Massachusetts Institute of Technology (MIT). He has worked in industry and taught severa classes at MIT. He was a junior faculty member at Harvard Medical School from 1998 to 2002 doing finite element analysis of implants. He joined Wits as a Senior Lecturer in 2005 and became a full Professor in Structural Mechanics at the University of the Witwatersrand in 2010. His research interests are focused on theoretica (numerical) modelling of SMART materials, instrumentation and sensor networks in engineering, health monitoring of structures and problems in optimisation. | |
 | HERBERT UZOEGBO has an MEng in Civi Engineering from the Technical University of Bucharest. He also obtained an MSc and DIC in concrete structures from Imperial College, University of London, and a PhD in concrete structures from King's College, University of London. He worked for two years in the construction industry as a site manager in his early career. He has taught and carried out research into structura engineering at universities in Nigeria, Zambia and Zimbabwe, and is currently Associate Professor in Structural Engineering at the University of the Witwatersrand. He is a Registered Professional Engineer and a Fellow of the British Masonry Association. | |

