


Services on Demand
Article
 English (pdf)
 Article in xml format
 Article references
Indicators

Related links
-
 Cited by Google
 -
 Similars in Google
Share

 Permalink
Journal of the South African Institution of Civil Engineering
On-line version ISSN 2309-8775
Print version ISSN 1021-2019
J. S. Afr. Inst. Civ. Eng. vol.52 n.2 Midrand Oct. 2010
TECHNICAL PAPER
WIM calibration and data quality management
D P G de Wet
ABSTRACT
Weigh-in-motion (WIM) scales are installed on various higher order roads in South Africa to provide traffic loading information for pavement design, strategic planning and law enforcement. Some WIM systems produce anomalies that cannot be satisfactorily explained even by highly experienced professionals. Much of the problem relates to the difficulty in determining the appropriate calibration factors to correct systematic measurement error for WIM systems and the inadequacy of data quality management methods. The author has developed a post-calibration method for WIM data, called the Truck Tractor (TT) method, to correct the magnitude of recorded axle loads in retrospect. In addition, it incorporates a series of data quality checks. The TT method is robust, accurate and adequately simple for use on a routine basis for a wide variety of South African WIM systems. The calibration module of the TT method (i.e. the procedure to determine the calibration factor, kTT) has been accepted by SANRAL and incorporated into the model it uses to quantify the cost of overloading on toll concessions. Some of the data quality checking concepts are also being considered for further use and threshold values for tests are being refined by SANRAL for this purpose.
Keywords: truck tractor (TT) method, weigh-in-motion, WIM error, WIM calibration, data quality
INTRODUCTION
Weigh-in-motion (WIM) scales are installed on various higher order South African roads to provide traffic loading information for pavement design, strategic planning and law enforcement. Large sums of money are spent annually on WIM data collection, yet the data collected are often inconsistent and the pavement loading characteristics that are derived are not always realistic.
Some WIM systems produce anomalies that cannot be satisfactorily explained even by highly experienced professionals. Consequently, there is still no consensus within the industry on the physical requirements for a WIM system, the calibration of WIM data and the data quality checks that can be used to manage contractor performance and identify or eliminate erroneous or dubious weigh records. Agencies and WIM vendors across the world are still experimenting with variations (and often simplifications) of the two most respected WIM guidelines, the American ASTM E1318 Standard (ASTM International 2002) and the COST 323 European Specification (COST 323 1999), yet enhancements contributed by researchers are often highly complex and consequently under-utilised in practice.
The users of WIM data are often ignorant of the inherent inaccuracies of WIM systems. In the absence of suitable industry norms, data quality is not always as good as it could be. Miscalibration of WIM systems further aggravates the problem. Without proper guidance, poor WIM data can be misinterpreted and misused, and may result in imbalances in pavement design and hamper overload control efforts. The credibility and value of WIM systems are thus in jeopardy.
Much of the problem relates to the difficulty in determining the correct calibration factors for WIM systems, and to the random error component that remains even if the systematic error is eliminated. WIM calibration is performed by adjusting the sensitivity of the equipment by a factor to produce correct results, or by multiplying all axle load measurements from collected WIM data by a factor. The aim of this multiplication factor is to suppress systematic WIM error, and it is generally referred to as the calibration factor or k-factor. WIM errors are different for different types of vehicle travelling at different speeds. While a single calibration factor is generally applied to all axle load measurements, some methods have been developed internationally whereby the calibration factor is varied based on, for example, speed (Papagiannakis et al 2008). Given the highly variable nature of WIM error, the methods for correcting it for all vehicles in the traffic stream are often inadequate or so complicated that many practitioners do not use them.
SOUTH AFRICAN EXPERIENCE WITH WIM CALIBRATION
Experience has shown that neither the ASTM E1318 Standard nor the COST 323 European WIM Specification is fully suited for use in South Africa. Up until 2006, WIM calibrations in South Africa were performed mostly with a pre-weighed two-axle truck using a calibration procedure similar to that recommended by ASTM E1318 (except that ASTM E1318 recommends the use of both a two-axle and a five-axle truck). Traffic loading results from such calibrated WIM systems were often unrealistic and it was difficult to achieve the strict ASTM E1318 pavement levelness criterion with in-service pavements.
In 2006, the South African National Roads Agency Ltd (SANRAL) produced a Standard specification for traffic data collection services (SANRAL 2006). The specification was intended primarily for traffic data collection contracts between SANRAL and its service providers. It used the COST 323 European WIM specification as a basis for the sections on WIM data collection. It made one important qualification, which was that a single rigid three-axle truck must be used for accuracy verifications. The three-axle truck is the smallest truck that allows accuracy testing of all four test elements described by COST 323 (gross vehicle mass, axle group, single axle and individual axles within a group). More than half of the WIM systems on the N3, N1 North and Bakwena (N1 and N4 West) Toll Roads failed the initial accuracy verifications. The failures were caused predominantly by load transfer between the steering and driving axles and by an uneven distribution of load between the two driving axles of the test truck. The author showed that the front axle may weigh approximately 5% lighter as a result of load transfer at a typical WIM site, and between 10 and 15% for an uphill WIM site (De Wet 2010).
Since the end of 2006, a random sample of trucks from the traffic stream has been used in combination with the three-axle test truck for calibration (using the COST 323 procedures) on the N1 North. The performance of the two-axle, three-axle and random sample calibration methods at the Kranskop northbound and southbound WIM systems was compared for the period September 2006 to May 2007 (De Wet & Slavik 2008). Four calibrations were performed in each direction during the analysis period. Both these WIMs were well constructed in a good pavement. No alterations to the WIM installations or calibration settings were made during the analysis period, and all calibration factors from the three methods should ideally have been the same for each respective WIM.
It was found that the calibration factors calculated from the three methods (performed on the same day) differed by as much as 12%, and factors from individual methods differed by as much as 15% from one calibration session to the next. The random sample calibration results were expected to be more stable than the others, yet some anomalies were still found. It should be noted that special arrangements are required for accurate weighing of the random sample of trucks, and the low-speed WIM systems that were used to obtain reference masses on the N1 Freeway may well have contributed to the irregularities in calibration factors.
Similar problems with WIM installations, WIM calibration and data quality are experienced internationally. Some of the key technical needs that were noted by State representatives in a recent evaluation of current WIM calibration practices in the USA (Papagiannakis et al 2008) are listed below:
Develop more accurate sensors.
It is generally accepted that a continuous comparison of WIM readings with their linked counterparts from a well-calibrated static scale is the best method of calibrating a WIM system. The method is available for WIM systems that are used in combination with static weighbridges to pre-select potentially overloaded trucks. Although this method, which will be referred to as the Weighbridge-Linked method, is invaluable for WIM research, the practical application thereof is limited.
DEVELOPMENT HISTORY OF THE TRUCK TRACTOR METHOD
The author developed a post-calibration method for WIM data, called the Truck Tractor (TT) method. It uses recorded axle loads to calculate a calibration factor, kTT, which is then applied to collected WIM data in retrospect. Its primary objective is the calibration of WIM data, taking cognisance of the needs and concerns of WIM practitioners, but in addition it incorporates a series of data quality checks. The TT method is robust, accurate and adequately simple for use on a routine basis for a wide variety of South African WIM systems.
The development of the TT method took place primarily over the past two to three years. During 2007, the author investigated several methods for predicting the average front axle load at any particular WIM with consideration of load transfer away from the steering axle, also referred to as the "rearing effect". One such method proved to be adequately viable for further evaluation and it became known as the FTR (Front-axle Truck-tractor Ratio) method (De Wet & Slavik 2008).
In August 2008, BKS (Pty) Ltd offered the FTR method to SANRAL to be considered as a post-calibration method for WIM data. Further refinements were made in 2008 as part of the revision of the South African Mechanistic Pavement Design Method and the calibration method then became known as the Truck Tractor method (De Wet 2008). The TT method and the FTR method are directly related.
CALIBRATION FACTOR FOR SYSTEMATIC WIM ERROR
The TT method uses a steady sub-population of six-axle and seven-axle articulated trucks with a single steering axle and double driving axles on the truck tractor, called "Eligible Trucks". These trucks conform to the following axle criteria which were first developed by the CSIR (2007) as filters for a front-axlebased data validation criterion:
The average axle load for Eligible Trucks typically ranges between 2,0 and 8,5 t.
It was found that the monthly average truck tractor loads for vehicles with an average axle load (for all axles on the vehicle) of between 6,5 and 8,5 t was approximately 21,8 t, with a coefficient of variation of only 1,2% (De Wet 2008). Eligible Trucks with average axle loads in the range of 6,5-8,5 t, defined as "Selected Trucks", are consequently used in the TT method to determine the calibration factor for suppressing systematic error.
The calibration factor, kTT, is determined for a WIM data file using a fully automated iterative procedure developed by Slavik (2008), and is then multiplied by all axle load measurements to produce data for which the average truck-tractor load of Selected Trucks, TTT, is equal to 21,8 t. The TT method can be used for WIMs in various operating environments and is not sensitive to the initial extent of miscalibration of a WIM, clipping of sensors owing to poor lane discipline or different extents of loading on different routes.
Table 1 summarises an evaluation of the accuracy of the calibration factor, kTT, using screening WIM data from the N4 East Toll Road for the period October 2006 to June 2008. The monthly calibration factors obtained from the TT method were compared with those from the Weighbridge-Linked method (kWL). The calibration factors produced by the TT method are accurate for a range of WIMs in appreciably different operating environments.
DATA QUALITY CHECKS
With few exceptions, almost all of the agencies that responded to the NCHRP synthesis of WIM calibration practices (Papagiannakis et al 2008) agreed that WIM data quality control can be used to identify system operational problems. The TT method incorporates a series of data quality checks that can be performed on a routine basis as part of the monthly analysis of WIM data that is done to determine the calibration factor, kTT. If a WIM fails the data quality checks, the root of the problem must be investigated on site. The method is thus focused primarily on the needs of the WIM data user who must be able to interpret whether the WIM results are reliable without having in-depth technical knowledge of the WIM installation. Service providers may be more inclined to focus on keeping the physical installation in good order and then trusting that the data collected will be of good quality, but they should also be guided by warning signs that emanate from the analysis of the data.
Standard deviations of front-axle and truck-tractor loads
The distributions of truck tractor loads (TTT) and front-axle loads (FTT) of Selected Trucks from the TT method can be used as indicators of unacceptably large random WIM error. More than 750 data months from approximately 50 WIM systems on the N1 North, Bakwena, N4 East and N3 Toll Roads (of which the history and data quality were known) were analysed to determine the standard deviations of TTT and FTT, and to develop threshold values for these parameters that would identify "Bad" WIM data as such.
The qualification of data as "Good" or "Bad" is somewhat subjective since WIM error distributions were not always available. WIMs that are considered to be producing Good data are typically those that would achieve at least COST 323 accuracy class C(15) if a random sample of trucks from the road was used to verify the accuracy. These WIM systems are considered to be accurate enough to be used at least for statistical traffic data collection.
Data from WIMs with known pavement failures, logger errors, loose frames or severe levelness problems were considered to have produced Bad WIM data. These WIMs are not considered fit for statistical traffic data collection. In most cases the WIMs identified as Bad were subsequently replaced, or the installation or pavement was improved.
In the absence of absolute certainty about the quality of data, the data from some WIMs were described as "Suspect". It was believed that the data from these WIMs were dubious owing to poor riding quality, excessive temperature dependence or logger instability, but the problems were not severe enough for the data to be described as Bad.
Figure 1 shows a plot of monthly standard deviations of FTT and TTT (also abbreviated SFTT and STTT) for various WIMs. The plots represent months of Good WIM data (green dots), Suspect data (grey dots) and Bad data (red dots). It must be noted that additional Bad data files were analysed to improve on the characterisation thereof and the split between Good, Suspect and Bad data is therefore not a reflection of the quality of data obtained from Toll Concession projects.
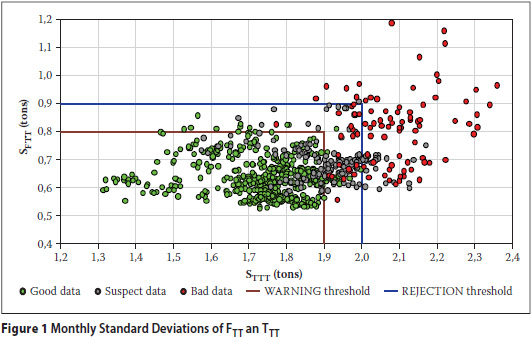
A warning threshold and a rejection threshold are shown in Figure 1. These thresholds were developed with consideration of "consumer's risk" and "supplier's risk". Consumer's risk may be defined, in this application, as the probability that the WIM data user accepts Bad data. Supplier's risk is the probability that the WIM vendor supplies Good data that is rejected by the client.
The cluster of red dots strays away from the green dots primarily in the horizontal plane. STTT is thus a better indicator of data quality than SFTT. Figure 2 shows the probability distributions of STTT for Good, Suspect and Bad data that were used to determine suitable warning and rejection thresholds. The aim of the rejection threshold was to minimise supplier's risk, and the aim of the warning threshold was to minimise consumer's risk. A similar graph was used to develop thresholds for SFTT.
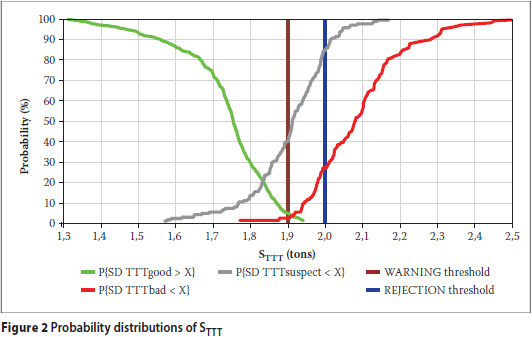
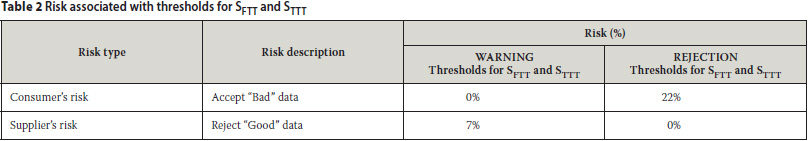
The threshold values for SFTT and STTT are to be applied in combination. More than 90% of data that fail the warning or rejection thresholds do so based on STTT. In combination, the warning thresholds succeed in reducing the consumer's risk to practically zero and, similarly, the rejection thresholds reduce the supplier's risk to zero (see Table 2).
The consumer's risk and supplier's risk are based on Good and Bad data only, and the so-called Suspect data must still be accounted for. The rejection thresholds are lenient enough for only 16% of Suspect data to be rejected. If the warning thresholds are applied, the amount of Suspect data that are accepted is reduced to 36%. This appears to be an acceptable result as there are no exact boundaries between Good, Suspect and Bad data.
Stability and values of calibration factors
Two aspects of monthly calibration factors play a role in WIM data quality, namely the stability of monthly calibration factors and the values of the calibration factors.
It was found from the WIM data used in the development of the TT method that, for stable WIM systems with more than 200 Selected Trucks per month for post-calibration, the calibration factor rarely differed by more than 3% from the average of the calibration factors for the preceding five months. The standard deviations of these monthly differences were almost always less than 1,5% (De Wet 2008).
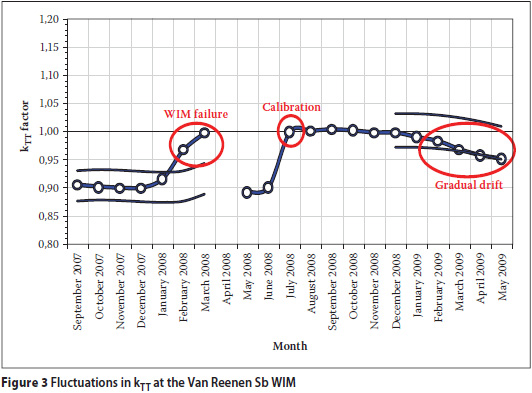
An example of where the rapid change in kTT successfully indicated accelerated failure of a WIM is shown in Figure 3. The frame of the Van Reenen southbound WIM started to come loose from the pavement in January 2008. The WIM deteriorated rapidly during February and was removed in March. It was reinstalled in May and the calibration settings were adjusted in July. A more gradual drift in kTT was observed from January up to May 2009. It was later found that the pavement had failed and the WIM frame had lost its adhesion to the surrounding pavement. Much of the deterioration occurred during the dry winter months and the gradual drift in kTT indicates that the pavement never went into a moisture-accelerated distress phase.
The value of kTT is not an indicator of the quality of WIM data, but factors significantly different from 1,0 have a noticeable impact on post-calibrated WIM data owing to the rounding of axle loads. The South African National Standard Traffic Data Collection Format (Schildhauer 2006), also known as the RSA Format, allocates three numerical characters per axle load. Loads are recorded as multiples of 100 kg - an axle load of 6 723 kg will, for example, be rounded to 6 700 kg and recorded in the RSA Format as "067". The rounding of axle loads for the purpose of the RSA Format produces a discrete distribution of axle loads, as opposed to the true continuous distribution.
The rounding of axle loads is particularly detrimental for WIMs that are poorly calibrated (De Wet 2010). If a WIM is under-measuring by 10%, the axle load distribution will shrink to the left and approximately 10% fewer bins will contain records. The opposite applies for over-measuring WIMs. When the miscalibration is corrected through post-calibration and a new RSA file is created, the distribution of axle loads is moved to the correct position, yet some bins will be empty for a WIM that was under-measuring, while the number of entries in some bins will be approximately doubled for the WIM that was over-measuring. The number of empty bins (for under-measuring WIMs) and doubled bins (for over-measuring WIMs) in post-calibrated data increases with the systematic error of the WIM. It must be noted that all axle load bins are affected. Additional axle loads in a double bin were drawn from the other less-affected bins and, similarly, empty bins were created through the distribution of axle loads over other bins.
It is the experience of the author that a WIM can be readily set to within 10% of the true calibration factor in the field, and that this norm should be insisted on.
Average front axle loads
Once calibrated using the TT method, WIM systems produce average front axle loads, FTT, in the range of 5,6 to 6,6 t for Selected Trucks. Stratified ranges of FTT were developed based on the extent to which load is transferred away from the front axle at a particular WIM site (rearing effect). Table 3 provides typical ranges of FTT for WIM systems with different rearing characteristics. These are not meant to be used as rejection criteria, but rather to evaluate whether the value of FTT corroborates the anticipated rearing characteristic of a particular WIM system. If not, and particularly if FTT falls outside of the 5,6 to 6,6 t range, the WIM should be inspected and the calibration of the WIM should be revisited and redone if appropriate.
Lane discipline and clipping of WIM sensors
A useful by-product of the FTR method, which preceded the TT method, was that it gave an indication of the extent to which poor lane discipline and consequent clipping of sensors resulted in under-measuring of axles. Even though the FTR method is not used in the TT calibration procedure, it should still be plotted for quality control purposes.
Half-lane bending plates or capacitive sensors are generally used for high-speed WIM systems in South Africa. The WIM sensors are typically 1,75 m wide and are placed in the left wheel path only. In general, trucks that do not travel along the centre of the lane tend to stray over the yellow line and into the paved shoulder of the road. The result is that a part of the wheel clips the sensor and passes partly on the adjacent pavement, or on the less-sensitive outer edge of the sensor.
The FTR of an Eligible Truck is the front axle load, F, expressed as a ratio of the truck tractor load, T. The FTR is evaluated not only for the Selected Trucks, but for all Eligible Trucks. If the FTRs of individual trucks are plotted against their respective average axle loads, the points on the graph form a banana-shaped cluster. For WIMs with excellent lane discipline, hardly any points stray from the cluster. In contrast, a protrusion of points breaks away from the cluster for WIMs where many vehicles clip the WIM sensor.
When an Eligible Truck clips the sensor on the outside (left-hand side), the steering axle (single wheel) is severely under-measured, while the under-measurement of the driving axle's dual wheels is less pronounced because only the outer wheel clips the sensor. The result is an FTR that is uncharacteristically low for the truck's average axle load. Although severe clipping may result in the front axle being missed totally (and the vehicle record subsequently being rejected based on illogical axle configuration), less severe clipping can result in a reduction in measured axle loads that may not be sufficient to be indicated as a Bad record.
A typical clipping identification line, called the C-line, was developed through inspection of many WIMs with known lane discipline, and the percentage of vehicles with an FTR below this line is considered to be a good estimate of how many Eligible Trucks have been under-measured because they clipped the WIM sensor.
A direct test of how well the protrusion through the C-line indicates sensor clipping was performed using data from the Kranskop and Pietersburg WIMs (capacitive sensors, left wheel path) on the N1 Toll Road where off-scale sensors are installed to identify vehicles of which a part of the wheel/s travelled over the outer 15 cm of the sensors (De Wet 2010). Not all vehicles that activated the off-scale sensors were necessarily under-measured as the less-sensitive outer edges of the sensors are narrower than 15 cm. What can be said with confidence is that those vehicles that did not activate the off-scale sensors could not have been under-weighed as a result of poor lane discipline.
Figure 4 shows plots of FTR vs average axle load for good passes and passes that triggered the off-scale sensors at the Pietersburg southbound WIM system in August 2008. The lane discipline at this site is regarded as being undesirable. The figure indicates that hardly any of the vehicles that passed centrally over the WIM failed the C-line clipping test, while the protrusion through the C-line is very noticeable for the subpopulation of trucks that triggered the off-scale sensor. Roughly 80% of the vehicles at the Pietersburg southbound WIM that triggered the off-scale sensors still produced data that appeared to be Good - the off-scale sensors therefore eliminated many more records on account of suspected sensor clipping than was necessary. This conservative approach could be afforded as there were still thousands of good passes available for statistical analysis.
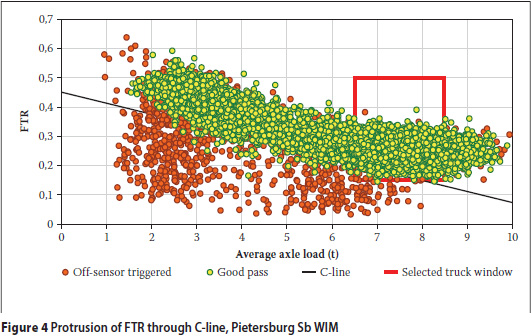
Table 4 gives typical ranges for protrusions of FTR through the C-line - these values may be used as estimates of the extent of clipping.
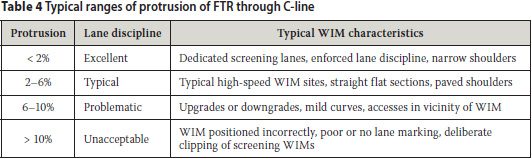
It is important to note that the protrusion through the C-line generally occurs below the average axle load range of 6,5 to 8,5 t. This is because vehicles that clipped the sensor are unlikely to register high gross vehicle masses. The important realisation here is that the calculation of the calibration factor, kTT, is not negatively affected by poor lane discipline and clipping of WIM sensors as these vehicles are unlikely to fit the criteria for Selected Trucks.
IMPLEMENTATION AND TESTING
The practical implementation of WIM calibration and quality control processes is necessary to determine their true value. From current international practice it is evident that various WIM users have refined standards such as ASTM E1318 and COST 323 to fit the characteristics of different WIM systems based on practical experience of the success thereof. The practical implementation of the TT method and its associated quality checks will, over time, show whether South African users perceive it as being adequately accurate, simple and robust for use for statistical data collection at WIM sites on a routine basis. Further advances and refinements may result from the practical testing phase.
The FTR method and its associated data quality checks were used on a trial basis during 2008 and their value was demonstrated to toll concessionaires. When further refinement and testing culminated in the TT method, it became apparent that SANRAL would accept it as a national norm. The TT method and its associated data quality checks were consequently accepted and implemented on the N1 North, N3, Bakwena, and N4 East Toll Road projects in the first half of 2009.
The calibration module of the TT method (i.e. the procedure for determining the calibration factor, kTT) was accepted by SANRAL and incorporated into the model it uses to quantify the cost of overloading on toll concessions (CSIR 2007). The principles of using the standard deviations of front-axle and truck-tractor loads, and the average front-axle loads of Selected Trucks as data quality checks were also adopted, but the threshold values are still being refined. The first trial version of the software was made available in the second half of 2009, and further trials and refinements continued into 2010.
The TT method addresses several of the technical needs identified by WIM users in the US (Papagiannakis et al 2008). It offers a calibration method that does not use test vehicles, which eliminates the need to relate the results from such vehicles to the general stream of truck traffic. The limitations of WIM data are duly recognised and routine monitoring of data quality can be done from a centralised office location using the data quality checks. It further seems that South Africa is on the verge of standardising WIM calibration practices using the TT method as a basis.
RECOMMENDATION
SANRAL has accepted the Truck Tractor (TT) method in principle and this may be regarded as a positive step towards standard ising WIM calibration and data quality management in South Africa. The threshold values for data quality checks and procedures for practical implementation still need to be finalised. The TT method should then be incorporated into SANRAL's Standard specifications for traffic data collection services and should also be incorporated into the South African Technical Methods for Highways (TMH) series. It is anticipated that all matters related to traffic data collection on freeways, including axle load surveys which were previously addressed in TMH 3 (CSIR 1988), will now be included in an update of TMH 8 (CSIR 1987) as part of the review of the South African Flexible Pavement Design Method. The TT method should be used for the calibration of WIM systems where the Weighbridge-Linked method cannot be used and the data quality checks should be used for all WIM systems.
ACKNOWLEDGEMENTS
This paper is based on the author's Master's dissertation (De Wet, 2010) at Stellenbosch University. The South African National Roads Agency Ltd (SANRAL), Northern Toll Road Venture (NTRV), N3 Toll Concession (N3TC), Trans African Concessions (TRAC) and Bakwena Platinum Corridor Concession (BPCC) are thanked for the use of their data for this research.
REFERENCES
ASTM International 2002. Standard specification for highway Weigh-in-Motion (WIM) systems with user requirements and test methods, Designation E1318-02. ASTM Committee E17 on Vehicle-Pavement Systems, Subcommittee E17.52 on Traffic Monitoring, West Conshohocken, US. [ Links ]
COST 323 1999. Weigh-in-Motion of road vehicles. Final report, Appendix I, European WIM Specification Version 3.0. [ Links ]
CSIR 1987. Traffic counting procedures for urban roads. Draft Technical Methods for Highways (TMH8), Pretoria: CSIR. [ Links ]
CSIR 1988. Traffic axle load surveys for pavement design, Draft Technical Methods for Highways (TMH3), Pretoria: CSIR. [ Links ]
CSIR 2007. Procedures for calculating the cost of overloading on toll concessions, 2nd draft Pretoria: SANRAL. [ Links ]
De Wet, D P G 2008. Correction of systematic error in WIM data, 3rd draft. Project SAPDM-ILP: Revision of the South African Flexible Pavement Design Method, Pretoria: SANRAL. [ Links ]
De Wet, D P G 2010. Post-calibration and quality management of Weigh-in-Motion traffic data, MSc (Eng) dissertation, Stellenbosch University, South Africa. [ Links ]
De Wet, D P G & Slavik, M M 2008. Macroscopic WIM calibration. Proceedings, International Conference on Heavy Vehicles, Paris, 19-22 May, pp 318-327. [ Links ]
Papagiannakis, A T, Quinly, R & Brandt, S R 2008. High-speed Weigh-in-Motion system calibration practices. NCHRP Synthesis 386, Washington D C: Transportation Research Board. [ Links ]
SANRAL 2006 Standard specifications for traffic data collection services. Vol 4, Pretoria: SANRAL. [ Links ]
Schildhauer, C 2006. South African standard traffic data collection format. Version 2.00, Issue 2006/05/05, Pretoria: SANRAL. [ Links ]
Slavik, M M 2008. Banana 2, version 0.5 ©2007. Pretoria: BKS (Pty) Ltd. [ Links ]
 Contact details:
BKS (Pty) Ltd
Block D, Hatfield Gardens 333 Grosvenor Street Hatfield Pretoria
South Africa
Tel: 27 12 421 3500
e-Mail: gerharddw@bks.co.za
 | GERHARD DE WET (Pr Eng) graduated from the University of Pretoria in 2000, and obtained his Honours degree in Transportation Engineering in 2003, followed by a Master's degree in Engineering at Stellenbosch University in 2010. He joined the Transportation Planning Division of BKS Consulting Engineers in 2001, where he is currently a chief engineer. He has been involved with the analysis, reporting and research of Weigh-in-Motion traffic data on the major toll road concessions around Gauteng for the past eight years. |

