


Services on Demand
Article
 English (pdf)
 Article in xml format
 Article references
Indicators

Related links
-
 Cited by Google
 -
 Similars in Google
Share

 Permalink
Journal of the South African Institution of Civil Engineering
On-line version ISSN 2309-8775
Print version ISSN 1021-2019
J. S. Afr. Inst. Civ. Eng. vol.52 n.2 Midrand Oct. 2010
TECHNICAL PAPER
The relationship between index testing and California Bearing Ratio values for natural road construction materials in South Africa
I J Breytenbach; P Paige-Green; J L Van Rooy
ABSTRACT
Research was done to determine whether a relationship can be established between index testing and CBR (California Bearing Ratio) results. The process involved compiling a database of test results for a range of rock material types across moist and dry regions in southern Africa. The database was compiled in such a way that it represents natural gravels sampled (mostly) for construction or rehabilitation of road layer works. The database included a location description, material description, Weinert N-value, Atterberg Limits, grading analysis and CBR values. In addition, the linear shrinkage product, shrinkage product, grading coefficient, grading modulus and dust ratio were calculated and also used in the analyses. Data were grouped based on climate, rock material type and compaction, and analysed separately. The data were compared with existing prediction models, after which linear and Weibull regressions were performed to derive new models. Over 130 regressions were derived. The results proved poor and this is ascribed to data variability. The data variability, in turn, is the result of test methods with poor reproducibility and repeatability. In short, the test methods (the CBR in particular) resulted in inconsistent data and subsequently poor results, making accurate predictions nearly impossible.
Keywords: California Bearing Ratio (CBR), index testing, Weibull regression, linear regression, mean square prediction error (MSPE)
INTRODUCTION
To date, much criticism has been directed at the California Bearing Ratio (CBR) test, including its cost, the time required to perform the test and its reproducibility. While some authors feel the test should be replaced (e.g. Savage 2008), no effective alternative method has been developed or implemented in South Africa. In addition to the time required for the four-day soaked CBR test, the amount of testing required by ongoing engineering projects places strain on the material testing industry, which is often overwhelmed by the sheer volume of testing to be done. Currently, an empirical prediction model developed by Kleyn (1955) is commonly used as a predictor of the CBR in South Africa. Models developed by Davel (1989), Netterberg (1994), Sood et al (1978), Stephens (1990, 1992) and others are also used to a lesser extent.
In search of a solution to limit the onerous requirements of this material testing, the relationship between index testing and the CBR was investigated in an attempt to develop empirical prediction models from data related to index testing. The motivation behind this was the reduced cost and time that would be required to execute index testing, compared with CBR testing. The aim of the research was not to replace the CBR test, but to develop a preliminary method of identifying potentially suitable materials to limit the amount of CBR testing that has to be performed. It was also anticipated that by grouping like materials together, better prediction models than are currently available could be developed.
DISCUSSION
CBR properties
A large disadvantage associated with the CBR is its poor reproducibility and repeatability. This was also confirmed by discussion with an experienced soils laboratory manager, Mr David Ventura (2008, personal communication, CSIR, Pretoria) and is shown by the precision limit determination in the current draft revision of the CBR test method by the SABS (SANS 3001-GR40 - SABS 2008). Performing confirmatory testing would become non-viable due to the amount of material required in addition to the (already) substantial volume of material required to perform the standard CBR test. As such, finding an empirical relationship between the index test results and the CBR may be considered challenging due to the variability of the CBR itself.
An example of the above was observed while collecting and entering data. A single sample was compacted to the same compactive effort on two occasions (with an identical test) and, although most of the other parameters (e.g. plasticity index) correlated closely, the first CBR value measured was ten times greater than that of the duplicate.
Data compilation
Research was focused on materials occurring in the South African geological environment. Data were collected from a number of sources, including the following:
A collective database of results obtained during ongoing research at the CSIR
The data collected were required to have index test results and CBR test results for the same sample in order to attempt to correlate the properties. Test results considered in the research included the following test parameters:
From the available data, the following additional parameters were calculated:
Although most of the testing was known to have been conducted according to TMH1 (NITRR 1979, 1986) methods, the possibility of some of the testing deviating from these test methods cannot be excluded. It should also be noted that many of these properties can have considerable variability depending on the sampling, test preparation and operator, and this could not be controlled in the data set. All data collected were entered into Microsoft® Excel as a spreadsheet to facilitate data handling.
METHODOLOGY
Data grouping
Data were divided into classes, based on three main functions, producing nearly 60 different data groups. All data were initially assigned to a climatic group (i.e. moist or dry climate), based on the N-value system proposed by Weinert (1980). Regions with an N-value of less than 5 were considered to be a moist climate, while regions with an N-value of 5 and more were considered to have a dry climate.
The second division of data was a function of the relative compaction used for the CBR test. Only three densities were considered (i.e. 95, 98 and 100% Mod. AASHTO densities). The final data division was based on the rock material groups described by Weinert (1980), as illustrated in Table 1. Although every attempt was made to include a representative range of materials, not all of the rock material groups were represented by the data. This is ascribed to the fact that not all materials are ideal for layer work construction (e.g. metalliferous rock, due to high haulage costs) or that some materials are simply not common (or suitable for use) in a given climatic zone (e.g. calcrete in a moist climate).

In addition to the rock groups described, a group consisting only of non-plastic samples was created for each climatic zone and compaction. The group therefore has no reference to rock material type. Groups for colluvial and alluvial materials were also compiled.
Existing methods
After the dataset had been divided into the subgroups described above, each of the groups was compared with existing models. Numerous different research outcomes - largely identified by Netterberg (1994) - were identified and the methods and results produced compared with the newly created database. The models ranged from locally used systems (e.g. Kleyn 1955) to numerous systems applied abroad (e.g. Sood et al 1978, Dhir et al 1987, etc). The work considered utilises a range of input variables for the prediction of CBR values. As the number and length of individual models proposed are substantial, only a summary of the variables used by different authors is given:
The (full) existing models were entered into the spreadsheets in the empirical format provided and predicted CBR values calculated using the database. In total, 28 equations were considered for each (of the nearly 60) data sets to derive the final CBR values predicted by each model. A mean CBR of the tested dataset was then compared with the mean CBR values calculated for each of the existing models to identify which models showed potential for accurate prediction. However, results using the existing models on the dataset developed were poor, at best.
After the predictions of existing models had been assessed, it was decided to abandon further attempts to refine them, but instead to develop new models based on a sensible, statistical approach. However, the model of Kleyn (1955) was retained in the analysis, as the model is generally used in South Africa. The original method proposed by Kleyn (1955) is in a graphical format, though, and as such the empirical equation of Kleyn's model, as given by Stephens (1988), was considered for further analyses.
DATA ANALYSIS
The statistical analysis of each data set for the different groups described was done using Microsoft® Excel, SAS® 9.1 and SPSS® 15.0 for Windows®. Initially, general descriptive statistics were derived, followed by a principal component analysis for each group. These analyses were done to identify variables showing peculiar characteristics (e.g. strong correlation with the CBR) or trends prevalent in the data.
Model derivation
Linear regression models
Three linear models were used for empirical prediction. The first was derived by performing a simple linear regression. The second linear model was that developed by Kleyn (1955) and derived empirically by Stephens (1988). Finally, a modified version of Kleyn's model was developed by deriving a new linear model using only the grading modulus, the plasticity index and a constant. The linear and modified Kleyn models were developed for each group individually.
Weibull regression model
Concern was raised about the (common) use of linear models to predict CBR values from other variables, as it was argued that the relationship is not necessarily a linear one and, as such, the basic assumption of a linear relationship is fundamentally flawed. Consequently, the Weibull regression was selected on the recommendation of Dr S Das (2008, personal communication, CSIR, Pretoria), as it is used in so-called survival analysis and reliability engineering. Weibull (1951) emphasised the flexibility of the model in application to natural and biological fields. The method proposed by Weibull (1951) is ideal for analysis of the project data for a number of reasons:
Data manipulation
The first step in data manipulation was to normalise the grading to 100% passing the 37,5 mm screen, keeping in mind the average size of an indicator or foundation indicator sample. This normalisation is also necessary for calculating the grading coefficient. In addition, CBR values were restricted to a maximum of 100% (i.e. any CBR value exceeding 100% was considered as a CBR of 100%). The reason for this was that the predicted range of the Weibull regressions was limited to 100% considering that CBR values exceeding 100% have no significance in classification schemes such as the COLTO system.
The largest difficulty, however, lay with the cumulative percentages of particle constituents passing the sieve screens. The consistently decreasing percentage impeded regression and introduced some multi-collinearity. The problem was overcome by calculating the individual percentages retained on each screen, rather than the cumulative percentages passing them, as the percentage retained was not increasing or decreasing relative to smaller or larger screen sizes.
From a practical point of view, the data assessed were also limited. Different CBR ranges were considered for moist and dry regions, as available CBR values did not allow similar ranges to be assessed (i.e. dry areas were characterised by significantly higher mean CBR values than moist areas). The CBR ranges considered were as follows:
Finally, the parameters for the plasticity of non-plastic or semi-plastic materials were entered into the regression processes as values of zero.
Model comparison
After four prediction models for each group analysed had been derived (i.e. Kleyn's model, modified Kleyn's model, linear model and Weibull model), some form of direct comparison was required in order to identify the most suitable model unambiguously. This was, however, not a simple task as a single parameter would not necessarily indicate the most suitable model. To address the problem, the following was done for each group:
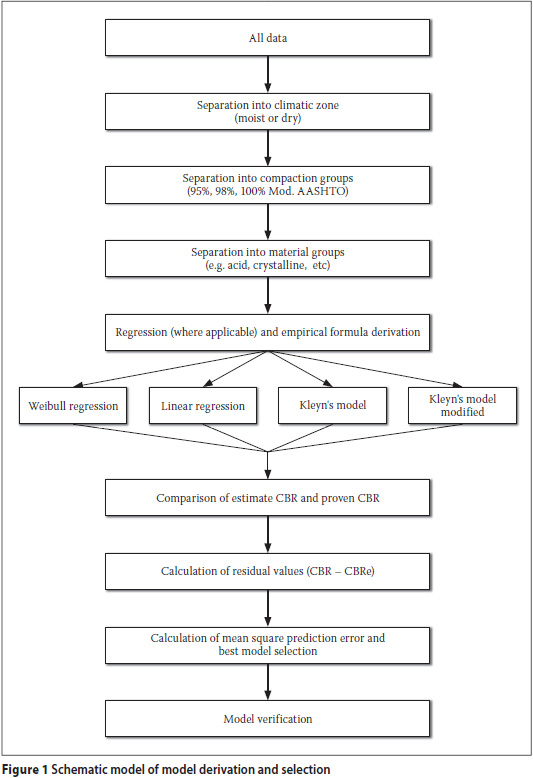
The model producing the best combination of accuracy and range was selected as the most suitable model. In most instances, the selected model was the one with the lowest MSPE. The entire process is illustrated in Figure 1.
RESULTS
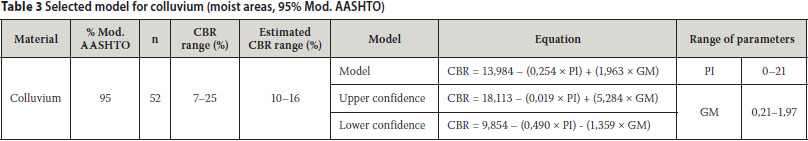
Table 2 illustrates the results produced and the ultimate selection of the most suitable model. This table applies to colluvial materials compacted to 95% Mod. AASHTO density in a moist region. Of the four models derived, the modified Kleyn model had the lowest MSPE (a value of zero) and a mean estimated CBR of 13%. This mean value corresponds to the value calculated from the tested CBR values (i.e. the calculated mean is the same as the predicted mean). The fact that the linear model had an MSPE of less than one emphasises that model selection was not simple, particularly as the linear model also had a mean predicted CBR value of 13%. The final result produced for each material group (in respective compaction classes and climatic areas) mirrors that illustrated in Table 3, although this table applies only to colluvial materials, as discussed above.
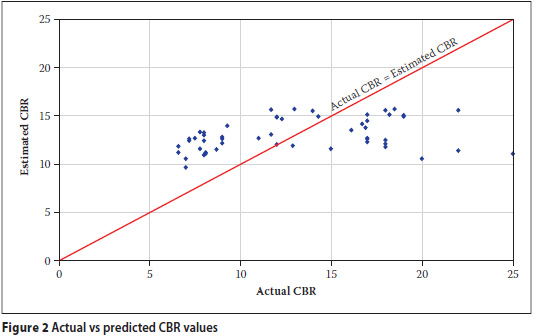
Despite the apparent good correlation between the actual and predicted values (based on the MSPE values), the comparison between actual and predicted values was found to be poor. Figure 2 illustrates that even though the selected model is the best of the models tested, it still predicts only a very limited range of values (i.e. CBR values between 9 and 15% for actual values between 7 and 25%) and is not representative of tested CBR values. Therefore, despite predicting a similar mean CBR value as calculated for the data set and producing the lowest MSPE, the model is not a good one.
The example of a colluvial material was chosen to illustrate the typical model fit. Similar models were developed for each material group, climate and compaction class, giving a total of about 190 different models, of which the best was selected for each group. This resulted in about 50 specific models, with ten groups having insufficient data. Details regarding these models and the correlations in terms of the MSPE (only five models had MSPE values greater than 1) are provided by Breytenbach (2009).
Ultimately, though, the selected models were not ideal and mostly produced very limited prediction ranges, regardless of the regression model used. The model described above, for example, had a restricted predicted range of CBRs compared with the measured range of CBRs. This occurrence was prevalent throughout all of the predictive models derived.
CONCLUSION
A large database, which included CBR values as well as the indicator tests results for the same samples, was developed from existing test results. The use of the database to evaluate the many existing prediction models indicated very poor ability to predict the CBR values accurately. Although problems with the high variability for both the CBR and the indicator tests were recognised, attempts were made to develop new prediction models for the CBR.
Despite the application of numerous steps of refinement and the grouping of materials according to rock groups and climatic character, no relationship between the CBR and typical indicator tests could be proven with a high degree of confidence. None of the four models developed for any of the groups showed reliable or particularly accurate predictive ability, even when the most suitable model was selected by means of elimination.
The study has shown that the prediction of CBR from empirical models is not very good and even when a range of available prediction models is used, little confidence should be placed in the predicted CBR values. A possible reason for the poor predictability is the high variability in both the CBR and indicator test results.
RECOMMENDATIONS
After consideration of all data and each respective model derived, the new empirical equations cannot be recommended for general use, although they could be of benefit as preliminary indicators of testing requirements. It is also recommended, after assessment of a number of existing models, that they too should be used only as preliminary indicators and not as substitutes for laboratory CBR testing for South African soils.
Although the grouping of material test results into rock groups did not prove effective, it is recommended that similar research be done using different material classifications which focus on the material type (e.g. clay or silty sand, possibly using the Unified Soil Classification System as the divisions) rather than the material origin, and bearing the test variability problems in mind. The use of the limited input ranges of CBR results is also recommended.
ACKNOWLEDGEMENTS
The input and guidance of Dr Sonali Das of the CSIR on the statistical analysis methods is greatly appreciated. The provision of data for dry regions kindly provided by the Namibian Roads Department is also acknowledged.
REFERENCES
Breytenbach, I J 2009. The relationship between index testing and California Bearing Ratio values for natural road construction materials in South Africa. MSc dissertation, Pretoria: University of Pretoria. [ Links ]
Burrows, J C 1975. Report on investigation of existing road pavements in the Transvaal. Report L1/75 and field data volumes 1-12. Pretoria: Transvaal Roads Department. [ Links ]
Davel, J S 1989. 'n Statistiese analise van ferrikreet as padboumateriaal in die voorspelling van KDVwaardes uit die graderingsmodulus. BS Hons (Eng) dissertation, Johannesburg: Rand Afrikaans University. [ Links ]
De Graft-Johnson, J W S, Bhatia, H S & Gidigasn, M D 1969. The engineering characteristics of the lateritic gravels of Ghana. Proceedings, 7th International Conference on Soil Mechanics and Foundation Engineering, Mexico, 2: 13-43. [ Links ]
Dhir, M P, Lal, N B & Mital, K 1987. The development of low volume roads in India. Transportation Research Record, 1106, Proceedings, 4th International Conference on Low-Volume Roads, 2: 235-246. [ Links ]
Gawith, A H & Perrin, C C 1962. Developments in the design and construction of bituminous surfaced pavements in the state of Victoria, Australia. Proceedings, 1st International Conference on Structural Design of Asphalt Pavements, Ann Arbor, Michigan, pp 897-910. [ Links ]
Haupt, F J 1980. Moisture conditions associated with pavements in southern Africa. MSc. (Eng) dissertation, Johannesburg: University of the Witwatersrand. [ Links ]
Kleyn, S A 1955. Possible developments in pavement foundation design. The South African Institution of Civil Engineers, 5(12): 286-292. [ Links ]
Lawrance, C J & Toole, T 1984. The location, selection and use of calcrete for bituminous road construction in Botswana. Transport and Road Research Laboratory Report 1122, Crowthorne, UK. [ Links ]
NITRR (National Institute for Transport and Road Research) 1979. Standard methods of testing road construction materials, 1st ed. Technical Methods for Highways (TMH) 1, Pretoria: CSIR. [ Links ]
NITRR (National Institute for Transport and Road Research) 1986. Standard methods of testing road construction materials. 2nd ed. Technical Methods for Highways (TMH) 1, Pretoria: CSIR. [ Links ]
Netterberg, F. 1994. Prediction of CBR from indicators: A review. Report No 90/278, Pretoria: National Department of Transport. [ Links ]
Netterberg, F & Paige-Green, P 1988. Wearing courses for unpaved roads in southern Africa: A review. Proceedings, Annual Transport Conference, Paper 2D/5, Pretoria. [ Links ]
Paige-Green, P 1999. A comparative study of the grading coefficient, a new particle size distribution parameter. Bulletin of Engineering Geology and the Environment, 57: 215-223. [ Links ]
SABS (South African Bureau of Standards) 2008. The determination of the California Bearing Ratio. SANS Part GR40 (Draft). Pretoria: SABS. [ Links ]
Savage, P F 2008. A call for updating some road building practices: "Are we thinking in the 21st century or still languishing in the distant past?" Proceedings, 27th Annual Southern African Transport Conference, Pretoria. [ Links ]
Sood, V K, Lal, N B & Dhir, M P 1978. Estimation of CBR values of moorums from index properties. Indian Highways, 6(11): 28-31. [ Links ]
Stephens, D J 1988. The variation of the California bearing ratio with standard classification parameters for a selection of Natal soils. MEng dissertation, Durban: University of Durban-Westville. [ Links ]
Stephens, D J 1990. The prediction of the California bearing ratio. Civil Engineer in South Africa, 32(12): 523-527. [ Links ]
Stephenson, H K, Karrh, J B & Koplon, N A 1967. Compacted soil strength estimated from grain size distribution and soil binder analysis. Highway Record 190: 1-7. [ Links ]
Weibull, W 1951. A statistical distribution function of wide applicability. Journal of Applied Mechanics, September: 293-297. [ Links ]
Weinert, H H 1980. The natural road construction materials of southern Africa. Pretoria: H & R Academia. [ Links ]
Wermers, L G 1963. Evaluation of abbreviated methods for routine soil testing: Final report. Lafayette: Purdue University. [ Links ]
 Contact details:
PO Box 73478 Lynnwood Ridge 0040
South Africa
Mobile: 27 82 577 6215 / Fax: 27 12 991 2555
e-Mail: gerharddw@bks.co.za
Contact details:
CSIR Built Environment
PO Box 395
Pretoria 0001 South Africa
Tel: 27 12 841 2924 / Fax: 27 12 842 7020
e-Mail: ppaigegr@csir.co.za
Contact details:
Department of Geology University of Pretoria
Pretoria 0002 South Africa
Tel: 27 12 420 2023 / Fax: 27 12 362 5219
e-Mail: louis.vanrooy@up.ac.za
 | IZAK BREYTENBACH (Pr Sci Nat, Visitor SAICE) obtained his MSc degree in Environmental and Engineering Geology from the University of Pretoria in 2009. He is a Professional Natural Scientist registered with the South African Council for Natural Scientific Professions and a member of the South African Institute for Engineering and Environmental Geologists (SAIEG). He works as a consultant in the engineering geology and geotechnical field. |
 | PHIL PAIGE-GREEN (Pr Sci Nat, Associate Member SAICE) is a Chief Researcher and Fellow at CSIR Built Environment. He obtained his PhD in Engineering Geology from the University of Pretoria in 1989 and has worked at the CSIR for 34 years. He is a registered Professional Natural Scientist with the South African Council for Natural Scientific Professions. Dr Paige-Green is currently Vice President for Africa of the International Association for Engineering Geology and the Environment (IAEG) and President of the South African Institute for Engineering and Environmental Geologists (SAIEG). |
 | LOUIS VAN ROOY (Pr Sci Nat) obtained his PhD degree in Engineering Geology at the University of Pretoria in 1992. He started lecturing in the Department of Geology at the University of Pretoria in 1985 and has lectured to undergraduate and postgraduate mining, civil engineering, engineering geology and geology students. His research interests include durability of basic igneous rocks for use in civil engineering construction, problem soils and safe development on dolomite land. Prof Van Rooy has supervised a number of MSc and PhD students and is author or co-author of more than 30 papers in journals and for conferences. |

