


Services on Demand
Article
 English (pdf)
 Article in xml format
 Article references
Indicators

Related links
-
 Cited by Google
 -
 Similars in Google
Share

 Permalink
Journal of the South African Institution of Civil Engineering
On-line version ISSN 2309-8775
Print version ISSN 1021-2019
J. S. Afr. Inst. Civ. Eng. vol.52 n.2 Midrand Oct. 2010
TECHNICAL PAPER
Estimation of extreme flood peaks by selective statistical analyses of relevant flood peak data within similar hydrological regions
J H Nortje
ABSTRACT
This paper describes a new Regional Estimation of Extreme Flood Peaks by Selective Statistical Analyses (REFSSA) method to estimate extreme flood peaks from regional flood peak data. The method differs from current regional flood frequency analysis (RFFA) methods or approaches in that an additional separate statistical analysis is performed on "record maximum flood peaks" within a "similar hydrological region". Suitability of the method is demonstrated for the estimation of extreme flood peaks with annual exceedance probabilities between 0,001 (1/1 000) and 0,0001 (1/10 000) for two major hydrological regions in South Africa, and for catchment sizes between 100 and 7 000 km2. The applicability of the method for catchments outside these regions and limits has not been fully tested mainly due to a shortage of verified data. The theory and a practical example are presented. Excellent results have been obtained so far, displaying high correlation coefficients between extreme flood peak data and regression lines, namely 0,99 on average on log-normal scale. The method is considered to have universal application, especially in climates experiencing outlier type of extreme flood peaks.
Keywords: hydrology, extreme flood peak estimation, regional flood frequency analysis, regionalisation, regression
INTRODUCTION AND BACKGROUND
This paper describes a new approach termed the Regional Estimation of Extreme Flood Peaks by Selective Statistical Analyses (REFSSA) method, to estimate values for extreme flood peaks. The approach differs from current regional flood frequency analysis (RFFA) methods in the following respect: selective (and separate) statistical analyses are carried out on regional flood peak data after transformation (in proportion to the square roots of the respective catchment areas) from comparable sites within a "similar hydrological region" to the site under investigation. A distinction is specifically made between information contained within the whole spectrum of annual maximum flows (one value per site per year, thus including many low flows in the South African climate) and information contained within the "record maximum flood peaks" (only one record value per site for the full observation period), which better reflects the characteristics of extreme flood peaks.
For the purpose of this paper a "similar hydrological region" is provisionally defined as a space/area of demonstrated similarity with regard to the past occurrences of "record maximum flood peaks", thus not requiring homogeneity with regard to aspects such as catchment characteristics. This wide definition is considered admissible for the initial purpose of this study, namely to determine upper-bound values for extreme flood peaks within "similar hydrological regions". However, the REFSSA method is versatile and homogeneous regions, or alternatively clusters of similar basins as described by Wiltshire (1986), could be used in the place of "similar hydrological regions".
The REFSSA method is particularly suitable for hydrological environments where a flood record typically includes one or two extreme flood peak outliers (as in South Africa) and where record lengths are rather short. The initial focus of this paper is the estimation of upper bound values for extreme flood peaks between Q1 000 and Q10 000, where QT is defined as the flood peak value with an annual exceedance probability (AEP) of 1/T (Q10 000, for example, has an AEP of 1/10 000).
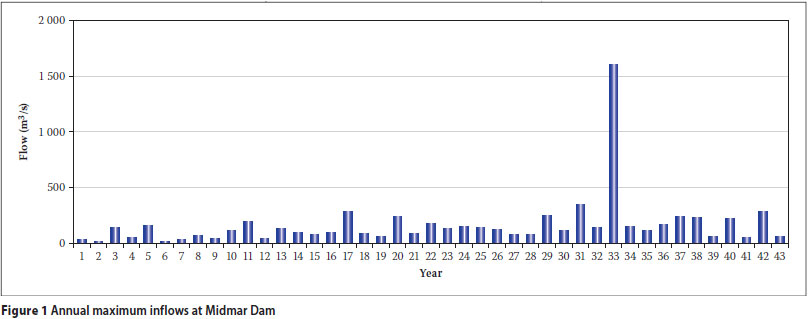
Traditionally, the Single Station Statistical Analysis (SSSA) method has been used for the estimation of extreme flood peak values even up to Q10 000. The SSSA method is certainly useful for estimating flood peaks within or close to its record length but, as motivated by Kovács (1988), a flow record should not be extrapolated to more than two times its length. Alexander (2000) also warned against extrapolation beyond Q100. The limitation of the SSSA method is demonstrated by the fact that different but equalfitting distributions (all with correlation coefficients in the order of 0,97), such as Lognormal, Log Pearson III and General Extreme Value (with either conventional moments or probability-weighted moment estimators), yield entirely different estimates of Q10 000 which could range from 2 000 to 13 000 m3/s for one site. Lesser annual maximum flows, such as Q1, Q2, Q3, ... Q30, play a major role in the SSSA method, but they do not necessarily contain information on the magnitude of extreme flood peaks. This is demonstrated by the flow record at Midmar Dam shown in Figure 1. In this case only one extreme flood peak occurred during a continuous 43-year record length. This is a typical picture for many inland sites in South Africa.
Integration of regional information helps to overcome the lack of long-term records at individual sites and this is addressed by RFFA methods in many parts of the world. Cunnane (1988) provides an evaluation of the merits of different RFFA methods. Current RFFA methods, however, do not fully overcome the statistical shortcomings of the SSSA method for estimating extreme flood peaks in an environment with outlier type of extreme flood peaks. The main reason is that the different statistical characteristics of extreme flood peaks are not taken into account. Also, in its purest form, the RFFA method requires a homogeneous region or pool (cluster of similar basins) and a common record period covered by all stations within the region or pool. As a result, the database is reduced in size and it is still dominated by low annual maximum flows, especially in the South African context. In addition, historical flood peaks cannot be added without making questionable statistical assumptions. Görgens (2007a) adapted the RFFA approach (using the flood index method) for South Africa, but it is unfortunately only considered suitable for the estimation of flood peaks and flood hydrographs up to about Q100.
Compared with the SSSA method, the REFSSA method achieves superior correlation coefficients between extreme flood peaks and regression lines. Another significant improvement is with respect to the coefficient of variation, cv (standard deviation divided by the mean in terms of logarithms of flood peak data), which typically reduces from about 0,2 (SSSA method) to about 0,06 (REFSSA method). Typically, a record length of 50 to 100 years is analysed by the SSSA method in South Africa, whereas the typical representative record length analysed by the REFSSA method is between 3 000 and 5 000 station years. In addition, historical (including palaeo) flood peaks could be added to the catalogue of "record maximum flood peaks" without the statistical difficulties experienced by current RFFA methods. These comparisons suggest that more reliable estimates of extreme flood peaks could be obtained by means of the REFSSA method.
In South Africa, the Regional Maximum Flood (RMF) method as developed by Kovács (1988) in accordance with the Francou- Rodier (1967) approach is a frequently used empirical method to determine appropriate safety evaluation flood peaks for dams. The RMF value is the value on an envelope curve drawn just outside "record maximum flood peaks" for different sites within a specific demarcated region. The RMF method thus also integrates regional information within "similar hydrological regions", but a serious shortcoming is that the annual exceedance probability (AEP) of the RMF value at a specific site is unknown. In addition, the AEP of the RMF is not constant but varies significantly from site to site and region to region.
Application of the Probable Maximum Flood (PMF) approach in South Africa is also problematic. Firstly, the AEP of the PMF is undefined. Secondly, PMF values as derived by the preferred unit graph method of HRU (1972) have poor correlation with actual record maximum flood peak data. This was demonstrated by Görgens et al (2007b) who found that PMF/RMF ratios vary from 0,6 to 9 from site to site and region to region in South Africa.
The new REFSSA method provides a sound statistical basis for estimating extreme flood peak values between Q1 000 and Q10 000 from regional data. Reliability depends mainly on the availability and accuracy of relevant record maximum flood peak data from comparable catchments. By means of the REFSSA method, estimates can also be made of the AEP of RMF and PMF values. This is considered very useful because the SANCOLD Guidelines (SANCOLD 1991), which are relevant when determining appropriate safety evaluation discharges or floods for dams in South Africa, are based largely on the RMF and PMF methods.
THEORETICAL PREMISE OF THE REFSSA METHOD
The REFSSA method distinguishes between the following two data sets: (1) the Qx data set which consists of transformed "record maximum flood peaks" (Qxi-values) and (2) the Qa data set which consists of all transformed annual maximum flows (Qai-values). The aforementioned data are selected from sites with comparable catchments and catchment sizes within a "similar hydrological region", and then transformed to the site under investigation in proportion to the ratio of the square roots of their respective catchment areas. It is inherently assumed that "storm event" is the major factor with regard to the magnitude of extreme flood peaks. It is expected that the REFSSA method would be less reliable for catchment sizes of less than about 100 km2, where catchment characteristics could become more important.
The crux of the method is the postulation that a variable termed the "regionally observed maximum flood peak" (Qx) for a specific site (based on the distribution of transformed "record maximum flood peaks" or Qxi-values, obtained from other sites with comparable catchments within a "similar hydrological region" during the same observation period of adequate length) can be regarded as a statistical variable and further that its statistical distribution parameters can be utilised to estimate the magnitude of extreme flood peaks, such as Q1 000 to Q10 000. It is postulated that information contained within record maximum flood peak data within a "similar hydrological region" is much more suitable for estimating the magnitude of extreme flood peaks than information contained within lesser annual maximum flow data, such as Q1, Q2, Q3, ... Q30, etc. Information from the latter or Qa data set is utilised to help "calibrate" the AEP of extreme flood peaks. An algorithm that combines the information from the two data sets in order to estimate both the magnitude and the AEP of extreme flood peaks is presented in the next section. The expected value of Qx for a site during a similar observation period can be calculated as the mean (or median if the data are log-normally distributed) of the Qxi -values. The other parameters of the distribution of Qx such as the standard deviation, coefficient of variation and skewness, can also be calculated from the Qxi -values. Estimates can then be made of extreme flood peak values such as Q10 000 by using a suitable theoretical statistical distribution model.
The following notes have further bearing on the theoretical premise of the postulation:
QT is defined as the flood peak value with an annual exceedance probability (AEP) of 1/T. T is traditionally referred to as the recurrence interval or return period in years, which is strictly speaking inappropriate because hydrological records are not statistically independent with respect to time. Records at many single stations show definite cyclic patterns over time. Alexander (2009) demonstrated that annual inflow volumes at Vaal Dam display low-high 'cycles' with periods of approximately 20 years. Long-term climate changes are also not reflected within short observation or record periods. The AEP of QT should thus be expressed as 1/T (e.g. 0,0001 or 1/10 000 - omitting years), with the qualification that it is based on a statistical analysis of data collected over a specified observation period.
Limitations and practical considerations impacting on accuracy of results
SELECTION OF DATA
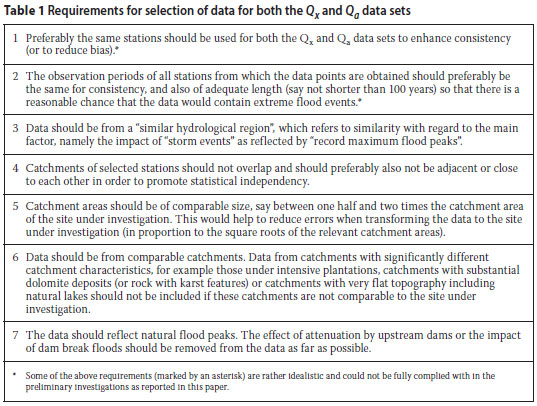
Requirements for selection of data for the Qx and Qa data sets
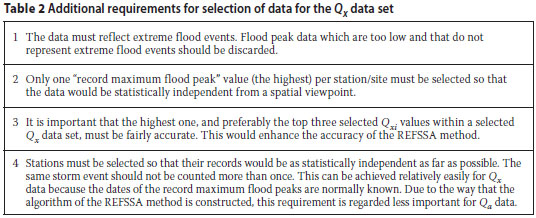
From a statistical viewpoint the data should be unbiased, statistically independent and relevant to the site for which an extreme flood peak is to be estimated. These criteria form the basis of the selection requirements as listed in Tables 1 and 2. Additional requirements for the selection of Qx data are listed in Table 2. Record maximum flood peak data selected according to the criteria as listed in Tables 1 and 2 should give a good indication of the mean and variance of extreme flood peaks.
Catalogue of "record maximum flood peaks" by Kovács (1988)
In South Africa record maximum flood peak data are readily available from the catalogue published by Kovács (1988). This catalogue was used as the main data source in this study. RMF-regions as demarcated by Kovács (1988) comply with the definition of and have been used as "similar hydrological regions" as a starting point for the purpose of this study. The following aspects relate to the suitability of the catalogue by Kovács (1988) as a data source for the REFSSA method (it should be borne in mind that this catalogue was not specifically compiled for the REFSSA method):
It can be seen that the catalogue as published by Kovács (1988) has a number of shortcomings for use as a database by the REFSSA method. Nevertheless, at the time of its publication (1988) a lot of work was done to make the catalogue as accurate and complete as possible and it contains a wealth of information. It is the only verified database of its kind that is readily available in South Africa. Taking all factors into account, it is regarded as suitable for current use until a more complete database becomes available.
ALGORITHM FOR ESTIMATING EXTREME FLOOD PEAKS
The algorithm for estimating the magnitude and AEP of extreme flood peaks is described below on the basis of the diagrammatic presentation in Figure 2.
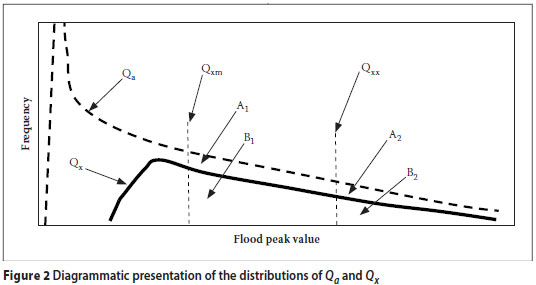
The symbols used in Figure 2 are defined below. All Q values in Figure 2 refer to flood peak values after transformation to a specific catchment size. The data reflect those of a selected number of stations within a "similar hydrological region" during the same observation period.
Qx Regionally observed maximum flood peak, measured as the "record maximum flood peaks" from many sites within a "similar hydrological region" (one Qxi-value per site for the full observation period). Note that the Qx data set is a subset of the Qa data set.
Qa Regional annual maximum flow, measured as "annual maximum flows" from the same sites as above (one Qai-value per site per year, e.g. 5 000 values for 50 sites during an observation period of 100 years, thus including 50 Qxi-values)
Qxm Median of all Qxi-values
Qxx Extreme flood peak value that must be determined for a site (e.g. Q10 000 )
In a very large sample the AEP of Qxx at a selected site (defined as α2 in Equation (2) below) would be approximately equal to the number of Qai-values that exceed Qxx divided by the total number of all Qai values, which constitute the total outcome or sample space of Qa.
In Figure 2 the areas A1 and A2 below the Qa curve represent the number of Qai data points exceeding Qxm and Qxx respectively (for a "continuous" probability density function Qa this can be visualised by selecting one flood peak unit to be equal to one class interval). Similarly, the areas B1 and B2 below the Qx curve represent the number of Qxi data points exceeding Qxm and Qxx respectively. If the total area below the Qa curve is A and the total area below the Qx curve is B, then the cumulative probabilities of selected events can be expressed as follows:

Note that α2 is the selected AEP for which Qxx must be estimated.
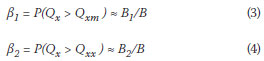
It should be noted that α1, α2, A1, A2 and A are within Qa sample space and β1, β2, B1, B2 and B are within Qx sample space.
It is reasonable to assume that the Qa curve and the Qx curve would coincide to the right of the Qxx value, because the Qxx value is a large and extreme value by definition. Thus:

Define f as the factor required to reduce A1 so that the Qa and Qx curves will approximately coincide to the right of the Qxm value. Thus:

or

From Figure 2 it is clear that f < 1,0. The Qxivalues represent record maximum flood peak values. Only one Qxi value is selected per station for the full observation period. It is therefore possible that there might be other Qai values that are also larger than Qxm but that are not the largest for a single station and thus do not qualify as Qxi values. That is why the Qx curve is shown below the Qa curve in Figure 2.
The equality of the proportions below follows from Figure 2 or Equations (5) to (7):

Substitute Equations (1) to (4) into Equation (8):

or

From the definition of the median:

thus

Equation (12) for β2 can also be obtained by using the theory of conditional probability (the above deduction is a simplified and illustrative version thereof). Equation (12) provides the necessary conversion to obtain the probability β2 in Qx space (Qxi data set) so that the value of Qxx can be determined by using the known (calculated) distribution characteristics of the variable Qx.
If it is assumed that Qx is log-normally distributed, then from the characteristics of the log-normal distribution:

where
Zβ2 = standardised normal variate obtainable from normal distribution tables corresponding to β2
Slog Qx = standard deviation (SD) determined from the log Qxi data
In summary, the algorithm consists of solving Equations (1), (6), (12) and (13) consecutively. The value of Qxx is finally determined from Equation (13).
Inspection of Equation (13) shows that the value of log Qxx depends on three parameters: the first two, namely log Qxm and Slog Qx depend on the distribution of Qx alone. It is clear that the distribution of Qx dominates the magnitude of the calculated extreme flood peak Qxx. The third parameter, namely Zβ2 is related to the AEP of the median Qxm in Qa sample space and is determined mainly from the distribution of Qa in accordance with Equation (12). In this way the Qa data set (annual maximum flows) is utilised to help calibrate the AEP of Qxx.
It is recommended that the Qxi data be presented graphically to check that the lognormal model (or any other selected model) is indeed an appropriate model. In most cases investigated so far correlation coefficients better than 0,98 have been obtained, demonstrating that the log-normal model is indeed a good theoretical model for simulating the distribution of Qx. Only moderate extrapolation is required to estimate the magnitude of extreme flood peaks up to Q10 000 (in the sense that 50 data points with an observation period of 100 years each would represent 5 000 station years).
Application in cases where adequate or complete records of Qa are not available
Unfortunately, annual records covering adequate record lengths may not be available for all sites included in a catalogue of "record maximum flood peaks". In such cases the value of f cannot be determined from Equation (6) and the value of α1 cannot be determined from Equation (1).
The value of f could then be estimated from those sites that do have adequate annual records. It has been found that for inland sites in South Africa the value of f approaches 1,0. The calculated value for an extreme flood peak such as Q10 000 is not very sensitive to the f-value. For example, if the f-value is reduced from 1,0 to 0,8, the Q10 000 value reduces only by about 4%. Assuming f = 1 could then result in slightly conservative flood peak estimates in some cases.
To be consistent, the value of α1 (AEP of the median Qxm in Qa sample space) must also be determined from regionally integrated information. Equation (1) could be applied to those stations that do have adequate annual records, on condition that there are an adequate number of such stations available. Other methods could also be used to determine the AEP of the median, as long as they have a regional basis. It has been found that α1 values typically fall between 1/50 and 1/200, and could thus be calculated fairly reliably by using available regionally based methods.
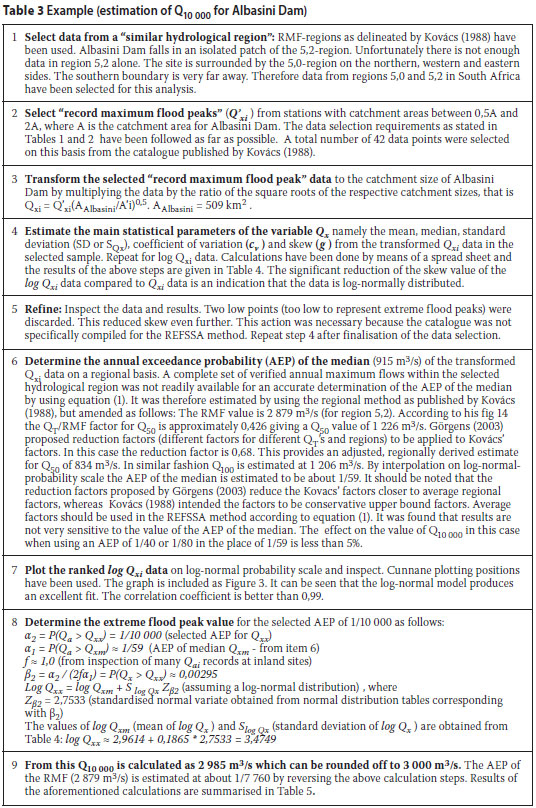
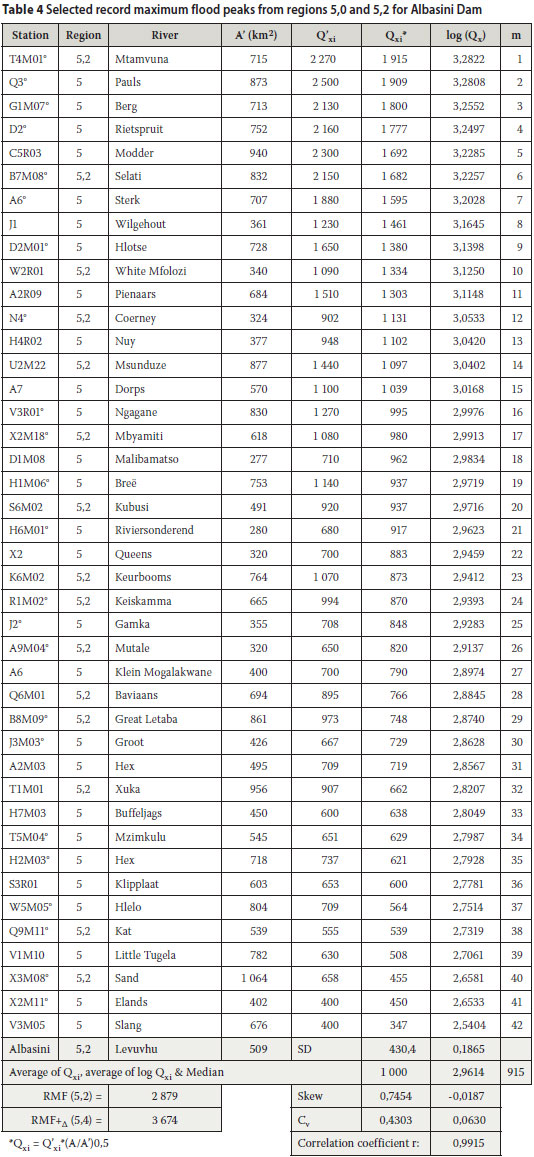
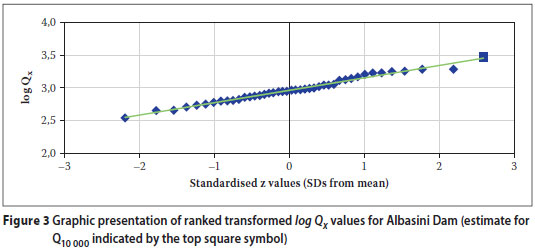
EXAMPLE: ESTIMATION OF Q10 000 FOR ALBASINI DAM SITE
An example to demonstrate the procedures and calculation steps for estimating extreme flood peaks such as Q1 000 to Q10 000 for a specific site is given in Tables 3 and 4 and the final results are given in Table 5. Figure 3 demonstrates the excellent correlation between selected log Qxi values and the regression line on the log-normal probability scale.
It is always good practice to do sensitivity analyses. Sensitivity could, for instance, be tested by selecting only data from the eastern part of South Africa (in which the site under investigation is located), or by selecting only data from region 5,2 (in which the site is located) if enough data points were available. Sensitivity for the estimated value of the AEP of the median should also be tested as was done under item 6 in Table 3.
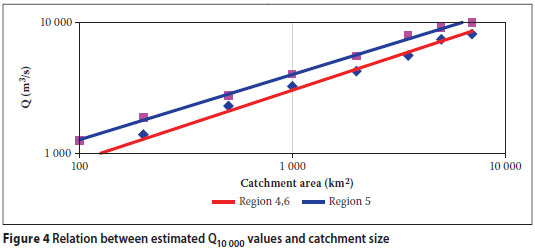
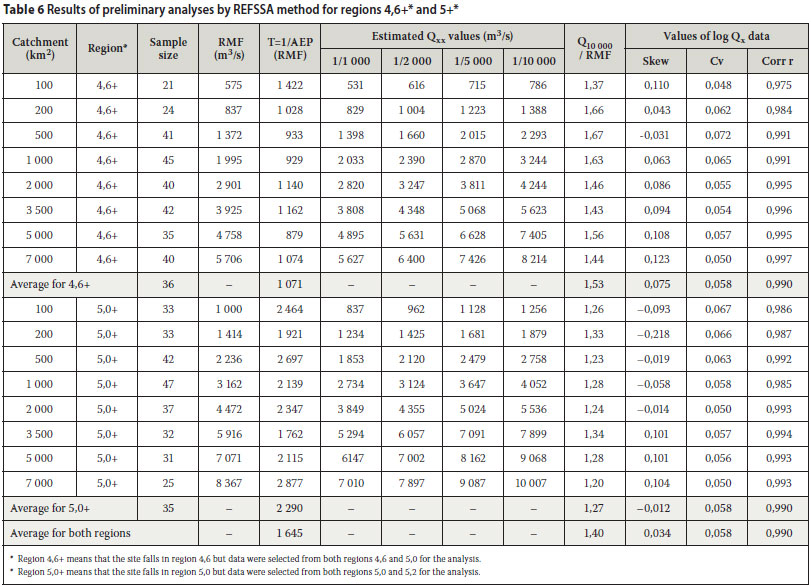
RESULTS OF SOME GENERALISED INVESTIGATIONS
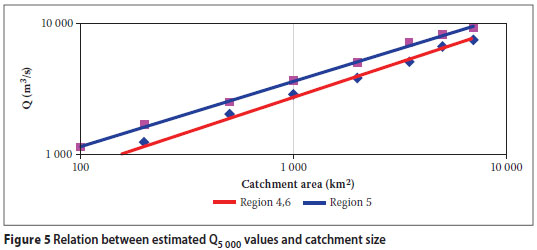
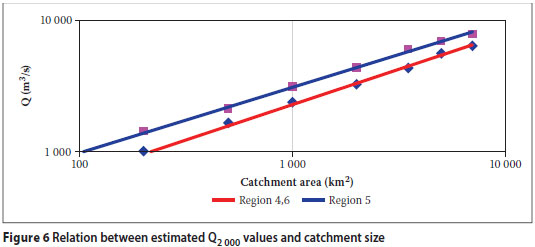
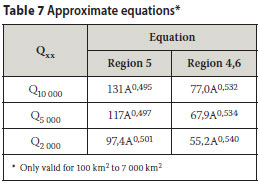
A number of different catchment sizes and hydrological regions have been analysed by means of the REFSSA method and the results are summarised in Table 6. The scope of the investigations was limited by the availability of verified data on extreme flood peaks. Consequently, the REFSSA method was tested only for South African regions 4,6 and 5,0 as demarcated by Kovács (1988) and for catchment areas between 100 and 7 000 km2.
Data were selected and handled as follows for the purpose of this investigation:
Discussion of results in Table 6
CONCLUSIONS
The applicability of the REFSSA method has been demonstrated for the estimation of extreme flood peaks in two major hydrological regions in South Africa. Despite limitations with regard to the quality and quantity of available "record maximum flood peak" data, relatively high correlation coefficients have been obtained between transformed "record maximum flood peaks" and regression lines (0,99 on average on log-normal scale as given in Table 6). This indicates excellent reliability within the hydrological environment and supports the theoretical basis of the REFSSA method.
Because the REFSSA method is new, caution should be exercised. Data selection should be done carefully in accordance with the selection requirements proposed in this paper. Sensitivity analyses should always be done to test sensitivity, for instance by using only data closer to the site under investigation, but still within the "similar hydrological region". Sensitivity should also be tested by varying the AEP of the median.
Although the REFSSA method could currently be regarded as one of the better methods in South Africa for determining the magnitude and AEPs of extreme flood peaks larger than Q1 000, the following limitations should be borne in mind:
RECOMMENDATIONS
The following further actions or investigations are recommended:
ACKNOWLEDGEMENTS
Zoltan Kovács (1988) must be recognised for publishing a useful catalogue of verified "record maximum flood peaks" in South Africa. The catalogue was based on records, surveys, estimates and documents compiled by the Department of Water Affairs, other organisations and individuals and these efforts must be commended. Without this catalogue this paper would probably not have seen the light. My colleague Mr C L van den Berg is thanked for checking the algorithm for correctness. The anonymous reviewers are thanked for their valued comments. Permission by the Department of Water Affairs to publish this paper is gratefully acknowledged. It should be noted that the opinions expressed in this paper are those of the author and not necessarily those of the Department.
REFERENCES
Alexander, W J R 2000. Flood risk reduction measures. Pretoria: University of Pretoria, Department of Civil Engineering. [ Links ]
Alexander, W J R 2009. Mathematics vs pattern recognition in water resource studies. Civil Engineering, 17(5). [ Links ]
Cunnane, C 1988. Methods and merits of regional flood frequency analysis. Journal of Hydrology, 100. [ Links ]
Francou, J & Rodier, J A 1967. Essai de classification des crues maximales. Proceedings, Leningrad Symposium on Floods and their Computation, UNESCO. [ Links ]
Görgens, A 2003. Design flood hydrology. Unpublished lecture notes. University of Stellenbosch & Ninham Shand. [ Links ]
Görgens, A 2007a. Joint Peak-Volume (JPV) Design Flood Hydrographs for South Africa. WRC Report No 1420/3/07, Water Research Commission, Pretoria, South Africa. [ Links ]
Görgens, A, Lyons, S, Hayes, L, Markhabane M & Maluleke, D 2007b. Modernised South African Design Flood Practice in the Context of Dam Safety. WRC Report No 1420/2/07, Water Research Commission, Pretoria, South Africa. [ Links ]
HRU (Hydrological Research Unit) 1972. Design flood determination in South Africa. Report No. 1/72, Johannesburg: University of the Witwatersrand. [ Links ]
Kovács, Z 1988. Regional maximum flood peaks in southern Africa. Technical Report TR 137, Pretoria: Department of Water Affairs. [ Links ]
SANCOLD 1991. Guidelines on safety in relation to floods. Pretoria: SANCOLD. [ Links ]
Wiltshire, SE 1986a. Regional Flood Frequency Analysis I: Homogeneity Statistics. Hydrological Sciences Journal. [ Links ]
Wiltshire, SE 1986b. Regional Flood Frequency Analysis II: Multivariate Classification of Drainage Basins in Britain. Hydrological Sciences Journal. [ Links ]
 Contact details:
Department of Water Aff airs
Private Bag X313 Pretoria
0001 South Africa
Tel: 27 12 336 8010 Fax: 27 12 336 8674
e-Mail: nortjej@dwa.gov.za
 | JAN NORTJE (Pr Eng, Member SAICE) graduated in 1973 and obtained his Master's degree in 1993, both in civil engineering and at the University of Pretoria. He joined the Department of Water Affairs in 1972 and has since specialised in dam engineering covering various facets, including design, construction and planning of dams. Since 1987, when he joined the Dam Safety Office, he has been working in the dam safety engineering field. Determination of appropriate "safety evaluation floods" for dams is one of the major challenges in dam engineering and this is what has inspired the current paper. |

