


Services on Demand
Article
 English (pdf)
 Article in xml format
 Article references
Indicators

Related links
-
 Cited by Google
 -
 Similars in Google
Share

 Permalink
Journal of the South African Institution of Civil Engineering
On-line version ISSN 2309-8775
Print version ISSN 1021-2019
J. S. Afr. Inst. Civ. Eng. vol.52 n.1 Midrand Apr. 2010
Wind-tunnel testing of sports stadia to optimise their use and safety
AM Goliger
ABSTRACT
Several wind-tunnel studies of sports stadia were recently carried out at the CSIR's Boundary-Layer Wind-Tunnel Laboratory in Pretoria. This paper gives a brief background to wind-tunnel modelling, highlights the relevant aspects of representing large structures and demonstrates the applicability and usefulness of boundary-layer wind-tunnel technology in addressing design challenges and optimising large-scale sports facilities.
Keywords: design, sports stadia, wind-tunnel testing
INTRODUCTION
In recent years large-scale global sports events and related venues have received significant international media coverage and socio-economic support from the hosting countries. This is especially evident in respect of all recent Olympic and FIFA tournaments for which in many cases several large and innovative sports facilities have been constructed.
Owing to their size, these structures generate wind-related environmental and loading interactions of significant magnitude. The interactions are determined by the structures' architectural form, as well as by the climatic and local conditions. Windrelated interactions include the environmental impact of wind within the structures' surroundings, environmental conditions over the pitch and grandstands, and the effect of wind loadings on roofs and other large elements (e.g. curtain walls). In view of the implications of failure, most, if not all, of the new sports stadia all over the world are subjected to comprehensive specialist wind studies, based on wind-tunnel testing and, in some cases, also to supplementary computational fluid dynamics (CFD) modelling of specific elements.
WIND-TUNNEL TESTING
Background and modelling principles
Boundary layer wind-tunnel technology is a fairly modern science of engineering aimed at a model-scale experimental quantification of interactions between wind flow and the built environment. Although the use of wind-tunnel technology started in the 1890s (including the experimentation of Gustav Eiffel), until the 1960s mechanical engineering-type wind tunnels were used in civil engineering applications. Only after that time was the necessity for boundary-layer modelling of the natural flow identified and implemented, largely due to the pioneering research work of Prof Alan Devenport of the Western Ontario University in Canada.
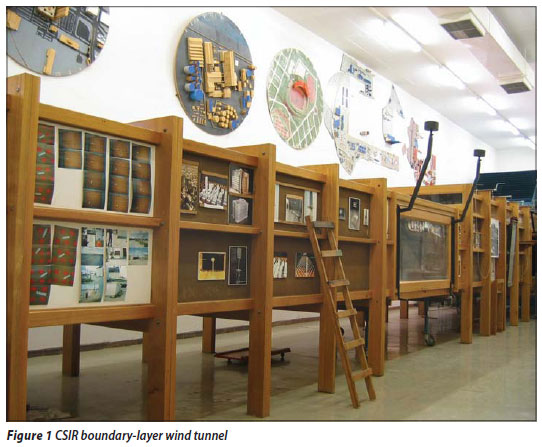
Figure 1 shows the CSIR's boundary-layer wind tunnel, which was established in the early 1980s. It is an open-circuit wind tunnel with a boundary-layer development length of 18 m and a cross-section of 2 m by 1 m, powered by a 75 kW variable-speed motor.
There are a large number of physical parameters involved in describing full-scale free-stream flow at low elevations. Boundary-layer modelling refers primarily to the simulation of the characteristics of strong winds in relation to the geometrical scale of building models to be tested.
The most important characteristics are the growth of the boundary layer in a vertical direction (i.e. the mean and peak wind-speed profiles), the turbulence profile and the spectral distribution of the turbulence (i.e. also the energy of the flow), and the related length scale of the turbulence (i.e. the spatial extent of gusts). A detailed discussion on wind-tunnel principles, applications and modelling techniques has been given by Milford et al (1988).
Comparison with full-scale situation and design standards
In the last 20 to 30 years wind-tunnel modelling has been widely used in civil engineering applications. Various studies have also been carried out to compare the data obtained from different laboratories across the world, to analyse the sensitivity of the wind-tunnel modelling process, and to validate the experimental results against full-scale measurements. (The latter comparisons are expensive in view of the overall costs of undertaking full-scale measurements.)
The boundary-layer laboratory at the CSIR has been involved in some of these studies (Goliger & Milford 1988; Milford & Goliger 1989; Milford et al, 1991). Overall, fair comparisons were achieved, especially in terms of the mean coefficients and trends in the data. On the other hand, there is an ongoing scientific debate related to the common finding that wind-tunnel measurements are not able to recreate the magnitude of the extreme pressures recorded at full scale for very small contributory areas. (These, however, are of lesser importance owing to the design philosophy in which the mean values of response are typically combined with the peak wind speeds.)
THE APPLICABILITY OF WIND-RELATED CONSIDERATIONS TO THE DESIGN OF STADIA
There are several wind-related considerations affecting the design and development of large sports stadia, namely:
the environmental impact of the wind microclimatic conditions over the surrounding areas
All these aspects, which determine the success of the design and future utilisation of sports facilities, can be addressed and investigated by using boundary-layer wind-tunnel technology, as demonstrated in this paper.
RELEVANCE OF WIND CLIMATE
The wind climate of a country has a substantial impact on the built environment in terms of the spatial and temporal characteristics (i.e. the probability of occurrence and duration) of wind action. The climate of South Africa is complex, with 24 climatic zones, ranging from subtropical (KwaZulu-Natal) and Mediterranean (Western Cape) zones to desert (Kalahari). Two distinct types of strong wind can be identified - namely inland, originating from convective activity, and coastal/frontal, due to low-pressure systems (Goliger & Retief 2002). Both types of synoptic condition signify fundamentally different characteristics of wind flow and this can be demonstrated by comparing the related magnitudes of the Gust Factor as presented in Table 1 (derived from the South African Design Loading Code SANS 10160).

All international wind-loading manuals and codified procedures are based on the loading characteristics achieved in a mature wind flow generated in frontal events. The comparison made in Table 1 signifies the ongoing dilemma of some countries (such as Australia or South Africa) regarding the adequacy of wind-loading design stipulations in reflecting the full-scale loading, especially in the case of large structures (e.g. tall buildings, bridges or stadia). This issue can be addressed by wind-tunnel modelling in which more representative wind flow conditions can be generated; the output data can also be presented in statistical terms.
NB. Strong inland wind events due to intense thunderstorms can also generate so-called "high-intensity winds" (tornadoes, down-bursts or microbursts). Although, from a spatial statistics perspective, their probability of occurrence at a specific place is very small, the wind speeds that are generated can exceed those stipulated in the SA Design Loading Code.
FITNESS FOR PURPOSE AND SERVICEABILITY
The most important aim of the built environment, including all engineering structures, is to fulfil the role for which it was intended, i.e. structures must be fit for the purpose for which they were constructed. Failure to do so could be related not only to loss of integrity (i.e. structural failure), but also to lack of acceptability by the end-users, leading to unacceptable or uneconomical levels of usage.
Wind-related damage to stadia
Despite substantial engineering inputs in the design and construction stages, wind damage to sports facilities in South Africa, and elsewhere in the world, is not unusual, although typically limited to secondary elements and sheeting. However, as mentioned above, intense thunderstorms and related phenomena can generate wind speeds in excess of the values defined in the design codes of practice for engineers. Such events can trigger substantial damage to engineered structures such as grandstand roofs of sports stadia, as shown in Figure 2.

Acceptability
Apart from the actual structural damage, unfavourable wind conditions persisting within a sports facility can also lead to failure of its utilisation. Such a situation can be described using as an example wind conditions which prevailed over one of the soccer stadia in South Africa.
Some years ago, due to financial limitations, it was decided to develop this stadium in stages. Initially, only two (westerly and easterly) grandstands were to be constructed and the remaining grandstands (i.e. southern and northern) were replaced with a temporary wind-protection measure in the form of earth berms, 5 m high. Unfortunately, the southern and northern directions corresponded to the prevailing directions of coastal winds and this resulted in unacceptable environmental conditions and thus serious underutilisation of the stadium.
Interviews with soccer players and officials (of SA Ajax and Santos) revealed several problems related to windy conditions prevailing over the pitch. Their comments can be summarised as follows:
"Under very windy conditions soccer becomes a game of luck and not skill, which precludes the implementation of any tactics, precision and communication between players, results in a significant disadvantage to the team playing against the wind, and therefore the pitch is rendered totally unacceptable for any event or training."
These factors, in turn, result in a poor spectacle with minimal spectator attendance and subsequent lack of support of the teams.
Wind-tunnel measurements of the stadium confirmed the large magnitude of the wind, its non-uniform distribution over the pitch and the clear disadvantage of the team playing against the wind. This is depicted in Figure 3 which presents the contour lines of relative windiness corresponding to a wind azimuth of 160º, this being the most critical direction of the frontal south-easterly winds along the coast of the Western Cape.

LOCALITY
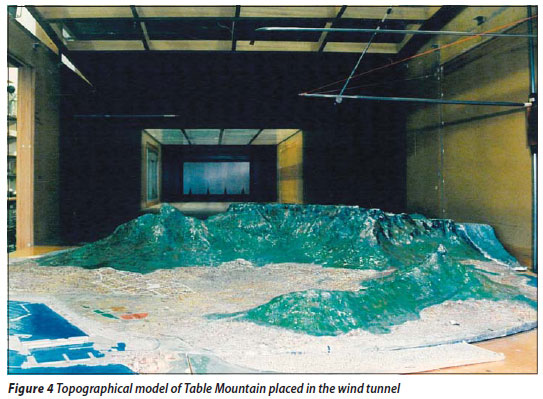
Local influences typically refer to the character of the surrounding terrain, which determines the boundary-layer conditions of the approaching flow, and also the topographical influences (if applicable). SANS 10160 provides information on the standard boundary-layer profiles to be used in the design and also simple guidelines on the topographical influences applicable to "gentle" topography only. This information was not relevant to a proposed new stadium in Cape Town, located in the close vicinity of a prominent topographical feature, namely Table Mountain. The relevant information on wind profiles and directional characteristics of flow affected by the mountain was obtained from topographical wind-tunnel measurements using a model of Table Mountain (see Figure 4).
WIND ENVIRONMENTAL ASPECTS
The environmental aspects of the design can be considered in terms of the wind, i.e. environmental impact of the proposed structure, environment over the pitch, conditions at the pedestrian traffic and access routes, and conditions affecting the spectators. Each of these aspects will now be discussed.
Environmental impact
Like any other structures of substantial size, large sports stadia significantly affect and modify pedestrian wind environmental conditions within their surroundings (i.e. around the outside perimeter), and these influences should be considered in the design of stadia, especially those located in windy places (e.g. Cape Town or Port Elizabeth).
The conditions can either be improved (e.g. due to shielding) or deteriorated (as a result of flow separation or acceleration). Figure 5 illustrates the unacceptable/dangerous wind conditions experienced by pedestrians in the vicinity of large structures in the city centre of Cape Town.

Pedestrian wind conditions can be predicted on the basis of wind-tunnel measurements, which could subsequently be combined with representative full-scale wind data pertinent to the area of concern. Such a multifaceted integration process, based on the extreme value distribution, in combination with statistical algorithms of the boundary layer, has been developed at the CSIR's wind-tunnel laboratory. (More information on this topic is given in Goliger & Richards 1997.)
Figure 6 presents a sample graph of wind speed probability distribution, which was predicted at a location outside one of the stadia. The criteria of human wind comfort (lines H1-H3), developed on the basis of international research (Melbourne 1978; Murakami et al 1982), are also superimposed. These reflect the higher tolerance levels of pedestrians in windy/coastal cities (index H) and are given in terms of three ranks or comfort lines:
Figure 6 indicates that statistically, on average, per year:
Such conditions are unacceptable and dangerous to pedestrian traffic outside the stadium and could be rectified by introducing relevant remedial measures (e.g. optimally positioned architectural or landscape elements), which could be investigated in the wind tunnel.
Environment over the pitch
As discussed above, wind conditions prevailing over the pitch at the time of a sporting event have a significant impact on the quality/ fairness and outcome of the game.
Due to the ever-increasing competitiveness of sports, two wind characteristics become of relevance to the spectacle, namely the distribution of wind in terms of both strength and direction. Both quantities can be investigated in the wind tunnel. An example of a directional flow pattern obtained for one of the stadia, corresponding to a specific wind azimuth of an approach flow, is presented in Figure 7. It can be seen that for the approach geographical wind azimuth of 90º, the local wind conditions are turbulent, fairly symmetrical in respect of the centre of the field, and without any straight-through air flow that could potentially disadvantage one of the sides. Wind-tunnel measurements of this type should be considered for all wind azimuths relevant to the site (i.e. geographical location).

A typical outcome of the quantitative wind speed distribution is presented in Figure 3. This distribution indicates a high magnitude of relative wind speeds (up to 1,2 at the top right-hand corner), significant disparity between wind strength over both sides of the pitch, and insufficient protection provided by grandstand roofs and the earth berms.
Wind conditions over the pitch are determined by the overall form of the stadium, its aspect ratio and its aerodynamic "porosity".
This is particularly relevant to the number, distribution and form of the openings at lower levels of the "bowl" of the stadium. Figure 8 gives the results of an investigation into the closure of the emergency entrances at the corners of the stadium, which are used to give large vehicles access to the pitch.

It can be seen that the introduction of an emergency access gate (see Figure 8b) visibly improves the wind conditions. Without the gate in place (see Figure 8a), accelerated wind draught will prevail in the access tunnel, with strong winds in the corner and the penalty areas (with relative wind speeds of between 0,6 and 0,75). The presence of the gate reduces the magnitude of windiness in all these places. It must be noted that conditions over the corners of the pitch play a vital role during the execution of "corner-kicks" in the game.
Conditions at the pedestrian traffic routes and access routes
Wind-tunnel technology also enables the design of a stadium to be optimised with respect to improving pedestrian wind conditions over the areas envisaged for spectator traffic. This is to enable the safe and comfortable passage of people from the external entrances, via stairs or ramps, towards the upper-level terraces and finally via so-called "vomitories" (entrances) into the bowl of the stadium.
The conditions in these areas are very complex and are determined by the interrelationship between several geometric factors such as the distribution and sizes of openings, the orientation of passages, etc. These complex aerodynamic relationships can either be assessed at full scale (i.e. on the completion of the stadium - which is already too late for any changes), or proactively - in the wind tunnel.
Figure 9 presents an example of wind-tunnel results in which a comparison is made between the wind conditions that will develop under the critical azimuth of prevailing winds, within several vomitories of the eastern and southern grandstands of the stadium. It can be seen that the conditions will differ significantly, with relative windinesses of between 0,2 and 1,1. In terms of the wind pressures or forces (and due to the quadratic relationship with wind speeds), there are 30-fold differences between the various vomitories.

In several of the vomitories, wind conditions were found to be unacceptable and measurements were subsequently done to find the optimal way of improving the situation. Figure 10 gives comparative results of wind speed measurements at a few selected vomitories, corresponding to two generic situations in which the passage (concourse) behind the vomitories was kept either open or closed with a curtain wall. This comparison is given in a form similar to that used in the regression analysis. In this analysis each of the measured quantities at a certain vomitory, for a given wind direction and without the curtain wall, is compared with an equivalent quantity corresponding to the situation with the curtain wall in place. In an ideal 100% correlation (i.e. no difference in wind conditions), all data points would be grouped along the diagonal line at 45º to the horizontal axis. The data point closer to one of the axes (i.e. arrangement) indicates that this arrangement generates more windiness. It can be clearly seen that all the data points fall below the regression line and this indicates significantly better wind conditions with the curtain wall in place.

Conditions affecting the spectators
The success of a sporting spectacle entails the attendance of spectators which, in turn, implies their long-term outdoor exposure. Due to harsh and often unpredictable climatic conditions, several large sports facilities in Northern Europe and North America have resorted to the total closure of their roofs or the introduction of retractable roof systems. Although in South Africa the climatic conditions are of lesser relevance, efforts are made to protect spectators from adverse exposure to sun, rain and wind by costly roofing-off of the grandstands. The environmental wind conditions that will prevail over the seating of the grandstands of a stadium can be investigated and predicted in a wind tunnel. This is especially relevant to stadia located in coastal cities.
Wind characteristics in various areas of a grandstand are determined by site-specific climatic influences, and by the geometrical form and "aerodynamic porosity" of the bowl of a stadium. These can be quantified by using the statistical methodology described in relation to Figure 6. Furthermore, a wind tunnel can also be used as a tool to optimise certain architectural details and to reduce their negative influences on wind flow. For example, comparative wind-tunnel measurements of various options for connecting the grandstand and its roof were undertaken for one of the stadia. The results indicated that the relative size of the "venting gap" at the top of the grandstand affects the wind conditions over a limited distance only (say along the top five to eight rows of seats).
STRUCTURAL DESIGN OF ROOFS
Wind loadings
The wind loadings that are generated on large open roofs of small inclination can be significant, in terms of both the overall uplift loading for the design of the supporting structure, and more localised loadings due to extreme pressures, for the design of the sheeting and its fixings. For example, a large roof encircling the entire pitch of a stadium can generate an overall resultant uplift in the order of 1 000 tons, while localised peak pressure coefficients of -14 were measured along a leading edge of a roof of a soccer stadium (Hansen et al 1992).
In view of the magnitude of the wind forces that are generated and the possibly severe consequences of structural failure, it would be unreasonable and foolhardy simply to apply the generic design information given in some of the loading standards to canopy roofs and/or grandstand roofs. Furthermore, in the case of a grandstand roof encircling the entire stadium, the interference effects from the section of the grandstand on the other side of the pitch may be serious. Although typically this would introduce shielding effects which reduce the upwind forces, in some cases the upwind large surfaces may generate a fluctuating downwash, resulting in substantial downward forces acting on the lee-side section of the roof. Melbourne (1995) suggests that if there is any upstream structure capable of shedding wake vortices of length scales of the order of the cantilever roof length, then allowance should be made for a downward force acting in combination with the dead weight of the structure.
Aerodynamic factors
There are several geometric and aerodynamic factors that determine the air flow regime, i.e. the magnitude and distribution of wind loadings over the grandstand roofs. These can be summarised as follows:
In view of the infinite complexity and permutations of arrangements of these parameters, it is impossible to determine their mutual relationships/combined influences and wind-tunnel technology is the only reliable method to determine the resultant wind loading. (The combined influences may, in some cases (e.g. areas of the roofs), result in the wind loadings being higher than those that one would extrapolate on the basis of the generic information given in the design codes, and this, in fact, was the case in one of our wind-tunnel studies. Furthermore, another investigation indicated that an increase in the extent of the roof by just a few metres, which modified the spatial relationship between its edge and other elements of the stadium, would visibly increase the magnitude of pressures generated over one of its surfaces.)
Modelling for pressure measurements
Figure 11 shows a pressure model of a stadium and its immediate surroundings (within a radius of 500 m at full scale) placed on the wind tunnel's turntable. (The turntable enables us to recreate the approach wind flow from all wind azimuths.) The character of the approach terrain, which influences the boundary-layer profile, is represented by the roughness at the approach to the model.

Measurements of wind loading can be undertaken by using two types of technology, namely force balance and pressure measurements. Force balance modelling allows the overall forces acting on sections of roofs or other elements to be determined. An example of a force balance model of a section of a grandstand roof, instrumented with strain gauges, is presented in Figure 12.

In recent years, due to the marked improvements in the large-frequency multichannel data measuring and capturing systems, pressure measurement models have become more attractive and popular. This is also due to their ability to provide comprehensive output information related to the distribution of:
Historically, wind-tunnel measurements of pressures over large open roofs were carried out separately on both sides of the roof and the resultant coefficients were then integrated as vectors normal to the surfaces (i.e. taking into account their direction). This approach typically results in conservative values as it assumes full correlation of extreme peaks over both surfaces.
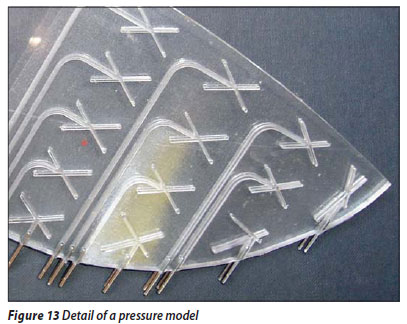
Recently, most (although not all) of the leading international wind-tunnel facilities have adopted an approach of simultaneous measurements and area averaging of pressures on both surfaces of open roofs. Such a methodology and the related technology and instrumentation, which will not be discussed in any detail in this paper, have also been developed and adopted by the CSIR's boundary-layer wind-tunnel laboratory. A close-up of a model of the roof of one of the stadia is presented in Figure 13. It was constructed out of Perspex, machined on both sides, laminated and subjected to a thermal process in order to achieve the required form. (The stainless-steel tubing integrated with the Perspex enables the transition of pressure tubing connecting the pressure-measuring instrumentation.)
Design inputs
Wind-tunnel pressure measurements, which involve several calibration and filtering processes, are carried out for the entire range of wind azimuths at a predetermined step, typically between 15º and 25º. However, for critical wind directions, corresponding to the highest loading response, more finite steps (2º or 3º) are also investigated. Subsequently, the relevant net pressure coefficients are computed in terms of the resultant:
 Δp Δp | mean pressure coefficient |
 Δp Δp | root-mean square pressure coefficient |
| ĈΔp(3) | expected positive peak of the net pressure coefficient (3 s averaging time) |
| ČΔp(3) | expected negative peak of the net pressure coefficient (3 s averaging time) |
| ĈΔp(10) | expected positive peak of the net pressure coefficient (10 s averaging time) |
| ČΔp(10) | expected negative peak of the net pressure coefficient (10 s averaging time). |
The expected positive and negative peaks of the net pressure coefficients are determined on the basis of an extreme value analysis process. (Following the approach of SANS 10160, the 3-s averaging time is appropriate for the design of small elements, e.g. sheeting and its fixing, while the 10-s averaging time is appropriate for the design of large elements and overall loads.)
A typical example of wind-tunnel results for one of the loaded panels of a roof, in terms of the 3-s averaging time, is presented in Figure 14a. It can be seen that for this specific panel, the largest loading response will be generated for the 90º azimuth with a mean pressure coefficient of nearly -2,0 and a negative peak pressure coefficient of more than -3,5.
Figure 14b presents the variation of pressure coefficients with wind azimuths for a large panel with vertical glazing enclosing the grandstand of another stadium. In this case the highest mean pressure coefficients are about -0,75 and +1,25 acting in both directions (i.e. inwards and outwards of the structure) and the critical wind azimuths are 60º and 120º respectively. The corresponding values of pressure coefficients in terms of the 10-s averaging time are -2,5 and +2,7.

The relevant/critical design values obtained from the wind-tunnel measurements can then be incorporated into the design process stipulated in the structural loading code, SANS 10160. The format of the wind-tunnel data enables the utilisation of two generic methods of integration:
CONCLUSIONS
The paper has provided an overview of windrelated design aspects of large sports stadia and demonstrated the applicability of boundary-layer wind-tunnel technology to the design process. This technology enables the functional and safety-oriented design of large modern sports facilities to be optimised by investigating the wind environmental characteristics that will prevail at various internal and external areas, as well as determining the magnitude of the structural design loading applicable to specific geometrical forms and the distribution of openings.
ACKNOWLEDGEMENT
We would like to acknowledge professional interactions with several local and international consultants, namely AKI Consulting Engineers (Axis), BKS (Pty) Ltd, Connell Mott MacDonald, Goba Consulting Engineers & Project Managers, Iliso Consulting Engineers Project Managers, Junker Barnes Architects, MLH Architects, Ove Arup, Platinum Sport Consulting, R&L Architects, Roodt Partnership, Schlaich Bergermann und Partner, and Wacker Ingenieure, as well as the development consortia involved in the design and construction of the sports stadia in Athlone, Bloemfontein, Green Point and Mbombela. Most of the wind-tunnel measurements were conducted by Mr T van Wyk of the CSIR or under his supervision.
REFERENCES
Goliger, A M & Milford, R V 1988. Sensitivity of the CAARC standard building model to geometric scale and turbulence. Journal of Wind Engineering and Industrial Aerodynamics, 31: 105-123. [ Links ]
Goliger, A M & Retief, J V 2002. Development of zones of strong wind events in South Africa. Journal of Wind Engineering and Industrial Aerodynamics, 90: 1227-1235. [ Links ]
Goliger, A M & Richards, C 1997. Environmental impact studies to address wind nuisance. Planning - Architectural and Planning Review for Southern Africa, 154: 70-75. [ Links ]
Hansen, S O, Hojholt, P & Nielsen, K 1992. Wind load on grandstands around full perimeter of a stadium. Journal of Wind Engineering and Industrial Aerodynamics, 42(1-3): 1423-1434. [ Links ]
Melbourne, W H 1978. Criteria for environmental wind conditions. Journal of Wind Engineering and Industrial Aerodynamics, 3(2-3): 241-249. [ Links ]
Melbourne, W H 1995. The response of large roofs to wind action. Journal Wind Engineering and Industrial Aerodynamics, 54-55: 325-335. [ Links ]
Milford, R V, Goliger, A M & Beattie, G L 1988. Wind tunnel testing for civil engineering applications. The Civil Engineer in South Africa, 30(3): 103-111. [ Links ]
Milford, R V & Goliger, A M 1989. Comparative wind tunnel studies on model buildings: Pressure measurements. The Civil Engineer in South Africa, 31(8): 243-257. [ Links ]
Milford, R V, Goliger, A M & Waldeck, J L 1991. Jan Smuts experiment: comparison of full-scale and wind-tunnel results. Proceedings, 8th International Conference on Wind Engineering, London, Ontario, Canada, pp 1715-1716. [ Links ]
Murakami, S 1982. Wind tunnel modelling applied to pedestrian comfort. Proceedings, International Workshop on Wind Tunnel Modelling Criteria and Techniques in Civil Engineering Applications, Gaithersburg, Maryland, USA, pp 486-503. [ Links ]
SANS 10160-1989. (Reprinted 1994). South African Standard Code of Practice for the General Procedures and Loadings to be Adopted in the Design of Buildings. South African Bureau of Standards, Pretoria. [ Links ]
 | DR ADAM GOLIGER obtained his MSc degree from Warsaw Technical University and his PhD from Stellenbosch University, both in structural engineering. Since 1985 he has been involved in research and consulting work at the CSIR, directed at wind effects on structures. This has included wind-tunnel simulation and modelling techniques, wind damage and environmental studies around buildings. For several years he served as the South African representative on the International Association for Wind Engineering (IAWE) and participated in various local and international committees. He is the author or co-author of nearly 70 scientific publications. |
 Contact details:
CSIR Built Environment
PO Box 395
Pretoria, 0001
T: 012 841 2472
F: 012 841 2539
E: agoliger@csir.co.za

