Serviços Personalizados
Artigo
Indicadores
Links relacionados
-
 Citado por Google
 -
 Similares em Google
Compartilhar
Journal of the South African Institution of Civil Engineering
versão On-line ISSN 2309-8775
versão impressa ISSN 1021-2019
J. S. Afr. Inst. Civ. Eng. vol.52 no.1 Midrand Abr. 2010
Infilling annual rainfall data using feedforward back-propagation Artificial Neural Networks (ANN): application of the standard and generalised back-propagation techniques
M Ilunga
ABSTRACT
Water resource planning and management require long time series of hydrological data (e.g. rainfall, river flow). However, sometimes hydrological time series have missing values or are incomplete. This paper describes feedforward artificial neural network (ANN) techniques used to infill rainfall data, specifically annual total rainfall data. The standard back-propagation (BP) technique and the generalised BP technique were both used and evaluated. The root mean square error of predictions (RMSEp) was used to evaluate the performance of these techniques. A preliminary case study in South Africa was done using the Bleskop rainfall station as the control and the Luckhoff-Pol rainfall station as the target. It was shown that the generalised BP technique generally performed slightly better than the standard BP technique when applied to annual total rainfall data. It was also observed that the RMSEp increased with the proportion of missing values in both techniques. The results were similar when other rainfall stations were used. It is recommended for further study that these techniques be applied to other rainfall data (e.g. annual maximum series, etc) and to rainfall data from other climatic regions.
Keywords: rainfall data infilling, artificial neural network, back-propagation
INTRODUCTION
A considerable amount of data on hydrological variables such as rainfall, streamflow, etc are required for the planning, management and effective control of water resource systems. Annual rainfall is used for agricultural planning since the total amount of rainfall is among the most important factors that affect agricultural systems. Crop production in semi-arid regions like South Africa is largely determined by the annual total rainfall; however, rainfall is the limiting factor in these areas. Sometimes hydrological data series have missing values or are incomplete. In such cases, the reliability of the design of, for example, a hydropower plant and the construction of dams, can be severely affected. Limited financial resources, poor management of data related to water resources, temporary absence of observers, cessation of measurement or no reliable hydrological networks can lead to incomplete or missing data in hydrological time-series. This situation is common in developing countries.
In South Africa, for example, the overwhelming majority of gaps are caused by the temporary absence of observers, the cessation of measurement or absence of observations prior to the commencement of measurement (Makhuvha et al 1997). In Bolivia, due to the limited financial resources, even a minimum national network could not be achieved according to the meteorological network density ratio (Balek 1972).
Developing countries generally lag behind in the use of new technologies to process their statistical data (Sadowsky 1989). Yet their needs are just as great; they need to achieve a viable statistical data processing capability if they are to provide, on a continuous and sustained basis, the essential statistical information needed for their development planning and administration (Sadowsky 1989). Most of the old data for developing countries have been lost due to non-existent database storage (Medeiros et al 2002).
Several hydrological data infilling techniques have been developed. These techniques include artificial neural networks (ANNs), regression methods, deterministic models, stochastic models for rainfall-runoff modelling, flood forecasting/prediction and water quality modelling (Lawrence et al 1996; Minns & Hall 1996; Raman & Sunilkumar 1995). Although several studies indicate that ANNs have proven to be potentially useful tools in hydrology, their disadvantages should not be disregarded (ASCE Task Committee 2000b). The success of an ANN application depends both on the quality and the quantity of data available (ASCE Task Committee 2000b). This requirement cannot go back far enough. Quite often the requisite data are not available and have to be generated by other means, such as another well-tested model. Even when long historical records are available, it is not certain that conditions have remained homogeneous over the time span. Therefore data sets recorded over a period that was relatively stable and unaffected by human activities are desirable. Yet another limitation of ANNs is the lack of physical concepts and relations. The lack of a standardised way of selecting a network architecture has also been criticised. The choices of network architecture, training algorithm and definition are usually determined by the user's experience and preference, rather than by the physical aspects of the problem (ASCE Task Committee 2000a,b)
Despite the criticisms levelled against ANN techniques (ASCE Task Committee 2000ab), they were found to be powerful tools when compared to multivariate regression-based models for infilling streamflow data (Panu et al 2000). Kuligowski and Barros (1998) showed that ANNs gave promising results in the estimation of missing rainfall data when compared to other methods such as regression techniques. ANN techniques can be used to express a non-linear mapping between variables with no prior assumptions as to the variables (linear or non-linear as in regression methods), and these techniques can cope with missing data (French et al 1992). Over the past decade, ANNs have been used intensively in hydrology and water-related fields (Lawrence et al 1996; Minns & Hall 1996; Raman & Sunilkumar 1995; French et al 1992; Wilby & Dawson 1998). However, the application of ANNs for infilling rainfall data remains limited. In addition, there is nothing in the literature on the use of the generalised BP (back-propagation) ANN technique for infilling hydrological data, specifically for rainfall data, which generally show a relatively high variability both in time and space.
This paper discusses feedforward ANN techniques used for rainfall data infilling. The standard back-propagation (BP) technique (Freeman and Skapura 1991) is compared to the generalised BP technique which has been introduced for the first time in hydrology, specifically for rainfall data infilling problems. Note that the generalised BP was initially used for different problems which included the "Exclusive-Or" problem (XOR) and the 3-bit parity and 5-bit counting problems (Ng et al 1996). The root mean square error of predictions (RMSEp) is then used as a criterion to evaluate the performance of these two techniques. A case study is presented to demonstrate the performance of the two techniques. The terms algorithm and technique are used interchangeably in this paper.
HYDROLOGICAL DATA INFILLING TECHNIQUES
Overview of Artificial Neural Networks (ANNs)
ANNs are networks of interconnected simple units (nodes) based on a greatly simplified model of the human biological system, which are capable of representing non-linear and complex interactions between variables without prior specification. There are two main types of ANNs: feedforward networks (where the signal is propagated only from the input nodes to the output nodes) and recurrent networks (where the signal is propagated in both directions). The advantage of ANNs, even if the "exact" relationship between sets of input and output data is unknown but is acknowledged to exist, is that they can be trained to learn that relationship, and require no prior underlying assumptions (non-linear vs linear) as in conventional methods. ANNs are regarded as ultimate black box models (Minns & Hall 1996). ANNs were shown to be generally superior in sediment yield models when compared to linear transfer function models (Argawal et al 2005). ANNs seek to learn patterns, but not to replicate the physical processes of transforming input to output (Minns & Hall, 1996). As opposed to conventional methods, ANNs are thought to have the ability to cope with the missing data and, perhaps most importantly, are able to generalise a relationship from small subsets of data while remaining relatively robust in the presence of noisy or missing inputs. Thus ANNs can learn in response to a changing environment (Wilby & Dawson 1998). Since the early 1990s, ANNs have been successfully used in the area of water resource engineering related to rainfall/runoff forecasting (Minns & Hall 1996; Agarwal & Singh 2001); streamflow data infilling (e.g. Panu et al 2000; Khalil et al 2001; Elshorbagy et al 2000; Ilunga & Stephenson 2005); validation and correction of high-frequency water quality data (Quilty et al 2004) and rainfall data infilling (Kuligowski & Barros 1998). The latter authors used ANNs to estimate the missing rainfall data at the target rainfall station from nearby rainfall stations. The issues of data quality for computational intelligence in earth sciences were also discussed by Cherkassy et al (2006). However, the application of ANNs hydrological data infilling is still very limited, specifically for rainfall data infilling. Some authors (e.g. Panu et al 2000; Khalil et al 2001; Elshorbagy et al 2000, Ilunga & Stephenson 2005) developed ANN techniques for cases where data were available before and after missing periods of data (e.g. consecutive missing values). Three-layered ANNs have been used intensively for that purpose. The hidden-layer feedforward neural network is one of the most common architectures used by neurohydrologists (Panu et al 2000; Khalil et al 2001; Elshorbagy et al 2000; French et al 1992; Minns & Hall 1996; Agarwal & Singh 2001). These hydrologists believe that certain problems in hydrology and water resources can be solved using ANNs.
Standard back-propagation (BP) technique
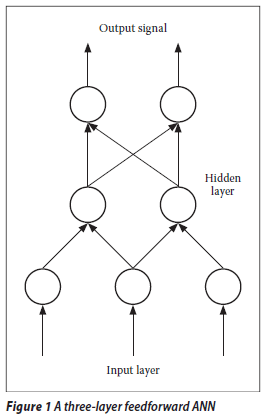
The standard BP technique is only outlined in this section and for more details the reader is referred to, for example, Freeman and Skapura (1991). Given a three-layered ANN as depicted in Figure 1, in standard BP the adjustment of the interconnecting weights during training employs a method known as error back-propagation in which the weight associated with each connection is adjusted by an amount proportional to the strength of the signal in the connection and the total measure of the error. The total error at the output layer is then reduced by redistributing this error value backwards through the hidden layers until the input layer is reached. This process is repeated until the total error for all data sets is sufficiently small. The weight changes to the output layer and hidden layer are given by Equations (1) and (2) respectively:

where i is the unit node in the input layer, j is the unit node in the hidden layer, p is the pattern, k is the neuron related to the output layer, η is the learning rate, δpk0 and δpjh are error terms (which encompass a derivative part) for output units and hidden units respectively, t is the t-th iteration, wkj0(t) and wjih (t) are weights in the output layer and the hidden layer respectively at t-iteration, and xi and ipj are inputs to unit nodes i and j respectively.
For practical considerations, it is sometime suggested that the bias terms be removed altogether, i.e. their use is optional (Freeman & Skapura 1991).
In the standard BP, the learning process is done through both sequential and batch modes. In the former mode the process of learning is governed by the error of each data set and the weight update is made for each sample of the training, and in the latter mode the weights at each iteration are adjusted only after all the data sets have been processed.
An activation function is used to express the non-linear relationship process between the input and output data. This function can be any threshold function or any continuous function. It is normally a monotonic non-decreasing function and differentiable everywhere for x values. The activation function most commonly used is a sigmoid, non-linear continuous function between 0 and 1 and is represented as follows:

Freeman and Skapura (1991) proposed that a range of x values from 0,1 to 0,9 should be used for practical purposes. This range is adopted in this paper. Thus the input data and the output data will be scaled (during training of ANNs) to adhere to the above range. A linear scaling was used in this paper. For ANNs, input data and output data scaling can speed up the convergence of the neural system. It also gives each input equal importance, prevents premature saturation of the activation function and aids the generalisation capability (i.e. neural networks can approximate values that they did not see during training). Therefore the equations used in this paper should not contain any unit as they apply to scaled numbers used during the training of ANNs.
The majority of ANNs applied in water resources involve the use of feedforward propagation. The standard BP (which is a gradient descent method) has been criticised because convergence to an optimal solution is not always guaranteed (Agarwal & Singh 2001). In other words, the method guarantees that the algorithm will find the nearest local minimum. Consequently, the solution often follows a zig-zag path while trying to reach the minimum error position, which may slow down the training process (ASCE Task Committee 2000a). Thus several variants of BP such as Bayesian regulation, the conjugate gradients method, adaptive stepsize, the Levenberg-Marquardt algorithm, causal recursive BP, Maclaurin pseudo-power series, and the generalised BP introduced recently by Ilunga and Stephenson (2005), were proposed. Despite these criticisms, it appears that in practice BP leads to solutions in almost every case and that standard multilayer feedforward networks are capable of approximating any measurable function to any desired degree of accuracy, as stated by Minns and Hall (1996). In the following section the generalised BP algorithm is briefly described.
Generalised BP algorithm
The main reason for criticism of the use of standard back-propagation is due to the derivative of the sigmoid activation function (Ng et al 1996). When the actual output of the -th output neuron for the p -th pattern (i.e. opk) approaches the extreme values such as 0 or 1, the derivative of the activation function having the factor opk (1 - opk) will not be significant, and the BP error signal will become very small (Ng et al 1996). Thus the output can be maximally wrong without producing a large error signal. The algorithm can be trapped into local minima. Consequently the weight adjustment of the algorithm can be very slow or even suppressed. Therefore a generalisation of the derivative of the activation function (i.e. logistic) is proposed so as to improve the convergence of the learning process by preventing the error signal dropping to a very small value.
In generalised BP, the error signals for the output layer and hidden layer now become:

where opk is the target output, netpk is the net input to the output layer, netpk is the net input to the hidden layer, fk0' is the first derivative of the sigmoid function for the k-th neuron in the output layer,  is the first derivative of the sigmoid function for the j-th neuron in the hidden layer, k, h and j have been previously defined, and b is the generalisation parameter. In this case b > 1. For b = 1, this results in the standard BP algorithm.
The effect of generalised BP is to change the slope of the sigmoid function in the two "tail" regions. For b  1, errors will be significantly enlarged when opk approaches a wrong value, and hence the error signals will reflect the true error (ypk - opk) more appropriately. The generalised BP technique was applied to different problems including the "Exclusive-Or" problem XOR and the 3-bit parity and 5-bit counting problems (Ng et al 1996). The results were not good for b
  50. However, this technique has not yet been applied in hydrology or water-related fields, specifically for data infilling problems.
TESTS OF HYPOTHESES AND SIGNIFICANCE
Tests were performed to determine whether the statistics (e.g. mean and standard deviation) of the infilled annual rainfall totals are significantly different from the observed annual rainfall totals at the target stations.
In practice a level of significance of 0,05 or 0,01 is customary, although other values are used. In other words, there is about a 5-in-100 chance that the hypothesis will be rejected when it should be accepted. There is a 95% confidence level that the right decision is made.
The tests on means and standard deviations are performed as explained by Spiegel and Boxer (1972). The tests are explained in the following sections.
Test on means
For large sample sizes N (N > 30), the sampling distribution of the statistic can be assumed to be a (nearly) normal distribution with mean  and standard deviation s. The test is performed based on the following rule decision or test of hypothesis or significance:
(a) Reject the hypothesis at a 0,05 level of significance if the Z score of the statistic (e.g. mean) lies outside the range -1,96 to 1,96. In the case of means, the null hypothesis H0 : µ = µ0 is tested against the alternative hypothesis Ha : µ ≠ µ0 (where µ0 is the population mean).
(b) Accept the hypothesis (or if desired make no decision at all).
The Z score is computed using the following equation:

Where µ and σ are the mean and standard deviation of the population and  is the sample mean (with s =
 )
)
Test on standard deviations
For large values of the degrees of freedom γ, (γ> 30), (with γ = N - 1) and using the chi-square( 2) test, the 95% confidence limit is given by:

 and
and  are calculated as follows:

DATA AVAILABILITY
The annual rainfall totals for the Bleskop station (SAWS gauge no 02284170) and the Luckhoff-Pol station (SAWS gauge no 0228495) were considered for this preliminary study to test the performance of the two techniques, i.e. standard BP and generalised BP. (These two rainfall stations were selected randomly.) These rainfall stations are about 20 km apart and belong to the secondary drainage region named D33 of the Orange River Drainage System (D) of South Africa. The monthly rainfall data were obtained from the report by Midgley et al (1994). The geographical location and other characteristics of the selected rainfall stations located in the summer rainfall zone are listed in Tables 1 and 2.


Gauge 0228495 (Luckhoff-Pol) was taken as the target gauge and gauge 0228170 (Bleskop) as the control gauge. Gauge 0228170 was chosen as the control since it gave better results during trials of the estimation of missing values at gauge 0228495 than when gauge 0228495 was considered to fill in the missing values at gauge 0228170. The mean monthly rainfall information listed in Table 2 was obtained by multiplying the MAP (in mm) by the monthly rainfall as a percentage of MAP since this was drawn from the Water Research Report WRC 298/3.1/94. (The computer programme HDY08 output is a monthly time-series, expressed as a percentage of MAP, and is representative of the rainfall zone.)
Other rainfall stations were added to this preliminary study: the Touws River station (SAWS gauge no 0044050) and the Jan Deboers station (SAWS gauge no 0044286). The 0044050 and 0044286 rainfall stations are about 15 km apart and belong specifically to the J1C rainfall zone of the primary river drainage system (J) in the Western Cape. The geographical locations of the selected rainfall stations 0044050 and 0044286 is given in Table 3. Gauge 0044050 was taken as the target gauge and gauge 0044286 as the control gauge. This was done in a similar way as explained above. The mean monthly rainfall information (Table 4) was calculated directly from the data since data files were obtained from the SAWS. The annual rainfall totals for the Isidenge station (SAWS gauge no 0079490) and the Izeleni station (SAWS gauge no 0079730) were considered as well. The 0079490 and 0079730 rainfall stations are about 14 km apart and belong to the S6A rainfall zone of the primary river drainage system s (S) in the Eastern Cape. The geographical locations of the selected rainfall stations, 0079490 and 0079730 are listed in Table 5. The mean monthly rainfall information as listed in Table 6 was calculated directly from the data since data files were obtained from the SAWS. Gauge 0079490 was taken as the target gauge and gauge 0079730 as the control gauge as in the previous cases.


The hydrological year starts in October and ends in September for the data used.
The SAWS rainfall data used in this study were checked for general reliability and consistency using a mass plot, i.e. a plot of cumulative rainfall against time, as outlined by Midgley et al (1994).
The two techniques, i.e. standard BP and generalised BP, were applied to the different rainfall data sets. In the following, the results of the application of these techniques are presented and discussed.
RESULTS AND DISCUSSION OF THE APPLICATION OF THE STANDARD BP AND GENERALISED BP TECHNIQUES
The selected rainfall data sets (stations 00228170 and 00228295) of the Orange River Drainage System were complete and had no periods of missing data. However, for testing both infilling techniques, some consecutive gaps (e.g. 7, 13, 20, 25, 30, 35, 40 and 45% of missing data, starting from 1935) were created randomly in the target rainfall station data set (station 0228495).
The selected rainfall data sets in the Western Cape (stations 0044050 and 0044286) and in the Eastern Cape (stations 0079490 and 0079730) were complete and had no periods of missing data. However, for testing the different infilling techniques (i.e. the standard BP and the generalised BP), some consecutive gaps (e.g. 5, 10, 15, 20, 25, 30, 35, 40 and 45% of missing data, starting from 1965) were created randomly in the target rainfall station data set, i.e. 0044050. Similarly, some consecutive gaps (e.g. 5, 10, 15, 20, 25, 30, 35, 40 and 45% of missing data, starting from 1930) were created in the target rainfall station data set, i.e. 0079790.
The two techniques were then applied to annual total rainfall series. The ANNs were trained on the concurrent parts of the observed data using a sequential mode and the weights obtained were then used to estimate the missing values. The approach was similar to that used by Kuligowski and Barros (1998). A single input-output, three-layered ANN with three nodes in the hidden layer was used and the bias terms were assumed to be zero as their use is optional. Learning rates set to 0,15 and 0,45 yielded reasonable results, although a wide range of values (i.e. between 0,01 and 0,9) for the learning rate was tried. Input and output values were scaled linearly to fall within the range 0,1 to 0,9 as mentioned earlier. Tables 7, 8 and 9 contain a summary of the results obtained from the two techniques. It was found that a value of 5 for the generalisation parameter gave good results for the generalised BP technique at rainfall station 00228295, while a value of 3 for the generalisation parameter yielded good results for the same technique at rainfall stations 0044050 and 0079490.


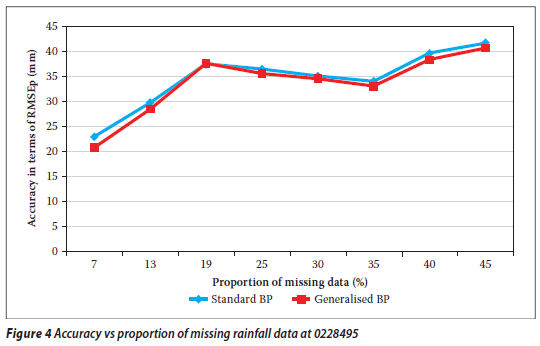
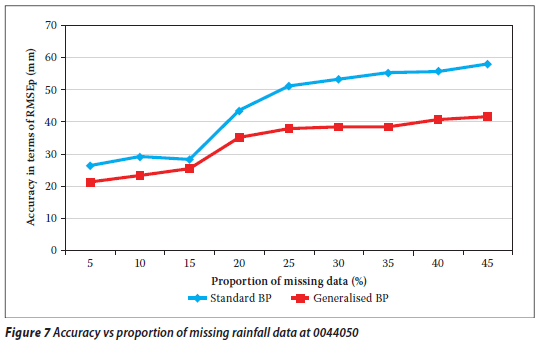
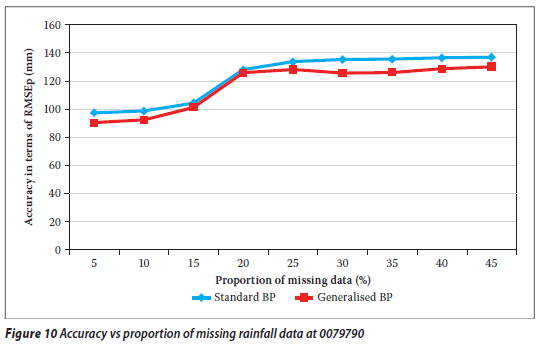
From Tables 7, 8 and 9 it is evident that the RMSEp at the target station increases with the proportion of missing values (gap size) for both techniques. Thus the accuracy decreases as the proportion of missing annual total rainfall values increases. A similar observation was made for a streamflow data infilling problem (Ilunga & Stephenson 2005). This situation (in this study) could be due to the fact that the generalisation capability of the two techniques of neural networks reduces as the proportion of missing values to be infilled becomes larger. In other words, as the periods of missing data increase, so the neural network is trained on smaller data sets and thus verified on a larger proportion of data. Hence the generalisation capability of ANNs decreases. It was noted that earlier missing record periods (e.g. 1928) in the records of the target station 0228495 did not have a significant impact on the accuracy of the estimated values for the different techniques.
A similar observation was made that earlier missing periods (1965) in the record of target rainfall station 0044050 did not apparently have any impact on the accuracy of the estimated values for the different techniques. Similarly, it was noted that earlier gaps (1925) in the record of target rainfall station 0079490 did apparently not have any impact on the accuracy of the estimated values for the different techniques.
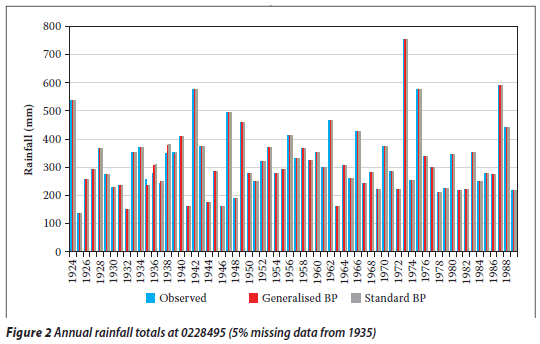
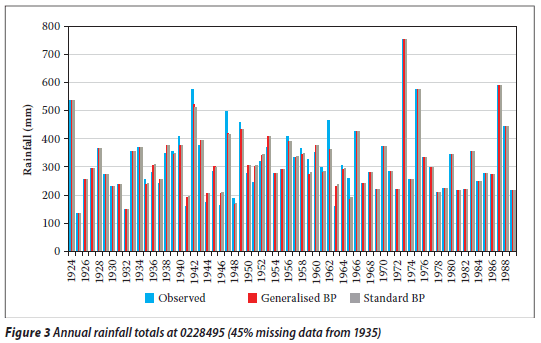
In Figures 2 to 10, StandardBP and Generalised BP refer to standard back-propagation and generalised back-propagation techniques.
By and large, generalised BP performed slightly better than standard BP. The plots shown in Figures 2 and 3, 5 and 6, and 8 and 9 confirm these results: the differences in the estimated missing values at rainfall station 0228495 are generally small, whereas the differences in the estimated missing values at rainfall stations 0044050 and 0079490 are more prominent. This could be due to the generalisation para meter introduced in the update Equations (4) and (5). In the cases under discussion, the generalised parameter is believed to slightly improve the approximation of the output signal without producing a large error signal in the neural network when the actual input for the given neuron and pattern approaches the limits, i.e. 0,1 and 0,9. This could therefore support the premise behind the generalised BP algorithm (Ng et al 1996) that a generalisation of the derivative of the activation function (i.e. logistic) enables improvement of the convergence of the learning process by limiting the error signal drop to a very small value. From Figures 4, 7 and 10 it can also be seen that for all algorithms the bigger the proportion of missing values (gap size), the bigger the RMSEp, hence the accuracy decreases. The two lines (obtained from the scatter data points) in Figure 4 are very close, while in Figures 7 and 10 the two lines are not very close. This could correlate with the observation that the differences in estimated values at station 0228495 were very small for both techniques. The two techniques were generally shown to give a good estimation of the annual total rainfall values.
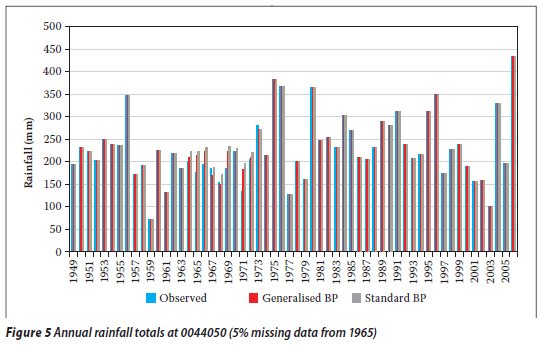
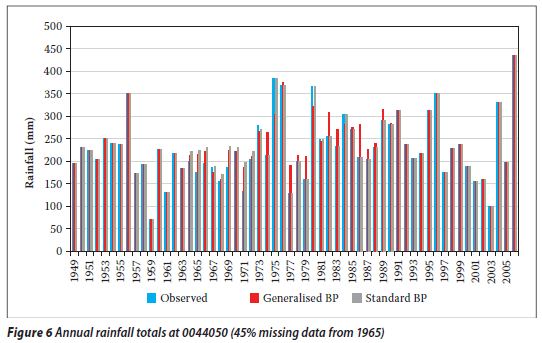
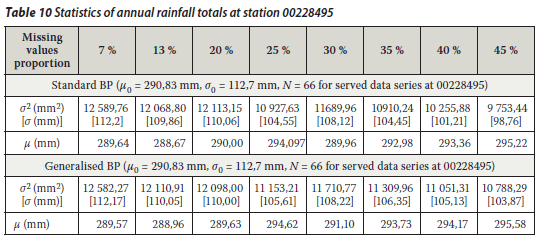
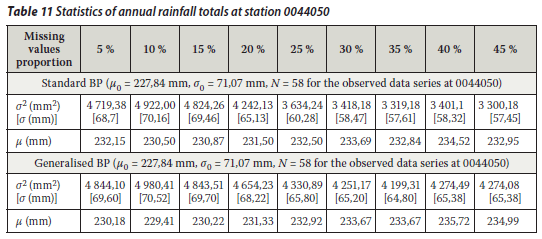
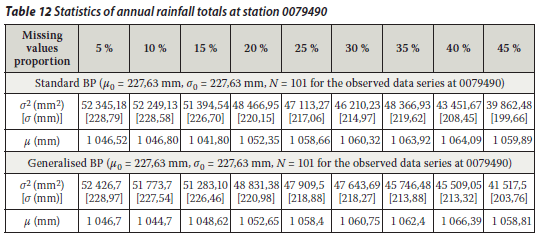
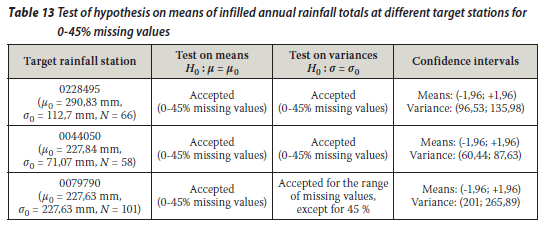
From the above it can be said that both the standard BP and the generalised BP algorithms are acceptable to fill in the annual rainfall values for rainfall stations 0228495, 0044050 and 0079790. It was shown that there was no significant breach of statistical properties (i.e. the mean and the variance of the incomplete and infilled rainfall series specifically at the target rainfall station). The hypothesis test was conducted on the basis of the statistical method explained above. The mean and variance of the observed annual rainfall totals at the target stations were considered (assumed) as an estimation of the population mean and variance respectively. The mean of the infilled data series for each proportion of missing values was tested (at 95% confidence interval) for acceptance or rejection of the mean of the annual rainfall totals remaining unchanged. The different tests revealed that the results could generally be accepted at 95% confidence interval, except for a 45% missing proportion at rainfall station 0079790 as shown in Tables 10, 11, 12 and 13.
For the generalised BP technique as applied in this paper, the generalisation parameter was purposely not strictly restricted to the conditions of binary problems, i.e. b  1 and b
  50 for good results. In the current case, the results became less accurate for b
  5. This could be due to the type of problem tackled here (i.e. data infilling) and the nature of the data (i.e. rainfall) used.
CONCLUSIONS AND SUGGESTIONS
The generalised BP technique has been introduced for the first time in hydrology, specifically for a rainfall data infilling problem. This technique was compared to the standard BP technique. The performance of the two techniques was evaluated through RMSEp for annual rainfall data. The preliminary results using the rainfall station pair 0228170 (control) and 0228495 (target) showed that the generalised BP technique performed slightly better than the standard BP technique. However, the standard BP had no negative impact on the estimation of missing values at the target station. Both techniques were acceptable for infilling the missing annual total rainfall data at station 0228495. Hence either of these techniques could be used for infilling annual rainfall totals. The results were similar when other station pairs were used: 0044050 (control) and 0044050 (target) and 0079030 (control) and 0079090 (target).
It was also observed that the RMSEp at the different target stations generally increased with an increase in the proportion of missing values (gap size) for both techniques. It is suggested that the impact of other activation functions (e.g. hyperbolic) as well as the batch-training mode for neural networks should be investigated. The techniques used in this study should also be tested on other rainfall data sets. A sensitivity analysis of the generalisation parameter on the accuracy of estimated rainfall values should also be investigated. These results were based on the techniques applied to annual total rainfall data. It is recommended that other rainfall data should also be tried (e.g. maximum series, mean annual, etc) and data from other climatic regions should also be used to evaluate the techniques.
ACKNOWLEDGEMENTS
The author thanks the South African Weather Service for providing the rainfall data used in this research paper.
REFERENCES
Agarwal, A & Singh, J K 2001. Pattern and batch learning ANN process in rainfall-runoff modeling. Indian Association of Hydrologists. Journal of Hydrology, 24(1): 1-14. [ Links ]
Agarwal, A, Singh, R D, Mishra, SK & Bhunya, PK 2005. ANN-based sediment yield models for Vamsadhara river basin (India). Water SA, 31(1): 95-100. [ Links ]
ASCE Task Committee (2000a) Artificial neural networks in hydrology I: Preliminary concepts. Journal of Hydrological Engineering, 5(2): 115-123. [ Links ]
ASCE Task Committee (2000b) Artificial neural networks in hydrology I: Hydrologic applications. Journal of Hydrological Engineering, 5(2): 124-137. [ Links ]
Balek, J 1972. An application of the inadequate hydrological data of the African tropical regions in engineering design. Proceedings, 2nd International Hydrological Symposium, Fort Collins, Colorado, USA, pp 95-96. [ Links ]
Cherkassky, V, Krasnopolsky, V, Slomatine, D P & Valdes, J 2006. Computational intelligence in earth sciences and environmental applications. Neural Networks, 19: 113-121. [ Links ]
Elshorbagy, A A, Panu, U S & Siminovic S P 2000. Group-based estimation of missing hydrological data: I. Approach and general methodology. Hydrological Sciences Journal, 45(6): 849-866. [ Links ]
Freeman, A J & Skapura, M D 1991. Neural Networks: Algorithms, Application and Programming Techniques. Redwood City, CA: Addison Wesley. [ Links ]
French, N, Krajewsky, F & Cuykendall, R 1992. Rainfall forecasting in space and time using neural network. Journal of Hydrology, 137: 1-31. [ Links ]
Ilunga, M & Stephenson, D 2005. Infilling streamflow data using feedforward back-propagation (BP) artificial neural networks: Application of the standard BP and pseudo MacLaurin power series BP techniques. Water SA, 2: 171-176. [ Links ]
Khalil, M, Panu, U S & Lennox, W C 2001. Group and neural networks based streamflow data infilling procedures. Journal of Hydrology, 241: 153-176. [ Links ]
Kuligowski, R J & Barros, A P 1998. Using artificial neural networks to estimate missing rainfall. Journal of the American Water Resources Association, 34: 1437-1447. [ Links ]
Lawrence, S, Tsoi, C A & Giles, L 1996. Local minima and generalization. IEEE Proceedings, International Conference on Neural Networks, 1: 371-376. [ Links ]
Makhuva, T, Pegram, G, Sparks, R & Zucchini, W 1997. Patching rainfall data using regression methods. 1. Best subset selection, EM and pseudo-EM methods: Theory. Journal of Hydrology, 198: 289-307. [ Links ]
Medeiros, Y D P, Fiuza, J M S, Figueira, C C & Sema, C S 2002. Information in Salitre River Basin-Bahia, Brazil. In: Sherif, M M, Singh, V & Al-Rashed, M (Eds), Groundwater Hydrology, Netherlands: Balkema, pp. 21-35. [ Links ]
Midgley, D C, Pitman, WV & Middleton, B J 1994a. Surface water resources of South Africa, 1990, lst edition. Water Research Commission Report No. 298/3.1/94. [ Links ]
Minns, A W & Hall, M J 1996. Artificial neural network as rainfall-runoff models, Hydrological Sciences Journal, 41(3): 399-417. [ Links ]
Ng, S C, Leung, S H & Luk, A 1996. A generalization backpropagation algorithm for faster convergence. IEEE Proceedings, International Conference on Neural Networks, 1: 409-413. [ Links ]
Panu, U S, Khalil M & Elshorbagy A 2000. Streamflow data infilling techniques based on concepts of groups and neural networks. In: Artificial Neural Networks in Hydrology, Netherlands: Kluwer Academic Publishers, pp 235-258. [ Links ]
Quilty, E, Hudson, P & Farahmand, T 2004. Artificial neural networks for validation and correction of higher frequency water quality data. Proceedings, 11th CWWA National Conference, Calgary, Canada, pp 1-14. [ Links ]
Raman, H & Sunilkumar, N 1995. Multivariate modelling of water resources time-series using artificial neural networks. Hydrological Sciences Journal, 40(2): 145-163. [ Links ]
Sadowsky, G 1989. Statistical data processing in developing countries. Applications of emerging Technology. CEUS: Emerging Technology, pp 1-26. [ Links ]
Spiegel, M R 1972. Schaum's Outline of Theory and Problems of Statistics in SI Units. Schaum's Outline Series, New York: McGraw-Hill. [ Links ]
Wilby, R & Dawson, C W 1998. An artificial neural network approach to rainfall-runoff modeling. Hydrological Sciences Journal, 43(1): 47-66. [ Links ]
 | DR MASENGO ILUNGA is a senior lecturer and the current Head of Department of the Civil and Chemical Engineering Department at UNISA. He is also the leader of the UNISA Water Research Group and teaches subjects related to water engineering. His current research interests are artificial intelligence, entropy, statistical techniques and modelling in hydrology and water resources. |
 Contact details:
College of Science, Engineering and Technology
Civil and Chemical Engineering
University of South Africa
T: 011 471 2791
F: 011 471 2090
E: ilungm@unisa.ac.za


