


Services on Demand
Article
 English (pdf)
 Article in xml format
 Article references
Indicators

Related links
-
 Cited by Google
 -
 Similars in Google
Share

 Permalink
Journal of the South African Institution of Civil Engineering
On-line version ISSN 2309-8775
Print version ISSN 1021-2019
J. S. Afr. Inst. Civ. Eng. vol.51 n.2 Midrand Oct. 2009
TECHNICAL PAPER
Desiccation of soil by vegetation and potential interaction with buildings - a field study
GE Blight
ABSTRACT
Desiccation of clay soil caused by vegetation - grass, bushes and trees - and its effects on the stability of slopes, buildings, roads and other structures has long been a topic of interest and concern to the geotechnical engineer. Several international symposia on the topic have been held during the past 60 years, and the literature on the subject is voluminous. A review of past studies of soil desiccation and its effects showed that, with few exceptions, investigations had been of a short-term nature and had not adequately considered the variable annual effects of atmospheric and hydrological causes of soil desiccation and rehydration. As a contribution to providing this longer-term information, it was decided to embark on an extended study of the effects of evapotranspiration by vegetation and atmospheric climate on the seasonal and year-to-year variation of soil water content.
The study is now complete and this paper presents an overview of the investigation from 2000 to 2006, including the influence of annual weather variations on the desiccating effects of lines of trees and bushes, the potential effects of desiccation caused by single trees on adjacent buildings, and the portrayal of these effects by means of soil water content and storage profiles, and soil water balances.
Keywords: desiccation, evapotranspiration, soil water balance, soil water content, vegetation
INTRODUCTION AND REVIEW OF PAST RESEARCH
It has long been recognised that desiccation from the surface of a clay soil can cause consolidation, resulting in shrinkage and settlement, while rewetting of a desiccated soil can result in swelling and heave of the soil surface (e.g. Terzaghi 1943). It has also been recognised for many years that the processes of desiccation by the roots of vegetation and subsequent swelling can cause damage to shallow foundations and road pavements on clay (e.g. Croney & Lewis 1948; Ward 1948).
In the UK, the Building Research Station (1949) and the Building Research Establishment (1985) recommended minimum building-to-tree distances for various tree species and tree ages relative to the time of construction of the building. They also emphasised the role played by foundation design and gave guidance on the effects of pruning or removing trees, including expected re-swelling of the soil, the effects of root barriers, etc. Work on the effects of desiccation by vegetation had shown that grass and bushes can cause desiccation of soils comparable with that caused by large trees. Coleman (1965) had measured considerable seasonal fluctuations of water content at a depth of 1 m under heathland and grassland in the UK. Russam & Dagg (1965) had studied the effects of various surface treatments for road verges on soil moisture under road pavements in Kenya. They found that a local grass could desiccate the soil under verges to depths of 3 m or more. A similar effect was found with vigorously growing two to four-year-old eucalyptus saplings. De Bruijn (1965) found that desiccation in open fields under indigenous grasses in South Africa can extend to a depth of 6 m. This was comparable to the depth of desiccation under mature trees. Williams (1980) measured near-surface suctions of about 3,5 MPa under open grassland which declined to 1,5 MPa at a depth of 13 m.
More recently Parry (1992) investigated water content profiles at three sites on London clay. At one site, an open grassed field, he found evidence of desiccation down to a depth of 4 m. Supporting evidence was provided by Crilly et al (1992). Investigating a site on London clay, they recorded seasonal surface movements relative to a datum at a depth of 4 m of up to 50 mm under grass cover, as compared with 90 mm adjacent to trees. Smethurst et al (2006) measured suctions approaching 70 kPa at a depth of 1 m and up to 20 kPa at 2,5 m below a grass-covered slope cut in London clay.
Biddle (1983, 2001) undertook what is probably the most comprehensive investigation of the desiccating effects of trees recorded in the geotechnical literature. His measurements from mid-1979 to mid-1994 examined single trees growing on clay. All of the trees were surrounded by grass, and tree heights at the start of the study varied from 8 m (birch) to 20 m (poplar). Measurements were made by a neutron probe inserted into five tubes set along a single radius at distances from the bole of 0,1 to 2 times the tree height. Measurements were made at depths from 0,3 to 3 m, although in some cases the depth extended only to 1 m. Biddle (1983) interpreted his results as showing that poplar trees have the deepest and most widespread effect on soil moisture in the surrounding soil. Seasonal effects could be detected to a depth of 3 m, while radially, the most pronounced effects extended to a radius equal to the height of the tree. It is likely, however, that much of the desiccation he observed arose from the surrounding grass and not only from the tree roots. Later measurements (Biddle 2001) largely confirmed the earlier ones.
Most of these past studies have been of the effects of single trees, or rows of trees. Very few have considered the effects of tree-covered areas, either natural forests or tree plantations. Wolpert (1952) reported that, after a eucalyptus plantation had been felled in South Africa, the water table rose by at least 13 m in the subsequent 15 years. Blight & Lyell (1984) (also in South Africa) found that the water table beneath two eucalyptus plantations was depressed by up to 20 m relative to that beneath adjacent land farmed with annual wheat and maize crops.
There is also very little in the geotechnical literature, but much more in the literature on forest hydrology, concerning the rooting depth and spread of roots, for either single trees or bushes or for tree-covered areas. Dobson & Moffat (1995) showed that the root systems of mature trees are usually confined to 1-2 m from the surface, with the greatest concentration of roots within the first 0,5 m. The lateral spreads, however, may exceed a radius of 10 m. Under forests, the depth of root penetration remains much the same. Guangyi (2004), for example, reported that beneath both tropical natural forest, as well as fir plantations in more temperate climates, 95% of the mass of roots per unit volume of soil is contained in the upper 600 mm of soil, with 63% being concentrated in the top 200 mm.
Apart from the pioneering work of Russam & Coleman (1961) on the correlation of atmospheric climate with subgrade water contents under roads, Biddle's work appears to be one of the few sets of research measurements of desiccation caused by vegetation that was carefully preplanned and carried out over a period of several years. Most of the other research was either a onceoff, or a short-term investigation with little or no follow-up. Typically, measurements were made to investigate the causes of the cracking of a building or the distortion of a road surface, and these measurements were seldom, if ever, repeated (e.g. De Bruijn 1965; Parry 1992; Cameron 2000). Occasionally, a series of measurements was made at closely spaced locations (e.g. under the centre-line and at the edge of a road pavement) and at various times of the year, but with no way of evaluating causes of the effects of the inevitable seasonal differences (e.g. Richards et al 1983). Even Biddle's measurements contain no climatic information and no information on local soil properties. Neither is there any information or separate assessment of water usage by the trees.
After past research had been reviewed, it was decided to embark on a sustained programme in which the changes in soil water content would be studied in the vicinity of deciduous and evergreen trees and bushes, and the desiccating effects of grass cover would also be assessed. Attention would be given to the distance from the bole of a tree or bush to which the desiccating effects reach. Seasonal effects would be investigated by measuring soil water contents at least every second month, and rainfall measurements would be combined with evaporation, evapotranspiration and soil water data so that all the measurements could be linked by a soil water balance. It was also planned to investigate the effects of a single tree versus those of lines of trees.
The research started in 2000, the first steps being to explore the site and characterise the soils by means of basic index, oedometer and in situ permeability tests. Measurements of evapotranspiration at various times of the year were started, using the solar energy balance method and the collection of rainfall data was also started.
Initially, it was intended to study variations of soil water content and suction by means of gypsum blocks buried in the soil at various depths. (e.g. Aitchison & Richards 1965). However, although the results looked promising (see Blight 2002a) the calibrations of the gypsum blocks proved to be so variable from block to block and with time, that it became almost impossible to interpret the readings reliably. It was therefore decided to study changes of water content and the effect of vegetation on these by sampling for water content only and relating these measurements to the soil water balance.
SITE OF THE STUDY
The experimental site is at Clarens, situated in the Free State province at latitude 280311 south and longitude 280261 east at an elevation of 2 000 m above sea level. Clarens is ringed by sandstone and mudstone cliffs of the Clarens formation, which in turn are capped by strata of basaltic Stormberg lavas. The test site is situated on a gently sloping plain of colluvium consisting of silty clay deriving from the weathering of the sandstones and lavas. The colluvium is underlain by horizontally bedded sandstone at depths varying from 0,5 to 1,5 m. The soil is moderately expansive/shrinking, and contains closely spaced slickensides with extensive microfissuring between slickensides. The sand, silt and clay contents are almost constant with depth, and vary as follows: sand: 20-25%, silt: 47-53%, and clay: 22-33%. The clay size fraction consists of muscovite, kaolin and quartz. Index data are as follows: liquid limit: 46%, plasticity index: 18%, linear shrinkage: 9%. The soil properties are almost constant with depth and the transition from colluvium to partly weathered sandstone occurs suddenly over a depth of 50 to 100 mm (e.g. between 500 and 550 mm). The water table lies within the sandstone at 5-7 m below the surface. The site has warm, moist summers (daily temperatures between +10 and +25 ºC) and cool dry winters (-10 to +15 ºC). At the experimental site there is a line of exotic deciduous poplar (Populus nigra) trees (18 m high in 2000 and 5 m apart, but grown to 26 m high in 2008) which continues as a line of evergreen indigenous ouhout (Leucosidea sericea) bushes (2 m high in 2000 and 3 m apart, and grown to 8 m high in 2008). The surrounding soil surface is covered by Eragrotis curvula grass growing as a pasture which is mown once a year, at the end of summer. The poplar trees shed their leaves in May and come out in leaf in September.
The choice of site may be criticised because of the limited depth of soil. However, the opinion of other researchers (e.g. Dobson & Moffat 1995; Guangyi 2004) is that root activity is confined mainly to the upper 0,5 m of soil. At Clarens the main root zone extends from the surface to a depth of 300 mm with very few roots below this. Even though the roots may not be able to penetrate the partly weathered sandstone, the soil water balance shows that the desiccating effects of the root system extend from the soil, by soil water suction, into the underlying sandstone.
SOIL WATER BALANCE
To understand the interaction between local climate and the soil water system, it is necessary to evaluate the annual soil water balance:
The various terms in eq 1 represent differences between the initial and final values occurring over a chosen time period.

where R is the rainfall, RO is the runoff and therefore R - RO is the infiltration at the soil surface, S is the water stored in the soil, E is the evapotranspiration at the soil surface and RE is the recharge to the water table. "Losses" represent inaccuracies in the measurements or the effects of lack of definition of boundary conditions or variability in the soil system. For a complete evaluation of eq (1), data must be available for each of the terms in the equation. Measurements at Clarens are available for all of the terms on the left-hand side of the equation. The rainfall (R) was measured by means of a rain gauge set well away from any trees and buildings, and recorded as 24-h events at 08:00 on each day, following rain.
IN SITU PERMEABILITY, INFILTRATION AND RUNOFF (RO)
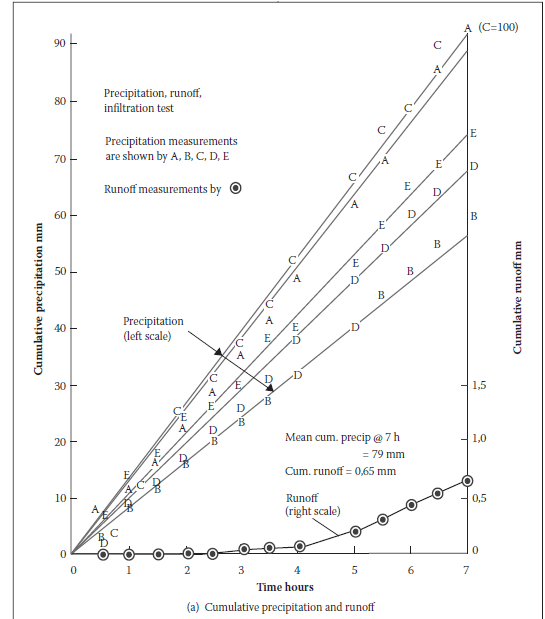
In situ permeability measurements using the Guelph apparatus (Reynolds & Elrick 1985), showed that the soil is surprisingly permeable considering its particle size distribution and clay content. The permeability at a depth of 40 mm was measured as 150 mm/h, decreasing to 30-35 mm/h at depths of 300-500 mm. Infiltration measured by means of an infiltrometer ring, 1 m in diameter, averaged 600 mm/h. Figure 1 shows the measured variation of saturated permeability with depth. The relatively high permeability (caused by the extensive microfissuring of the soil, most intense at the surface and reducing with depth), combined with the nearly level soil surface, meant that runoff of incident rainfall was unlikely to amount to more than a very small proportion of the rainfall. However, it was also decided to undertake a larger-scale infiltration/runoff test. The infiltration/runoff test area measured 3 160 mm square, giving an infiltration area of 10 m2. The test area was set out so that the maximum fall in the surface was across a diagonal. Runoff from the test area was guided to the collection point, at the lowest corner, along V-shaped runoff trenches, 150 mm deep. Run-on from the surrounding area was prevented by low soil bunds and V-shaped cut-off trenches, 150 mm high and 150 mm deep, respectively. The runoff was collected in a plastic bucket set in a pit at the confluence of the runoff trenches and measured hourly by weighing. Five rain gauges were used to measure the precipitation. These were mounted at a height of 1 m, one at each of the quarter points of the diagonals and one at their intersection. The precipitation was applied by means of an oscillating garden sprinkler that applied the water at a rate of about 11 mm/h over an area measuring 6 x 5 m, so that the wave of sprinkled water moved over the test area at a reasonably uniform speed.
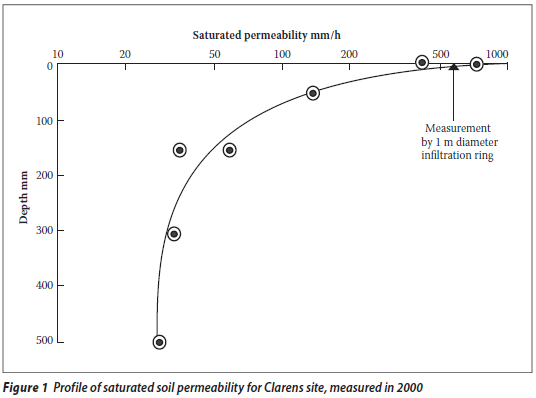
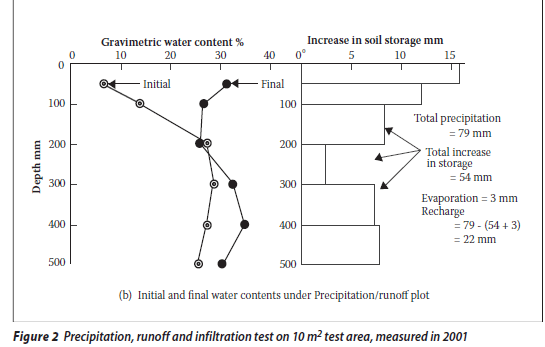
Figure 2a shows the cumulative precipitation collected by the five rain gauges, of which A and B were on the steeper diagonal, C and D on the near-level diagonal and E at the intersection of the diagonals. Each rain gauge collected water at a different rate, but gauge E collected close to the mean of 79 mm in 7 h. Very little runoff occurred and after 7 h it totalled only 0,65 mm. Two control holes were augered within the test area and sampled for water content, one immediately before the test was started, the other one hour after the precipitation had ceased. The water content profiles are given in Figure 2b and show an increase in soil water storage of 68% of precipitation. Evaporation from the surface during the test was assessed, by means of an evaporation pan, to be 3 mm (4% of precipitation), leaving 22 mm (28%) as recharge to the water table.
An analysis of the rainfall records for Clarens showed that even a 24-h rainfall of over 70 mm is a low-probability event. On the basis of the study of permeability and infiltration measurements, it was concluded that very little error in the measured water balance would occur if runoff were ignored.
MEASUREMENT OF IN SITU WATER CONTENT AND SOIL WATER STORAGE (S)
After difficulties had been experienced with using gypsum blocks to measure in situ water contents, it was decided to measure the water contents in situ, as directly as possible. The study was started by handaugering holes and removing samples from various depths to determine the in situ water contents. The measurements extended in depth from 50 to 500 mm. It was sometimes possible to sample down to about 700 mm, but below 500 mm, the soil became mixed with lumps of weathered sandstone and the water content decreased irregularly because the coarser sandstone retains less water than the surrounding soil.
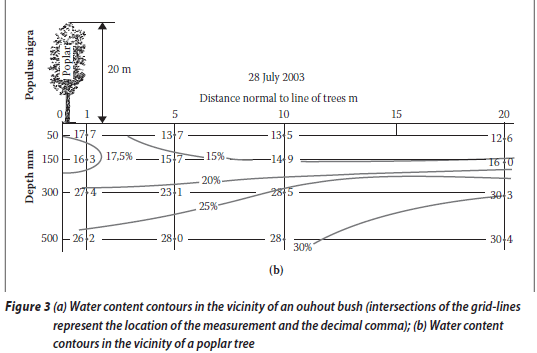
Some early measurements of water content distributions, laterally and with depth, in the soil near to the lines of bushes and trees are shown in Figures 3a and 3b. An interesting aspect of both of these diagrams is that major water depletion had been expected to occur close to both bushes and trees. There did seem to be a slight depletion, but it was not as pronounced as expected. One of the mistakes made in these early samplings, for the trees, was to space the holes too widely. In later work the distance between 0 to 9 m was sampled by five holes, instead of the three between 0 and 10 m, shown in Figure 3b.
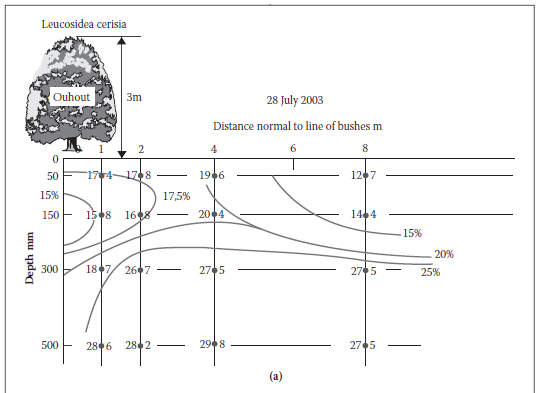
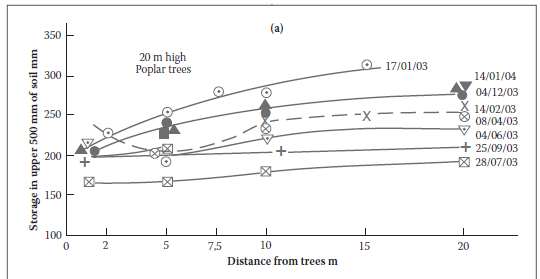
Figures 4a and 4b show a comparison of the water stored (S) in the 500 mm depth of soil that was sampled. S =  ρdΔz, where is the gravimetric water content (dry solids based) averaged over a depth range of Δz, and ρd is the dry density of the soil. S has units of kg/m2, equivalent to mm of water. The distributions given in Figure 4 show the variation of S with season, and also show that the distance from the trees that appears to be affected by their presence was somewhere between 5 and 10 m, while that affected by the bushes was about 3 m. The distance of influence of the trees was better defined in later work, but did not seem to change by much as the trees grew. The extent of growth of the bushes was much more than that of the trees (from 2 to 8 m in eight years for the bushes and from 20 to 26 m for the trees), which must have affected their respective distances of influence. The evergreen bushes also show an interesting "shading" effect which in some cases resulted in a concentration of water within 4 m of their stems.
The method of sampling being used was obviously not sustainable because each sampling hole had to be drilled in a new location. The neutron probe and time domain reflectometry (TDR) devices are difficult to calibrate for use in fissured soils (Li et al 2003a and b). However, a suitable non-destructive sampling method needed to be found and eventually a Sentek "Diviner" instrument, which senses water content by measuring the electrical capacitance of the soil, was acquired. It was also found to be very difficult to calibrate for the fissured soil at Clarens because the calibration varied as the fissures opened and closed seasonally (Blight 2007). The Diviner was abandoned after two years' use and the original method of direct measurement of water contents was re-adopted. Fortunately, all of the Diviner measurements had been backed up by parallel gravimetric measurements to maintain a running check on the calibration of the Diviner.
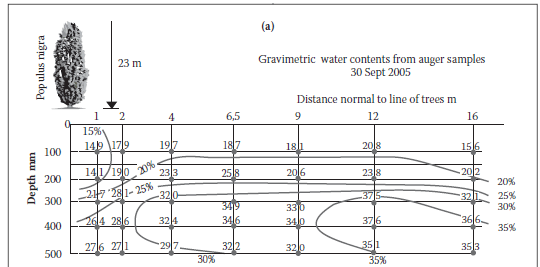
Nevertheless, it was considered important to show that the water content contours established by carefully calibrated Diviner measurements were equivalent to those established earlier by direct sampling. A qualitative equivalency can be shown by comparing the soil water content contours constructed from two sets of measurements made on the same day, one by direct sampling and the other via the Diviner, and the continually updated calibration for the instrument. This was done for each of the sampling lines at Clarens. Figures 5a and 5b show one of these comparisons, for the line of poplar trees. The figure also illustrates typical water content contours adjacent to the trees when the sample hole spacing had been reduced. Although the individual values of water content are not identical when determined by the two methods, and the positions of various contours also differ, the two contour diagrams are sufficiently similar to show equivalency of water content measured by direct sampling and calibrated Diviner.
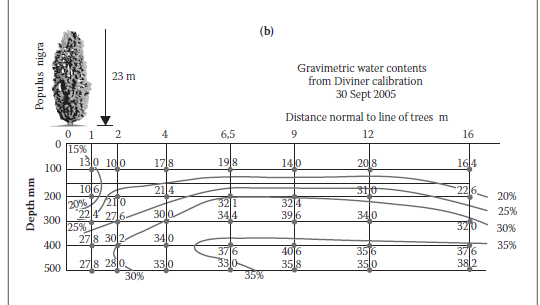
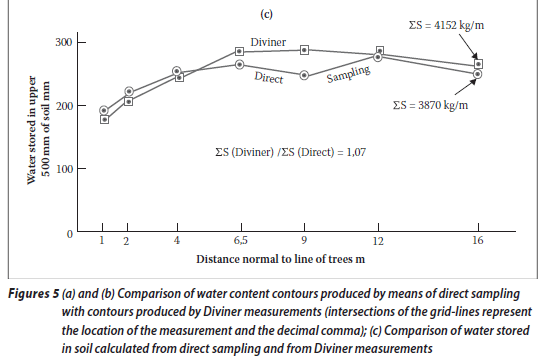
The visual impression of similarity is supported by Figure 5c which shows a comparison of the water stored (S) as measured by the two methods. If S was integrated along the 16 m length of the sampling profile (to give ΣS), the discrepancy between the estimates by the two methods was 7%, which is acceptably accurate. Hence the problem lay with the fissuring of the soil and not with the principle of operation of the Diviner.
ASSESSING EVAPOTRANSPIRATION
The daily quantity of evapotranspiration from a grassed surface can be assessed by measuring the components of the surface energy balance equation (e.g. Calder 1990; Schmugge & Andre 1991; Blight 2002b):

where LE is the latent heat of evaporation, ΣRn is the cumulative net incoming solar energy (incoming minus reflected energy), WE is the wind energy, G is the energy absorbed in heating the near-surface soil (the soil heat), H is the energy consumed in heating the near-surface air (the sensible heat) and P is the energy used in plant photosynthesis (usually less than 2% of Rn and therefore negligible).
In maritime climates WE and H are important, but inland, both WE and H are negligible (Blight 2002b) and equation (2) effectively becomes:

Figure 6 shows typical measurements of the variation of Rn, the net solar power in W/m2, the integration with time of Rn, the solar nenergy ΣRn in kJ/m2 and (ΣR - G) also in kJ/m2.
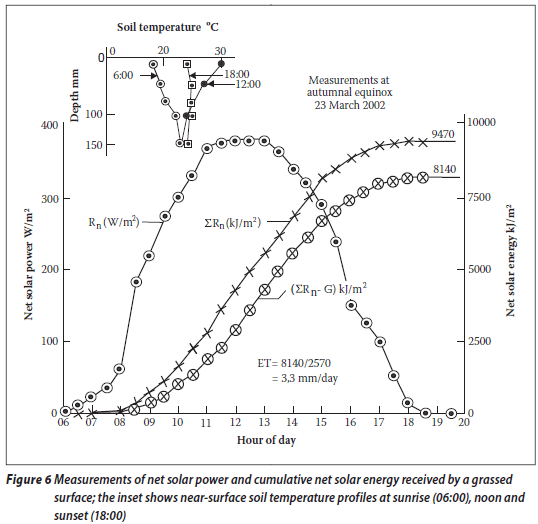
LE can be used to calculate the quantity of daily evapotranspiration by dividing the daily total LE by the latent heat for vaporisation for water, λ in kJ/kg, i.e. evapotranspiration = LE/λ in kg/m2, or mm of water. For water, λ has a mean value of 2 450 kJ/kg (2 477 kJ/kg at 10 ºC to 2 417 kJ/kg at 35 ºC).
Lysimeters, especially microlysimeters (e.g. Boast & Robertson 1982), can also be used for estimating evapotranspiration from a grassed surface. A cylindrical core, including the grassed surface, is removed from the soil, weighed and replaced. The weighing is repeated daily to assess the rate of evapotranspiration from the soil. The method has been checked by Blight & Blight (1999) and found to agree well with the surface energy balance technique. However, the energy balance method has the advantage of being readily extended to trees, bushes and grass and was chosen for this reason.
EXAMPLES OF THE SOIL WATER BALANCE FOR THE CLARENS SITE
Although, by means of eq (1) and a set of measurements for a year, the water balance for a site can be defined, the equation can seldom be closed perfectly because of the unknown losses and difficulties in accurately defining the recharge RE and the evapotranspiration E.
As the main input to the balance is rainfall, and this can vary widely from year to year, it is seldom possible to compare the water balance for one year with that of another. Thus it is seldom possible to confirm the accuracy of a water balance by direct comparison of years with similar rainfall.
It was noticed that the total rainfalls for the periods from 1 November 2004 to 31 October 2005, and from 1 November 2005 to 31 October 2006 were very similar, thus providing an opportunity for comparing the water balances for two different years.
Figure 7 shows the cumulative rainfall for the two periods: 1 November 2004 to 31 October 2005 (878 mm) and 1 November 2005 to 31 October 2006 (855 mm, 97% of the previous year). Because antecedent rainfall may have some effect on the following year, an overlap from 1 May to 31 October is shown in both cases. The cumulative rainfall for the antecedent year, 1 November 2003 to 31 October 2004, was 658 mm, so the two-year period of study was preceded by a drier year in which the rainfall was 76% of that in the two subsequent years, with year 1 being slightly wetter than year 2.
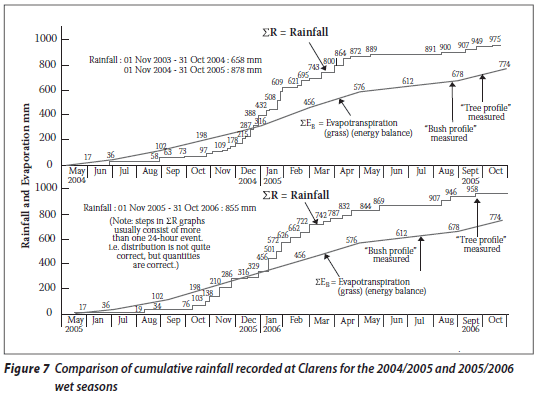
In both cases, the line representing ΣEB is a composite line, established by energy balance measurements over a period of several years. (The subscript B in EB denotes "established by energy balance".) The line applies specifically to the grass-covered surface, unaffected by the presence of trees or bushes. In each case, the point at which the ΣR line crosses the ΣEB line represents the time at which the cumulative rainfall exceeds the evapotranspiration and the soil water goes from deficit to surplus. In the two periods studied, this occurred in late December.
Figure 8a shows analyses of the annual rainfall by 24-h events and Figure 8b by quantity of rainfall in each 24-h event. The analysis by 24-h events shows that the rainfall event distribution was very similar for the two years, with small rainfall events (<20 mm) being slightly less frequent in 2004/2005 than in 2005/2006 and bigger events (>20 mm) slightly more frequent. The analysis by quantity is a combination of the records for the two one-year periods and shows that 74% of the annual rainfall quantity fell almost evenly distributed in 24-h events of between 5 and 40 mm, with only 15% of annual rain falling in 24-h events of more than 40 mm.
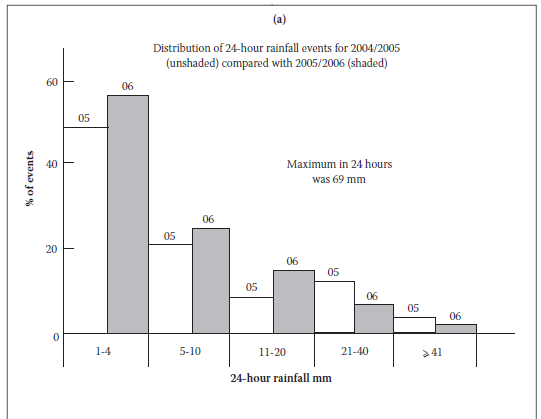

Figure 9 compares two water content profiles at right angles to the line of ouhout bushes, measured in late August of 2005 and mid-July 2006. (These are referred to as "bush profiles" in Figure 7. The profile for late August 2005 was wetter close to the bushes than that for mid-July 2006. However, in August 2005, the cumulative rainfall had been 900 mm, whereas in July 2006 it was 869 mm and this probably accounts for the difference. The corresponding tree profiles were sampled at closer dates (30 September 2005, see Figure 5a, and 27 September 2006); the rainfalls were closer (949 and 946 mm) and the water content profiles were also very similar.
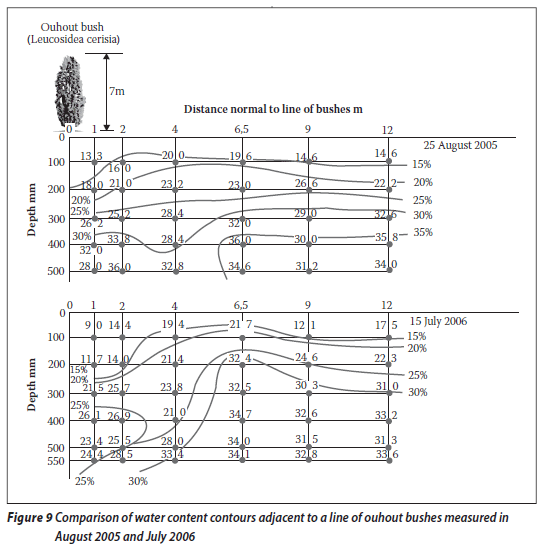
Figure 10a shows the water stored in the upper 500 mm of soil (S), corresponding to the water content profiles for the trees, and Fig 10b for the line of bushes. For the trees, the 2005 storage quantities everywhere exceed those for 2006 but, as mentioned above, the 2005 rainfall was slightly higher than in 2006. The two profiles are much closer in the drier region adjacent to the trees. For the bushes, the stored water profiles are very much closer, and almost coincide at distances of more than 5 m from the bushes. If the storage, in each case, is integrated along the length of the sampling line, the resulting average storage in September 2005 and 2006 for the tree profile sampling lines was 152 mm within the zone of influence for the trees, and 178 mm for the grassed area outside of the zone of influence. This can be interpreted to mean that the trees had used 26 mm more water than the grass. For the bushes, the average storage within the zone of influence was 151 mm and outside of the zone of influence the average storage was 181 mm. Hence the water usage by the trees and the bushes was very similar, with the bushes having used slightly more water (30 mm) by an earlier time of the year (July to August). The poplars are deciduous and the ouhouts are evergreen. Thus the poplars use their water while they are in leaf, which is the same period (September to May) in which the grass is growing and actively using water. Being evergreen, the ouhouts use water all year.
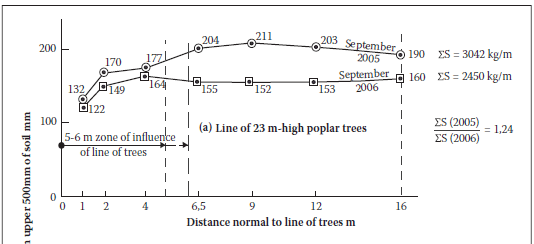
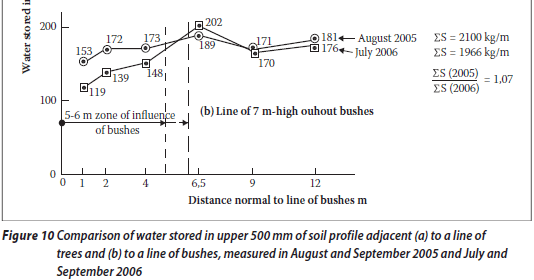
The differences in the cumulative recharge to the ground water (ΣRE) in the two years can be calculated by means of eq (1), if the losses are ignored. The recharge difference is the algebraic sum of the components in eq (1) where each component is the difference between the value at the time of the 2005 sampling and that at the 2006 sampling. The results showed that the differences in calculated recharge were -125 mm for the bushes, -18 mm for the trees and -70 mm for the grassed areas (the minus sign denoting a withdrawal of water from below 500 mm). Considering that the annual rainfall for the two years was about 950 mm, the calculations show that the differences in recharge were small, and therefore the water balances were similar.
The half-width of the zone of influence for the lines of trees and bushes in 2005/2006 was practically the same, at 5-6 m. Measurements made in 2003, when the bushes were 3 m high and the trees 20 m high, showed much the same width of zone of influence for the trees, but a slightly lesser zone of influence for the bushes. Hence, contrary to the view of British investigators (Building Research Establishment 1985), the zone of influence of a tree or bush does not appear to be closely related to its height.
It is also interesting that a relatively small indigenous ouhout bush uses much the same amount of water as a very large deciduous exotic poplar tree. This is completely at variance with the official claim that exotic trees use far more water than indigenous trees.
SOIL DESICCATION IN THE VICINITY OF A SINGLE TREE
One of the objectives of the Clarens investigation was to establish the distance to which a line of trees, or a single tree, is likely to affect the water content of the soil, and therefore potentially affect adjacent structures built on shallow foundations. It was seen from Figure 10 that in the case of a row of bushes or trees, the distance is 5-6 m, regardless of the fact that the poplar trees are more than twice the height of the ouhout bushes, but with a similar lateral spread of their canopies.
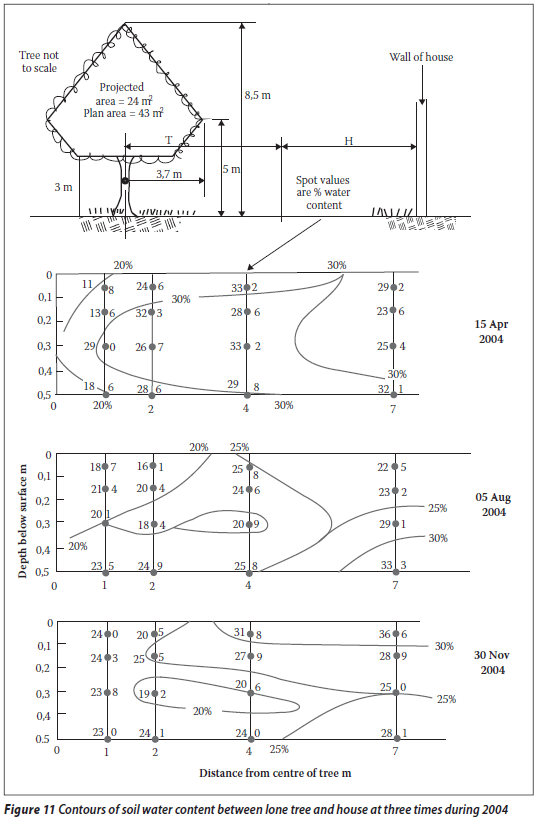
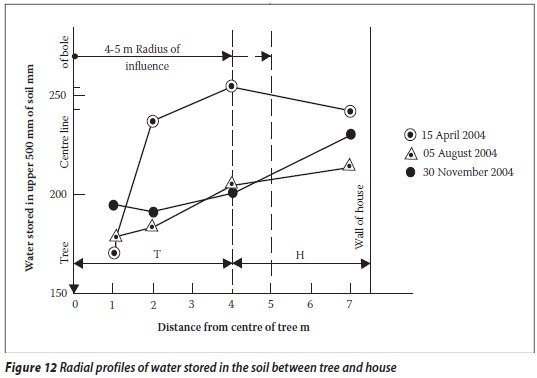
Figure 11 shows the position of the single tree, a corkscrew willow, relative to a house on the site, and gives the dimensions of the tree's leaf canopy in 2004. Below the location diagram, three typical soil water content profiles are shown for 15 April 2004, 5 August 2004 and 30 November 2004. The corresponding vertical sections showing the water stored in the upper 500 mm of the soil profile appear in Figure 12. The water content contours in Figure 11 are difficult to interpret unambiguously, but clearly show the persistent desiccation of the soil around the tree, even in April, the end of the wet season. The radius to which the tree exerts an influence on the soil water is shown most clearly in Figure 12. This shows that the main influence of the tree's root system extends to a radius of 4-5 m from the tree, whereas the tree's leaf canopy had a radius of 3,7 m. Tree roots may have had some influence beyond a 4-5 m radius, but considering the variation through the year of the water stored in the soil close to the house , the influence must have been minor beyond 5 m. (The ground surface was not irrigated at all during the experiment.) Applying the water balance equation to Figure 12, assuming that the radial storage profiles are uniform round the tree, and considering the time period 15 April to 30 November 2004, the calculated recharge in the area of influence would be -34 mm, and the water usage of the tree together with the grass growing around it would be 320 mm in a period when the increment in rainfall was 286 mm.
SUMMARY AND CONCLUSIONS
1. Over the past 60 years, studies of the desiccation of clay soils by vegetation, and its effects on slopes, buildings, roads and other structures have been mostly of a short-term nature. Very few studies extending over periods of a year or more have been undertaken. Apart from Russam & Coleman's (1961), Coleman's (1965) and Biddle's (1983 to 2001) studies and the recent study by Smethurst et al (2006), published investigations have been of a remedial nature, proposing and implementing solutions to existing problems, seldom with any retrospective check on their efficacy.
2. The present study has used the concept of the soil water balance to link atmospheric and hydrological factors to seasonal and annual variations of soil moisture. After early attempts to use gypsum blocks to measure both soil water content and suction had been abandoned, direct sampling was used to measure water content. Measuring soil water content in situ was found to be particularly difficult as the fissured nature of the soil at the test site causes inaccuracies in non-invasive methods of measuring soil water content, while variabilities in the soil even raise doubts as to the accuracy of the basic technique of direct sampling.
3. By comparing the soil water balances for two years in which the rainfall was very similar, it has been shown that soil water balances are satisfactorily repeatable for years having similar weather conditions.
4. The zones of influence of trees and bushes at Clarens are smaller than those found in assessments by, for example, Biddle (2001) and the UK Building Research Establishment (1985). This is possibly because they did not differentiate between the desiccating effect of the tree and that of the grass soil-cover surrounding the tree. It appears from the measurements that a relatively small indigenous evergreen bush or tree may use as much water each year as a much larger exotic deciduous tree. It also seems that the zone of influence of a tree or bush is not closely related to its height, but is more likely to depend on the availability in the soil of the water necessary for growth.
REFERENCES
Aitchison, G D & Richards, B G 1965. A broad-scale study of moisture conditions in pavement subgrades throughout Australia. In: Aitchison, G D (Ed) Moisture equilibria and moisture changes in soils beneath covered areas, Sydney, Australia: Butterworth, pp 191-204. [ Links ]
Biddle, P G 1983. Patterns of drying and moisture deficit in the vicinity of trees on clay soils. Geotechnique 33(2): 107-126. [ Links ]
Biddle, P G 2001. Tree root damage to buildings. In: Vipulanandan, C, Addison, M B & Hassen M (Eds) Expansive clay soils and vegetative influence on shallow foundations, Geotechnical Special Publication No 115, Virginia, USA: American Society of Civil Engineers, pp 1-23. [ Links ]
Blight, G E & Blight, J J 1999. The microlysimeter technique for measuring evaporation losses from a soil surface. Proceedings, 12th Regional Conference for Africa on Soil Mechanics and Geotechnical Engineering, Durban, South Africa, pp 23-27. [ Links ]
Blight, G E & Lyell, K A 1984. Water table depression under treed areas and swell subsequent to felling. Proceedings, 5th International Conference on Expansive Soils, Adelaide, Australia: 1, pp 348-352. [ Links ]
Blight, G E 2002a. Seasonal changes in the soil-moisture regime at shallow depths in an expansive soil in a semi-arid environment. Proceedings, 3rd International Conference on Unsaturated Soils, Recife, Brazil, 2 pp 865-869. [ Links ]
Blight, G E 2002b. Measuring evaporation from soil surfaces for environmental and geotechnical purposes. Water SA, 28(4): 381-394. [ Links ]
Blight, G E 2007. Experience with calibrating an instrument for ascertaining the in situ water content of soil by measuring the soil electrical capacitance. Proceedings, 3rd Asian Conference on Unsaturated Soils, Beijing, China: Science Press, pp 451-456. [ Links ]
Boast, C W, & Robertson, T M 1982. A microlysimeter method for determining evaporation from bare soil: description and laboratory evaluation. Soil Science Society of America, 46: 689-96. [ Links ]
Building Research Establishment 1985. The influence of trees on house foundations in clay soils, Digest 298. Watford, UK: Department of the Environment. [ Links ]
Building Research Station 1949. Foundations on shrinkable clays, Digest 3. London, UK: HMSO. [ Links ]
Calder, I R 1990. Evaporation in the Uplands, Chichester, UK: Wiley. [ Links ]
Cameron, D A 2000. Total soil suction regimes near trees in a semi-arid environment. Rahardjo, H, Toll, D G & Leong, E C (Eds) Unsaturated Soils for Asia, Rotterdam, Netherlands: Balkema, pp 739-743. [ Links ]
Coleman, J D 1965. Geology, climate and vegetation as factors affecting soil moisture. In: Aitchison, G D (Ed), Moisture equilibria and moisture changes in soils beneath covered areas, Sydney, Australia: Butterworth, pp 93-99. [ Links ]
Crilly M S, Driscoll, R M C & Chandler, R J 1992. Seasonal ground and water movement observations from an expansive clay site in the UK Proceedings, 7th International Conference on Expansive Soils, Dallas, Texas, USA: 313-318. [ Links ]
Croney, J D & Lewis, W A 1948. The effect of vegetation on the settlement of roads. Proceedings, Conference on Biology and Civil Engineering, London, UK, pp 195-202. [ Links ]
De Bruijn, C M A 1965. Some observations on soil moisture conditions beneath and adjacent to tarred roads and other surface treatments in South Africa. In: Aitchison G D (Ed), Moisture equilibria and moisture changes in soils beneath covered areas, Sydney, Australia: Butterworth, pp 135-142. [ Links ]
Dobson, M C & Moffat, A J 1995. A re-evaluation of objections to tree planting on containment landfills. Waste Management and Research, 13(6): 579-600. [ Links ]
Guangyi, Z 2004. Relations between typhoon storms, root systems and landslides. In: Barker, D H, Watson, A J, Sombatpanit, S, Northcutt, B & Magliano, A R (Eds), Ground and water bioengineering for erosion control and slope stabilization. Plymouth, UK: Science Publishers. [ Links ]
Li, J, Smith, D W & Fityus, S G 2003b. The effect of a gap between the access tube and the soil during neutron probe measurements. Austr J Soil Res, 41: 151-164. [ Links ]
Li, J, Smith, D W, Fityus, S G & Sheng, D 2003a. Numerical analysis of neutron moisture probe measurements. Int J Geomechanics, 3(1): 11-20. [ Links ]
Parry, R H 1992. Desiccation, some examples measured in London clay. Proceedings, 7th International Conference on Expansive Soils, Dallas, Texas, pp 404-408. [ Links ]
Reynolds, W D & Elrick, D E 1985. In situ measurement of field-saturated hydraulic conductivity, sorptivity and the a-parameter using the Guelph permeameter. Soil Science, 140(4): 292-302. [ Links ]
Richards, B G, Peter, P & Emerson, W W 1983. The effects of vegetation on the swelling and shrinking of soils in Australia. Geotechnique, 33(2): 127-139. [ Links ]
Russam, K & Coleman, J D 1961. The effect of climatic factors on subgrade moisture conditions. Geotechnique, 11(1): 1-22. [ Links ]
Russam, K & Dagg M, 1965. The effect of verge slope and cover on soil moisture distribution under a road in Kenya. In: Aitchison, G D (Ed), Moisture equilibria and moisture changes in soils beneath covered areas, Sydney, Australia: Butterworth, pp 100-121. [ Links ]
Schmugge, T J & Andre, J C (Eds) 1991. Land surface evaporation, measurement and parameterization, New York: Springer. [ Links ]
Smethurst, J A, Clarke, D & Powrie, W 2006. Seasonal change in pore water pressure in a grass-covered cut slope in London clay. Geotechnique 56(8): 523-538. [ Links ]
Terzaghi, K 1943. Theoretical soil mechanics, New York: Wiley, pp 330-338. [ Links ]
Ward, W H 1948. The effect of vegetation on the settlement of structures. Proceedings, Conference on Biology and Civil Engineering, London, pp 181-194. [ Links ]
Williams, A A B 1980. Severe heaving of a block of flats near Kimberley. Proceedings, 7th Regional Conference for Africa on Soil Mechanics, Accra, Ghana, 1, pp 301-309. [ Links ]
Wolpert, L 1952. The direct measurement of the natural moisture content of unsaturated soils. CSIR, NBRI Bulletin 9, Pretoria: National Building Research Institute. [ Links ]
 | GEOFF BLIGHT (Hon F SAICE) is Professor Emeritus of Civil and Environmental Engineering at the University of the Witwatersrand, Johannesburg. He has specialised in the study of environmental geotechnics since 1958 and has published more than 250 papers on the subject in refereed journals and the refereed proceedings of international conferences. He was the Cross Canada lecturer of the Canadian Geotechnical Society in 1996, the Rankine Lecturer of the British Geotechnical Society in 1997 and the Lawrence Lecturer of the Solid Waste Association of North America in 1999. |
 Contact details:
School of Civil and Environmental Engineering University of the Witwatersrand
Johannesburg Private Bag 3
WITS 2050 South Africa
T/F: 011 476 8759
blight@civil.wits.ac.za

