


Services on Demand
Article
 English (pdf)
 Article in xml format
 Article references
Indicators

Related links
-
 Cited by Google
 -
 Similars in Google
Share

 Permalink
Journal of the South African Veterinary Association
On-line version ISSN 2224-9435
Print version ISSN 1019-9128
J. S. Afr. Vet. Assoc. vol.94 n.1 Pretoria 2023
http://dx.doi.org/10.36303/JSAVA.518
REVIEW
Liver moisture content in animals and possible causes of variations in hepatic dry matter content
JBJ van RyssenI; EC WebbI; JG MyburghII
IDepartment of Animal Science, Faculty of Natural and Agricultural Sciences, University of Pretoria, South Africa
IIDepartment of Paraclinical Sciences, Faculty of Veterinary Science, University of Pretoria, South Africa
ABSTRACT
The concentration of trace elements in the liver is used as an indicator of the mineral nutritional status of an animal, as a benchmark of environmental mineral exposure, to follow the metabolism of an element in the body and for various other purposes. Concentrations are expressed on a wet (fresh) liver basis or on a dry liver basis. From a literature search and evidence from an analytical laboratory, large variations (varying from < 20% to > 40%) have been recorded on the percentage of moisture in the livers of ruminants. Such variations potentially compromise the interpretation of results on mineral concentrations in livers, and preclude robust comparisons between studies. Among the factors that can affect the moisture content of livers are: inconsistencies in sampling and preparation of liver samples; exposure to toxic substances; ill-health of the animal; fat content of the liver; and age of the animal. It was estimated that the mean dry matter (DM) content of the livers of healthy ungulates containing less than 1% liver fat is between 27.5% and 28.5%, and on a fat-free basis 25-26% DM. For routine analyses of liver samples it is suggested that to limit variations owing to differences in liver moisture content, liver mineral concentrations should be expressed on a DM basis, and for in-depth scientific studies on mineral metabolism on a dry, fat-free basis. However, if mineral concentrations are expressed on a wet basis, it is advisable to supply the liver DM content as well.
Keywords: antelope, bovine, liver dry matter, liver fat, ruminants
Introduction
The liver is not only the centre of many metabolic processes in the body, but also serves as a major storage organ for many trace elements and potentially toxic elements in the body. Trace element concentrations in the liver therefore reflect the degree of exposure of the body to such elements (Counotte et al. 2019; Ludwick et al. 2008). The liver is relatively easy to sample (Ludwick et al. 2008; Luna et al. 2019) and in analytical laboratories routine analyses are conducted on liver samples to establish trace element status of the animal which can be classified as deficient, marginal, sufficient or toxic. The concentrations of toxic elements in tissue samples are also measured to get an indication of any bio-accumulation of the elements, and whether they could pose a health risk to animals and humans in a specific environment (Kalisińska 2019). Reliable reference and clinical decision values for each category are therefore essential for the interpretation of element concentrations and a correct diagnosis of the trace element status (Counotte et al. 2019).
The question of whether mineral concentrations should be expressed on a dry matter (DM) or fresh (wet weight) basis is often raised. Theron et al. (1974) stated that any significant variation in the moisture content of different livers would have profound effects on mineral concentrations. Likewise, Ludwick et al. (2008) pointed out that the moisture level of liver samples is an important variable in the diagnostic assessment, and unknown percentages of moisture can potentially lead to false diagnoses. In 1978 Herbert et al. (1978) acknowledged the possibility of variations by stating that it is assumed that no changes in liver weight or DM content did occur over the experimental period, when publishing results of a study on chronic copper (Cu) poisoning in sheep.
In the widely used tables of Puls (1994), mineral concentrations in tissues are expressed on a wet weight basis. Puls (1994) argues that the wet basis is sufficiently precise because diagnostic ranges of mineral concentrations in tissues are not absolutely clear-cut. However, in other guidelines of diagnostic ranges such as those of Kincaid (2000), Suttle (2010) and the University of Wisconsin Veterinary Diagnostic Laboratory (WVDL 2015), tissue mineral concentrations are presented on a DM weight basis. Some prominent analytical and research laboratories express tissue mineral concentrations on a wet weight basis (López-Alonso & Miranda 2020; Luna et al. 2019; Neville et al. 2008), while for interspecies comparisons, values expressed on a DM basis are preferred (Kalisińska 2019). In a review on the assessment of the trace mineral status in ruminants, Spears et al. (2022) stated that they prefer that liver trace element concentrations are expressed on a DM basis.
Puls (1994) stated that the wet weight of tissues can be converted to dry weight by multiplying concentration on a wet basis by 3.5-4.0. This implies that these tissues contain between 28.6% and 25.6% DM, respectively. However, Long (1961) assigned a DM content of 30% to livers, thus a conversion of x3.3 from a wet to a DM basis. Underwood and Suttle (1999) stated in their tables that the hepatic mineral concentration on a DM basis can be divided by 3 to obtain values on a wet weight basis, meaning that a liver contains 33.3% DM. The WVDL uses a liver DM content of 28% for conversion from a wet to a DM basis (Kendall et al. 2015) and Miranda et al. (2010a) a liver DM content of 27.5% to convert the Cu concentration of liver biopsy samples, analysed on a DM basis, to a wet basis. To compare the mineral concentrations in mammalian tissues on a dry basis Kalisińska (2019) used moisture contents of 70.9% for livers, 75.5% for kidneys, 74.6% for muscle and 77% for the brain, and suggested conversion factors of 3.0, 2.5, 2.5, 2.0, respectively.
Hepatic dry matter content, as reported in the literature
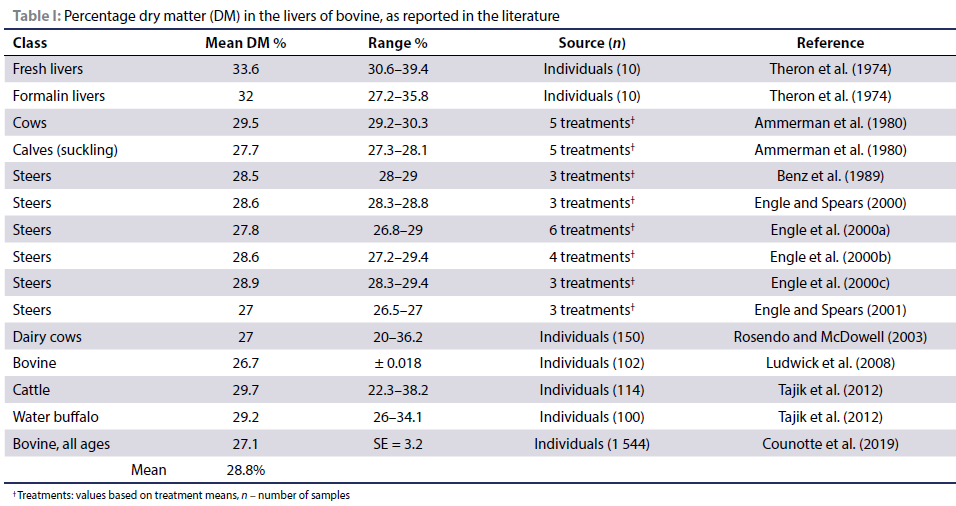
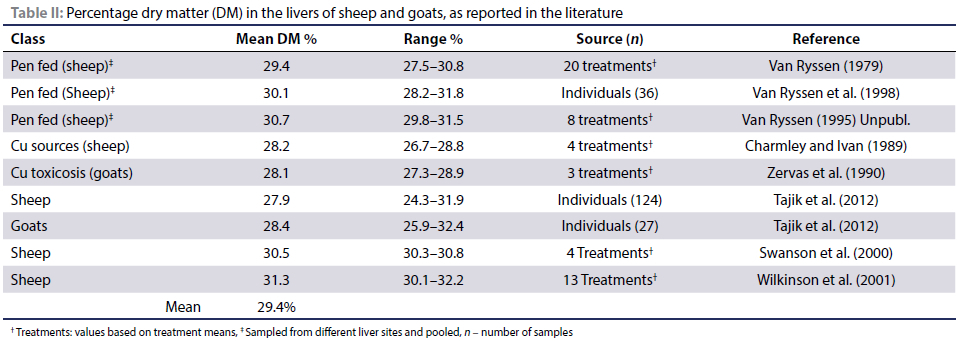
A literature search was conducted to record the liver DM content of apparently normal, healthy ruminants, and results are summarised in Tables I and II.
The DM contents of the liver samples varied substantially (Tables I and II), though the means are relatively close to 30%. Where results are based on means of experimental treatments, it can be expected that the individuals within groups, within a trial would be relatively uniform in terms of weight, condition and breed, which should show less variation than data from independent individuals.
Hepatic dry matter content of individual samples as recorded at an analytical laboratory
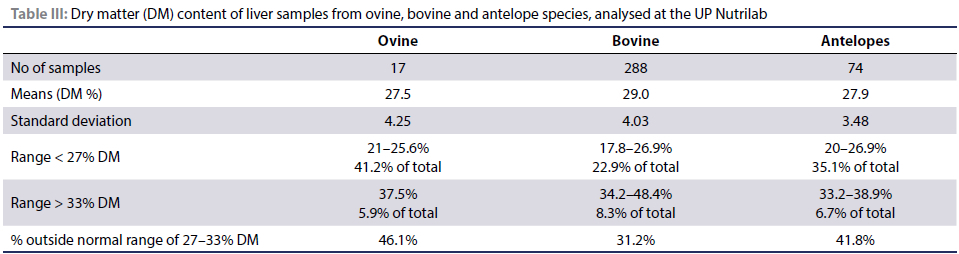
At the analytical laboratory of the Department of Animal Science at the University of Pretoria (UP Nutrilab), South Africa, trace element analyses have been conducted on samples of the livers of cattle, sheep and antelope species. Liver samples were received from customers, such as veterinarians, nutritional advisors, feed companies, farmers, and other research institutions. In most cases, no or insufficient information was provided about which part of the liver was sampled. Reasons for submissions varied from routine herd-health mineral status evaluation to specific investigations of animals to suspected deficiency or toxicity clinical problems. Blood and serum/plasma analyses were also done, but not relevant in this communication. Analyses were done in duplicate. Liver samples were dried at 60 °C for 48 hours after which the DM contents were calculated. Liver samples preserved in formalin were removed from the container, blotted with filter paper, and then dried. Dried samples were milled and stored. Before the chemical analyses were done, the samples were dried again, and then analysed. Mineral concentrations on a final DM basis were then converted to a fresh basis and results on both a fresh and DM basis were reported to the customer. Dry matter contents of livers were recorded of 17 ovine, 288 bovine and 74 antelope (consisting of 14 different species) samples, and grouped according to concentrations within or outside the "normal ranges" (Table III). Dry matter concentrations of between 27% and 33% were classified arbitrary as a "normal range".
Although the mean DM percentages of the three classes of ruminants in Table III are not substantially different from those in Tables I and II, the variations around the means are large. In general, more than a third of the samples contained DM percentages outside the normal range.
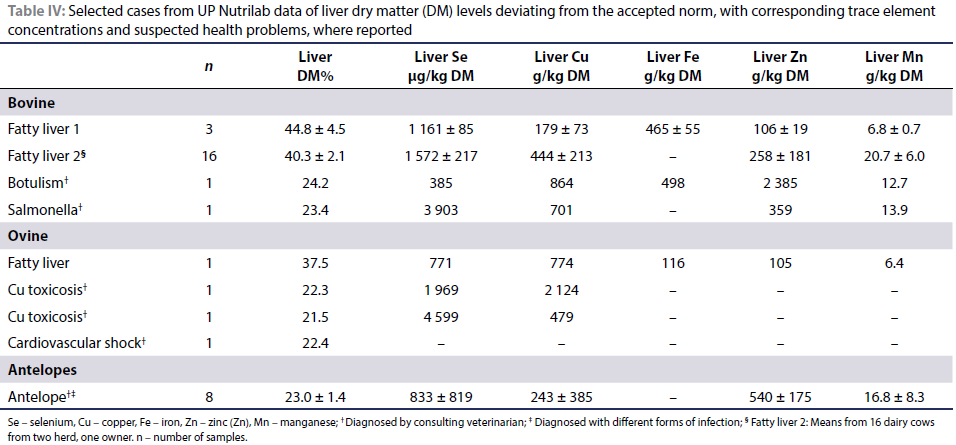
In the cases where liver DM percentages were in the upper range, > 33%, or lower range, < 27%, the results of mineral analyses and diagnosed health condition where reported, are presented in Table IV, to ascertain whether any hepatic trace element concentration or heath condition could be associated with an abnormal DM content.
For the sake of evaluating the mineral concentrations in the livers presented in Table IV, the "adequate ranges" for cattle, published by Puls (1994), converted to a DM basis (assuming liver DM level to be 28%), have been used: Cu: 89-357 mg/kg DM; zinc (Zn): 89-357 mg/kg DM; manganese (Mn): 9-21 mg/kg DM; iron (Fe): 161-1070 mg/kg DM and selenium (Se): 890-1 790 μg/kg DM.
Bovine livers containing more than 34% DM (Table IV) were all from dairy cows. The ovine liver with the high fat content was from an ewe. In the cases of high fatty livers, mineral concentrations were within normal ranges, except for the livers (preserved in formalin) of the group of 16 cows where the livers contained high concentrations of Zn and more than double the concentration of Mn than all the other livers analysed. The DM contents (21.5% and 22.3%) of the livers of the two sheep that died from chronic Cu poisoning were well below 28%, as observed for sheep without toxicosis symptoms. Liver DM levels were below 24.6% in the cases where causes of death were diagnosed as owing to botulism, salmonellosis, cardiovascular shock, theileriosis and bronchopneumonia, bacterial enteritis, etc., and the livers from many of these animals contained elevated concentrations of Zn. It is well documented that stressors such as infections result in elevated levels of Zn in the livers of animals (Bremner & Beattie 1995). This is evident in the results presented in Table IV, where the liver Zn concentration of the animal suffering from botulism was 2 385 mg/kg DM and the livers of the antelopes suffering from different forms of infection contained 540 ± 175 mg Zn/kg DM, all well above 357 mg Zn/kg DM, the upper level of adequacy, as suggested by Puls (1994).
Analytical accuracy but biological probability
It is important to determine if deviations in the moisture content of livers are of practical significance when evaluating the mineral nutritional status of animals, e.g. is the difference between a concentration at 25% and 30% liver DM (16.7% lower than the 30%, or 20% above 25% DM, respectively) of practical significance in the interpretation of results?
Reference ranges have been established for livestock based on mineral concentrations in the liver, blood serum/plasma and other tissues, in publications by Puls (1994) and Kincaid (2000). However, according to Strickland et al. (2019) reference ranges of sufficient hepatic reserves are ill-defined and the critical points or ranges often differ substantially between sources of reference. López-Alonso et al. (2000), for instance, pointed out that there is no clear consensus as to what tissue concentrations of Cu indicate deficiency in cattle. Suttle (1988) summarised the situation by stating that the assessment of risk of mineral deficiency will depend upon whose standard forms the basis for comparison.
Reference ranges are usually wide, and differences between tables of such ranges are only of significance at the end-points of such ranges, the so-called threshold values above or below which potential toxicities or deficiencies could be expected. However, because of biological variation, such threshold values are never 100% accurate. Similarly, converting DM content from a wet to a dry basis or vice versa using conversion factors based on averages from other studies, compromises high analytical precision. Underwood and Suttle (1999) and Suttle (2010) described reference ranges as diagnostically unhelpful, and preferred to describe a low mineral status in livestock as being within marginal bands.
Many factors may affect the relevance of a specific concentration, such as difference between species and breeds of livestock, differences between production systems and age differences. However, the reality is that diagnosticians often have to make decisions based on specific criteria (Counotte et al. 2010; Kendall et al. 2015; López-Alonso & Miranda 2020), and lack of clear-cut threshold levels does create a problem, also in cases of litigation. The relevance and importance of differences in liver moisture contents should therefore be judged with these uncertainties in mind.
Possible causes of deviations in liver dry matter from a norm
Sampling, preparation and storage on moisture in liver samples
In the sampling of a liver for analyses, it should be noted that non-hepatocyte-containing tissue such as bile ducts, connective tissue, vasculature and fat could be present in the sample. Ideally this should be avoided, because the presence of such tissues would affect the concentration of an element in the liver tissue and the moisture content of the sample.
Liver samples are submitted to analytical laboratories either as fresh or frozen tissue samples, or samples preserved in buffered formalin. Apart from the accuracy of the drying process, i.e. if drying to a constant weight was ensured, potential problems in laboratories arise from excess fluid in collected samples (especially biopsy samples) or loss of moisture during sample handling, transit or storage (Ludwick et al. 2008). Freezing and thawing could also result in some loss of moisture. Both Bischoff et al. (2008) and Ludwick et al. (2008) demonstrated with examples of liver Cu concentrations how Cu status would have been classified differently (either within or outside of the deficiency reference range) depending on whether the liver samples were submitted as fresh/frozen, or preserved in formalin.
Sullivan et al. (1993) reported that dehydration of a liver sample can be caused by formalin-fixation, and with this water loss, the reduced mass of the tissue caused a relative increase in Se concentration, although total Se in the liver remained the same. On the other hand, Bischoff et al. (2008) pointed out that fluid imbibition can occur during tissue fixation, resulting in an increase in sample weight and a decline in trace element concentration. They recorded an increase of 18% in the weight of liver samples after two weeks in formalin, with a decrease of 19% in Cu concentration. Although Gellein et al. (2008) strongly advised that fresh/frozen samples should be analysed rather than formalin-preserved samples, Bischoff et al. (2008) recommended that the reporting of mineral results should be on a DM basis rather than on an as-received basis because this would eliminate changes owing to fluid loss or imbibition during fixation.
In a survey on free-roaming cervid species in Norway, Vikøren et al. (2011) recorded wide variations in the liver DM contents. In moose (Alces alces) a range of 22-44% was recorded, in roe deer (Capreolus capreolus), a range of 22-39% and in reindeer (Rangifer tarandus), a range of 22-40%. The authors reported that the liver samples were collected by hunters, put in a plastic box and sent by mail to the laboratory. Dehydration during delivery could possibly have been the reason for the high DM content of some samples.
It has been reported that trace elements are not homogenously distributed throughout the liver (Miranda et al. 2010a; Luna et al. 2019). A factor contributing to this variation could be variations in DM content in different areas of the liver, as reported by Theron et al. (1974) and Ludwick et al. (2008). However, Van Ryssen (1980) did not record significant differences in DM content between sampling sites in ovine livers. Based on variations in the potassium (K) concentrations in the liver, Ludwick et al. (2008) advised against the sampling of the caudate lobe for submission to a toxicology laboratory, since the moisture content at this site is significantly lower than in the rest of the liver.
Provided the liver sample has not been taken from the caudate lobe (Ludwick et al. 2008), factors related to sample preparation and storage would have slight effects on liver DM content. Since criteria of mineral nutritional status do not have precise cut-off points, such variations in the moisture content of fresh or frozen samples should not have a major effect in the interpretation of mineral status of animals. Results from samples preserved in formalin might be less reliable, though mainly because of leaching of trace elements from tissue samples into the formalin (Gellein et al. 2008).
Effect of toxicosis on liver moisture content
When considering possible reasons for a liver DM content of below that of a normal healthy animal, factors affecting the well-being/health of the liver would probably be the first to be considered. These include factors such as exposure to chemicals and drugs, disease-causing pathogens, and intake of minerals and other nutrients in excess of requirements. Unfortunately the DM levels of the livers in such cases are seldom reported in the literature.
In studies describing chronic Cu toxicosis in sheep, the appearance of the liver is described as friable, flabby, soft, pale, swollen, brownish or yellowish (Gopinath & Howell 1975; Howell & Gooneratne 1987; Jenkins & Hidiroglou 1988). In a Cu poisoning study by Van Ryssen and Barrowman (1987), the liver DM of three lambs that had been sacrificed "in extremis" (elevated enzymes) were 24.3%, 23% and 22.8%, compared to 27.3% DM for the hypercuprotic sheep not showing any toxicosis symptoms. Likewise, Zervas et al. (1990) found that by the end of the experimental period, lambs that received added Cu in their diets, developed Cu toxicosis symptoms, and their livers contained 23.4% and 23.5% DM compared with 26.2% in the control receiving no Cu. This conclusion is supported by the low liver DM values (21.5% and 22.3%) of the sheep suffering from Cu toxicosis, reported in Table IV. The average DM% of the livers from the seven sheep suffering from chronic Cu poisoning, reported here, was 23.1 ± 1.0%.
Effect of ill health and diseases on liver moisture content
Hall (2006) and Socha et al. (2012) pointed out that when interpreting mineral concentrations in animal tissue, samples from sick, injured or stressed animals should be avoided. Diseases can shift minerals from tissue to serum or serum to tissue. A proportion of samples received by the UP Nutrilab for mineral analysis, were from animals which had died or suffered from ill health. In the cases where the causes of death were botulism, salmonellosis, cardiovascular shock, theileriosis and bronchopneumonia, bacterial enteritis, etc., liver DM levels were below 24.6%.
Results from Table IV suggest that a lower liver DM content is often associated with ill health except in the cases where ill health was accompanied by fatty livers, resulting in a high liver DM content. The metabolic disorder, hepatic steatosis or fatty liver, causes detrimental effects on the health, well-being, productivity or reproductive success of dairy cows with the associated symptom, ketosis, in dairy cows (Bobe et al. 2004; Jorritsma et al. 2001) and pregnancy toxaemia in sheep (Crilly et al. 2021; Ferguson 1954). Rosendo and McDowell (2003) demonstrated the existence of an inverse relationship between total lipids in the liver and percentage liver moisture in dairy cattle. They calculated that total lipid and triacylglycerols (TAG) concentrations in the liver are highly and positively correlated with liver DM (r = 0.66 and r = 0.64, respectively) and at a liver DM ranging between 25% and 36% DM, third-order polynomial equations were recorded with R2s of 0.5632 and 0.6103 for total lipids and TAG, respectively, and MSPEs (mean square predictive error) of 1.4946 and 1.1259, respectively.
In summarising the results from 10 published studies on fatty livers in dairy cows, Bobe et al. (2004) calculated that in the first month after calving, 5-10% of dairy cows suffered from severe fatty liver and 30-40% from moderate fatty livers. According to Bobe et al. (2004) this indicates that up to 50% of dairy cows are at a high risk for diseases and reproductive problems. In this disorder, liver total lipids consisted mainly of triacylglycerols (TAG) (Bobe et al. 2004; Rosendo & McDowell 2003). Bobe et al. (2004) categorised fatty liver into three classes: clinical fatty livers as > 10% TAG (wet weight basis) where the liver is enlarged and necrotic; moderately fatty livers, at between 5% and 10% TAG, with TAG infiltration throughout the liver; and mild fatty livers as 1-5% TAG with centrilobular TAG infiltration and normal livers < 1% TAG on a wet basis. Gaal et al. (1983) used the same categories and indicated that in the case of severe fatty livers (liver TAG > 10% wet weight) total lipids constitute > 40% of liver volume; moderate fatty livers, 20-40% of liver volume and mild fatty liver, < 20% of liver volume.
Ferguson (1954) recorded liver DM contents of between 34% and 51% in ewes at the end of pregnancy after being on a low plane of nutrition and then starved for a few days. The livers of ewes on a low plane of nutrition that developed pregnancy toxaemia contained between 37% and 48% DM. Since the gross weight of the livers did not change, Ferguson (1954) concluded that fat infiltration in the liver occurred at the expense of water.
In a survey on non-productive ruminants, Tajik et al. (2012) measured liver DM and fat percentages in cattle, buffalo (probably the water buffalo), sheep and goats. The mean DM percentages of livers in these species are presented in Tables I and II. The livers of the cattle (bovine) in the survey contained 3.6% (range: 0.4-12.4%) fat on a dry liver basis and 1.1 (range: 0.1-3.6%) on a wet matter basis. The respective fat percentages for buffalo were 5.3% (range: 0.4-20.5%) on a dry and 1.6% (range: 0.1-6.2%) on a wet basis; in sheep, 3% (range: 0.92-5.14%) on a dry and 0.83% (range: 026-1.55%) on a wet basis, and for goats, 2.91% (range: 0.8-6.6%) on a dry and 0.9% (range: 0.22-2.06%) on a wet basis.
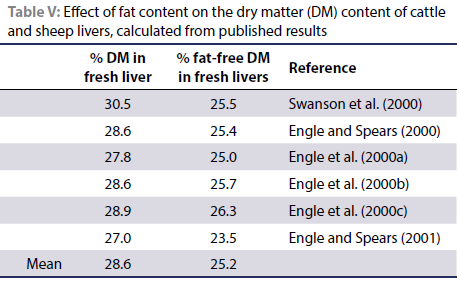
In a series of articles, Engle and Spears (2000; 2001) and Engle et al. (2000a; 2000b; 2000c) published the liver DM contents of steers on feedlot diets as well as the percentage fat in their livers (Table V). These values varied between 2.5% and 3.8% fat on a wet liver basis and by converting the published levels to a liver DM basis, between 8.5% and 14% fat. According to Bobe et al.'s (2004) classification for dairy cattle, these steers would have "mild fatty livers". Tajik et al. (2012) also recorded a few individuals with liver fat contents of over 5% on a wet basis. Based on data on sheep published by Swanson et al. (2000) it was calculated that these sheep livers contained 30.5% DM and when calculated on a fat-free basis, 25.5% DM. Based on these data, the mean percentage fat-free DM in fresh livers was calculated to be 25.2% (Table V).
In a study on captive mink (Mustela vison), Clausen and Sandbøl (2004) calculated the correlation between percentage DM (x) and corresponding fat content (y) in mink livers, and reported a regression of y = 1.1523x - 24.903 with an R2 = 0.973. According to the calculation a dry, fat-free mink liver contains 24.9% DM.
One can assume that a normal, healthy liver would contain a certain percentage of fat, less than 1% on a wet basis, as suggested by Bobe et al. (2004), and that criteria for assessing the mineral status of animals would be based on normal, healthy livers, i.e. a liver containing some fat. However, in-depth mineral metabolism studies should probably be done on a dry, fat-free basis.
Since the minerals will be present only in the protein-rich, functional mass of the hepatocytes (Ludwick et al. 2008; Strickland et al. 2019) and not in the fatty portion of the cell (Herdt & Hoff 2011), high percentages of fat would have a diluting effect on the concentration of mineral elements in the liver. Strickland et al. (2019) noted that there is an apparent inverse relationship between hepatic copper and fat concentrations in the liver. This inverse relationship would be applicable to all mineral elements in the liver. In converting the Se, Cu and Zn concentrations in the livers of the group of 16 cows with high fatty livers in the UP Nutrilab samples (Table IV) to a low fat basis of 28% DM, the trace element concentrations are approximately 44% higher on the calculated fat-free basis compared to that on the original high-fat DM basis.
Trace element concentrations measured on a total fat-free liver sample would introduce some error compared to that of a "normal" liver containing a small amount of fat, probably < 1%. However, in view of the lack of clarity of reference ranges, that should not have a significant effect on the interpretation of results. Since the number of fat-free cells (the functional mass, Ludwick et al. [2008]) per unit weight will increase if fat is extracted from the cells, it is suggested that fat extraction and fat determination be done on a separate liver sample from the sample that is analysed for mineral concentration.
Effect of level of nutrition on liver mass and moisture content
Level of nutrition has a marked effect on visceral organ mass in general and specifically on liver mass relative to empty body weight (EBW). Burrin et al. (1990) reported that the absolute weight of livers in sheep receiving a maintenance diet was ca. 40% lower (13.6 g/kg EBW) than in sheep receiving the same diet ad libitum (22.4 g/kg EBW). These marked nutritional effects on relative liver size are due mainly to changes in cell size (cellular hypertrophy) rather than in cell numbers (hyperplasia) (Fluharty & McClure 1997; Neville et al. 2008; Nozière et al. 1999; Sainz & Bentley 1997; Soto-Navarro et al. 2004).
From the previous discussion it can be concluded that the percentage fat in the liver of an animal on a high level of nutrition would contribute to a higher liver DM content compared to an animal on a starvation type of diet. It is also well-documented that obesity in humans is associated with fat deposition in the liver (Jakobsen et al. 2007; Reddy & Rao 2006), and this would probably be the case in other mammalian species as well. However, this could not be substantiated in literature consulted. In calculating liver DM percentage from data on ewes published by Nozière et al. (1999), liver DM was 27.6% in an underfed treatment, 28.3% in a maintenance treatment, and 30.4% in the underfed followed by overfeeding group and 29.0% in the maintenance followed by overfeeding treatment group. This suggests that the level of feeding did not have a major effect on the DM content of the livers. Likewise, Swanson et al. (2000) recorded that the ratio of dry weight:fresh weight for liver of sheep was not influenced by level of feed intake when fed at 60% ad libitum vs 95% ad libitum levels (30.5% vs 30.4% respectively). However, it should be noted that in this study the livers (on a DM basis) of the low-intake group still contained 14.9% fat compared to 18% fat in the high feed intake treatment
Nozière et al. (1999) reported a 19.9% increase in cell number (DNA, mg/g tissue) in ewes that had been underfed for 78 days compared with ewes at a maintenance level of nutrition. This implies that the liver cells decreased in size and per kg liver mass increased in cell number, i.e. an increase in functional mass per unit liver weight (Ludwick et al. 2008). A conclusion from this is that trace element concentrations in a liver sample are likely to be higher at low levels of nutrition (smaller liver), compared to concentrations at high levels of nutrition, provided trace element intake was the same.
Age
Puls (1994) stated that if a tissue concentration on a wet basis is to be converted to an approximate dry basis, for general purposes the wet weight should be multiplied by 3.5-4.0, though for foetal tissues by 5.0-6.0. This implies that foetal tissues have a much higher moisture content than in live animals. Herdt and Hoff (2011) presented the liver DM concentrations of 534 adult cattle and 523 neonates and foetuses to be 28% and 24%, respectively.
Breed differences
Breed differences as well as nutritional and other dietary factors can affect liver weight relative to body weight (Miranda et al. 2010b; Pereira et al. 2018). A possible cause of breed differences in liver moisture content could be differences in fat deposition in the livers of breed types. Mielenz et al. (2013) compared the lipid metabolism in two related cattle families, one bred for high fat accretion (high fat accretion but low milk production) and the other as a lean-type (low fat accretion but high milk production). Liver fat percentages of the two types were very similar 15.7% (fat-type) vs 17.3% (lean-type, and not affected by metabolic stress [Hammon et al. 2010]), while fat deposition in the adipose tissue in the rest of the carcass was significantly higher in the fat-type than in the lean-type, e.g. total carcass fat was 101.8 vs 65.8 kg and total inner fat, 60 vs 40 kg, respectively. One could therefore speculate that the livers of the two types contain approximately the same percentage of DM.
Species differences
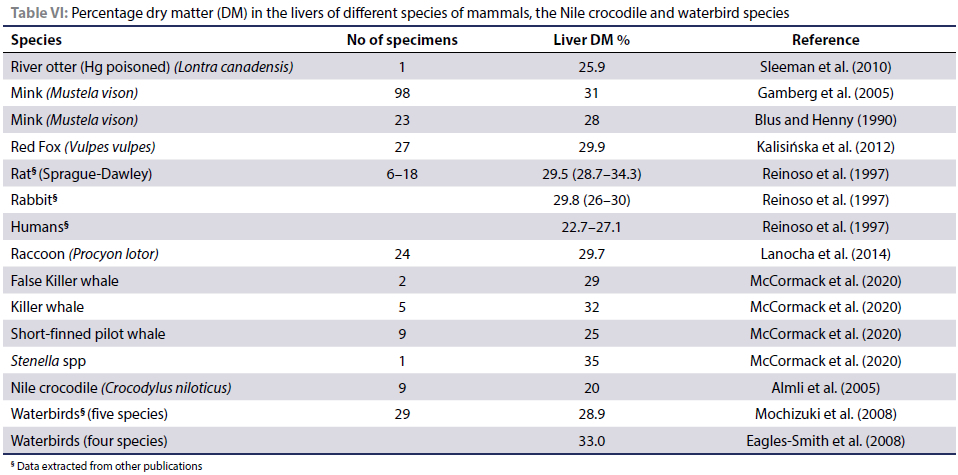
For comparative purposes, liver DM contents of a variety of wild species of animals are presented in Table VI. A general observation is that the livers contain approximately 30% DM (70% moisture), with notable variations in DM contents. An interesting outlier is the Nile crocodile, a reptile, whose livers contained an average of 20% DM (80% moisture).
Conclusion
Apart from the age of the animal, major causes of variations in the percentage of moisture and thus DM content of the liver are ingestion of certain toxic substances, ill health of the animal and fat accumulating in the liver. Furthermore, liver sampling, preparation and storage could affect liver moisture content if not performed correctly. These factors will result in fluctuations in the moisture content and thus in trace element concentrations of the liver when expressed on a wet basis. This may influence the interpretation of analytical data and precludes robust comparisons between studies and between species. Furthermore, the use of conversion factors and threshold values has limitations because they are based on averages with inherent variations.
From the ruminant species investigated, the DM content of a normal, healthy liver is lower than the generally accepted 30%, and approximately 27.5-28.5%, while fat-free livers contain approximately 25-26% DM. In analytical laboratories catering for a wide variety of customers, liver DM contents of < 25% and > 34% would be an indication of possible abnormal situations, which would compromise the interpretation of mineral concentrations. It is suggested that when conducting routine analyses, the DM content of liver samples should be measured and reported, and results should be presented on a DM basis.
This would also overcome the problem of the possibility of loss of moisture during the preparation and storage of liver samples. In the case of fatty livers with a high DM content, it is recommended that a correction be made for actual fat content, especially in in-depth scientific studies. A high DM content of a liver sample, > 34% DM, could be used to indicate that fat extraction is required, though it could also be due to dehydration of the sample.
To assess the mineral nutritional status of healthy flocks and herds, or in controlled experimental situations, concentration on a dry weight basis is preferred. If actual DM values are not available, wet/fresh weight values together with calculated DM values based on a 28% DM content could be used to make clinical judgements.
Acknowledgements
The authors wish to acknowledge the input and dedication of the UP Nutrilab staff under E Ferreira for the analyses and recording of the data.
Conflict of interest
The authors declare no conflict of interest.
Funding sources
No funding was required.
ORCID
JBJ van Ryssen https://orcid.org/0000-0002-9603-1869
EC Webb https://orcid.org/0000-0001-5648-6319
JG Myburgh https://orcid.org/0000-0002-2132-7251
References
Almli, B., Mwase, M., Sivertsen, T., et al., 2005, Hepatic and renal concentrations of 10 trace elements in crocodiles (Crocodylus niloticus) in the Kafue and Luangwa rivers in Zambia, Sci Total Environ 337(1-3), 75-82. https://doi.org/10.1016/j.scitotenv.2004.06.019. [ Links ]
Ammerman, C.B., Chapman, H.L., Bouwman, G.W., et al., 1980, Effect of supplemental selenium for beef cows on the performance and tissue selenium concentrations of cows and suckling calves, J Anim Sci 51(6), 1381-1386. https://doi.org/10.2527/jas1981.5161381x. [ Links ]
Benz, D.A., Byers, F.M., Schelling, G.T., et al., 1989, Ionophores alter hepatic concentrations of intermediary carbohydrate metabolites in steers, J Anim Sci 67(9), 2393-2399. https://doi.org/10.2527/jas1989.6792393x. [ Links ]
Bischoff, K., Lamm, C., Erb, H.N., et al., 2008, The effect of formalin fixation and tissue embedding of bovine liver on copper, iron and zinc analysis, J Vet Diagn Invest 20, 220-224. https://doi.org/10.1177/104063870802000213. [ Links ]
Blus, L.J., Henny, C.J., 1990, Lead and cadmium concentrations in mink from Northern ldaho, Northwest Sci 64, 219-223. [ Links ]
Bobe, G., Young, J.W., Beitz, D.C., 2004, Pathology, etiology, prevention, and treatment of fatty liver in dairy cows, J Dairy Sci 87(10), 3105-3124. https://doi.org/10.3168/jds.S0022-0302(04)73446-3. [ Links ]
Bremner, I., Beattie, J.H., 1995, Copper and zinc metabolism in health and disease: speciation and interactions. Proc Nutr Soc 54, 489-499. https://doi.org/10.1079/PNS19950017. [ Links ]
Burrin, D.G., Ferrell, C.L., Britton, R.A., et al., 1990, Level of nutrition and visceral organ size and metabolic activity in sheep, Br J Nutr 64(2), 439-448. https://doi.org/10.1079/BJN19900044. [ Links ]
Charmley, L.L., Ivan, M., 1989, The relative accumulation of copper in the livers and kidneys of sheep fed corn silage supplemented with copper chloride, copper acetate or copper sulphate, Can J Anim Sci 69(1), 205-214. https://doi.org/10.4141/cjas89-024. [ Links ]
Clausen, T.N., Sandbøl, P., 2004, Correlation between liver fat and dry matter in mink (Mustela vison), in B. Urlings, B. Spruijt, M. Ruis & L. Boekhorst (eds), Proceedings of the VIII International Scientific Congress in Fur Animal Production, 'sHertogenbosch, The Netherlands, September 15-18, 2004, pp.168-169. Scientifur ISSN 0105-2403 vol. 28(3). [ Links ]
Counotte, G., Holzhauer. M., Carp-van Dijken, S., et al., 2019, Levels of trace elements and potential toxic elements in bovine livers: A trend analysis from 2007 to 2018, PLoS ONE 14(4): e0214584. https://doi.org/10.1371/journal.pone.0214584. [ Links ]
Crilly, J.P., Phythian, C., Evans, M., 2021, Advances in managing pregnancy toxaemia in sheep, In Practice 43(2), 79-94. https://doi.org/10.1002/inpr.17. [ Links ]
Eagles-Smith, C.A., Ackerman, J.T., Adelsbach, T.L., et al., 2008, Mercury correlations among six tissues for four waterbird species breeding in San Francisco Bay, California, USA, Environ Toxicol Chem 27(10), 2136-2153. https://doi.org/10.1897/08-038.1. [ Links ]
Engle, T.E., Spears, J.W., 2000, Dietary copper effects on lipid metabolism, performance, and ruminal fermentation in finishing steers, J Anim Sci 78(9), 2452-2458. https://doi.org/10.2527/2000.7892452x. [ Links ]
Engle, T.E., Spears, J.W., 2001, Performance, carcass characteristics, and lipid metabolism in growing and finishing Simmental steers fed varying concentrations of copper, J Anim Sci 79(11), 2920-2925. https://doi.org/10.2527/2001.79112920x. [ Links ]
Engle, T.E., Spears, J.W., Armstrong, T.A., et al., 2000a, Effects of dietary copper source and concentration on and lipid and cholesterol metabolism in growing and finishing steers, J Anim Sci 78(4), 1053-1059. https://doi.org/10.2527/2000.7841053x. [ Links ]
Engle, T.E., Spears, J.W., Fellner, V., et al., 2000b, Effects of soybean oil and dietary copper on ruminal and tissue lipid metabolism in finishing steers, J Anim Sci 78(10), 2713-2721. https://doi.org/10.2527/2000.78102713x. [ Links ]
Engle, T.E., Spears, J.W., Xi, L., et al., 2000c, Dietary effects on lipid metabolism and circulating catecholamine concentrations in finishing steers, J Anim Sci 78(10), 2737-2744. https://doi.org/10.2527/2000.78102737x. [ Links ]
Ferguson, N.L., 1954, Changes in the liver fat of pregnant sheep at different levels of nutrition and during starvation, Br J Nutr 8(3), 269-280. https://doi.org/10.1079/BJN19540039. [ Links ]
Fluharty, F.L., McClure, K.E., 1997, Effects of dietary energy intake and protein concentration on performance and visceral organ mass in lambs, J Anim Sci 75(3), 604-610. https://doi.org/10.2527/1997.753604x. [ Links ]
Gaal, T., Reid, I.M., Collins, R.A., et al., 1983, Comparison of biochemical and histological methods of estimating fat content of livers of dairy cows, Res Vet Sci 34(2), 245-248. https://doi.org/10.1016/S0034-5288(18)32268-9. [ Links ]
Gamberg, M., Boila, G., Stern, G., et al., 2005, Cadmium, mercury and selenium concentrations in mink (Mustela vison) from Yukon, Canada, Sci. Total Environ 351-352, 523-529. https://doi.org/10.1016/j.scitotenv.2004.07.035. [ Links ]
Gellein, K., Flaten, T.P., Erikson, K.M., et al., 2008, Leaching of trace elements from biological tissues by formalin fixation, Biol Trace Elem Res 121, 221-225. https://doi.org/10.1007/s12011-007-8051-1. [ Links ]
Gopinath, C., Howell, J.McC., 1975, Experimental chronic copper toxicity in sheep. Changes that follow the cessation of dosing at the onset of haemolysis, Res Vet Sci 19(1), 35-43. https://doi.org/10.1016/S0034-5288(18)33551-3. [ Links ]
Hall, J.O., 2006, Assessing mineral status of dairy cattle, Inter-Mountain Nutritional Conference, Jan 2006, Salt Lake City. pp. 33-41. http://www.usu.edu/trdhiman/IMNC/2006.html. [ Links ]
Hammon, H.M., Metges, C.C., Schulz, A., et al., 2010, Differences in milk production, glucose metabolism, and carcass composition on 2 Charolais X Holstein F2 families derived from reciprocal paternal and maternal grandsire crosses, J Dairy Sci 93(7), 3007-3018. https://doi.org/10.3168/jds.2009-2931. [ Links ]
Herbert, J.G., Wiener, G., Field, A.C., 1978, The effect of breed and of dried seaweed in the diet on the levels of copper in liver, kidney and plasma of sheep fed on a high copper diet, Anim Prod 26, 193-201. https://doi.org/10.1017/S0003356100039611. [ Links ]
Herdt, T.H., Hoff, B., 2011, The use of blood analysis to evaluate trace mineral status in ruminant livestock, Veterinary Clinics: Food Animal Practice 27(2), 255-283. https://doi.org/10.1016/j.cvfa.2011.02.004. [ Links ]
Howell, J.McM., Gooneratne, S.R., 1987. The pathology of copper toxicity in animals. Ch 9 in Copper in Animal and Man. Ed. Howell, J.McM., Gawthorne, J.M., 1987 Volume II, 71-78, CRC Press Inc. Boca Raton , Florida, USA. [ Links ]
Jakobsen, M.U., Berentzen, T., Sorensen, T.I.A., et al., 2007, Abdominal obesity and fatty liver, Epidemiologic Reviews 29(1), 77-87. https://doi.org/10.1093/epirev/mxm002. [ Links ]
Jenkins, K.J., Hidiroglou, M., 1988, Tolerance of the calf excess copper in milk replacer, J Dairy Sci 72(1), 150-156. https://doi.org/10.3168/jds.S0022-0302(89)79090-1. [ Links ]
Jorritsma, R., Jorritsma, H., Schukken, Y.H., et al., 2001, Prevalence and indicators of post partum fatty infiltration of the liver in nine commercial dairy herds in The Netherlands, Livest Prod Sci 68(1), 53-60. https://doi.org/10.1016/S0301-6226(00)00208-6. [ Links ]
Kalisińska, E., 2019, Mammals and birds as bioindicators of trace element contaminations in terrestrial environments. An ecotoxicological assessment of the Northern Hemisphere. Springer Nature Switzerland. https://doi.org/10.1007/978-3-030-00121-6_2. [ Links ]
Kalisińska, E., Lisowski, P., Kosik-Bogacka, D.I., 2012, Red fox Vulpes volpe (L., 1758) as a bioindicator of mercury contamination in terrestrial ecosystems of North-Western Poland, Biol Trace Elem Res 145, 172-180. https://doi.org/10.1007/s12011-011-9181-z. [ Links ]
Kendall, N.R., Holmes-Pavord, H.R., Bone, P.A., et al., 2015, Liver copper concentration in cull cattle in the UK: are cattle being copper loaded, Vet Rec 177(19), 493. https://doi.org/10.1136/vr.103078. [ Links ]
Kincaid, R.L., 2000, Assessment of trace mineral status of ruminants: A review, Journal of Animal Science, 77(Suppl E), 1-10. https://doi.org/10.2527/jas2000.77E-Suppl1x. [ Links ]
Lanocha, N., Kalisińska, E., Kosik-Bogacka, D.I., et al., 2014, Mercury levels in raccoons (Procyon lotor) from the Warta Mouth National Park, Northwestern Poland, Biol Trace Elem Res 159, 152-160. https://doi.org/10.1007/s12011-014-9962-2. [ Links ]
Long, C., 1961, Biochemists handbook, F.N. Spon Ltd, London. [ Links ]
López-Alonso, M., Miranda, M., 2020, Copper supplementation, a challenge in cattle, Animals 10(10), 1890. https://doi.org/10.3390/ani10101890. [ Links ]
López-Alonso, M., Benedito, J.L., Miranda, M., et al., 2000, Arsenic, cadmium, lead, copper and zinc in cattle from Galicia, NW Spain, Sci Total Environ 246, 237-248. https://doi.org/10.1016/S0048-9697(99)00461-1. [ Links ]
Ludwick, T.P., Poppenga, R.H., Green, P.G., et al., 2008, The correlation of potassium content and moisture in bovine liver samples analyzed for trace mineral concentrations, J Vet Diagn Invest 20, 314-320. https://doi.org/10.1177/104063870802000308. [ Links ]
Luna, D., Miranda, M., Pereira, V., et al., 2019, Variation in trace element content between liver lobes in cattle. How important is the sampling site? J Trace Elem Med Biol 52, 53-57. https://doi.org/10.1016/j.jtemb.2018.11.008. [ Links ]
McCormack, M.A., Fielding, R., Kiszka, J.J., et al., 2020, Mercury and selenium concentrations, and selenium:mercury molar ratio in small cetaceans taken off St Vincent, West Indies, Environ Res 181, 108908. https://doi.org/10.1016/j.envres.2019.108908. [ Links ]
Mielenz, M., Kuhla, B., Hammon, H.M., 2013, Abundance of adiponectin system and G-protein coupled receptor GPR109A, RNA in adipose tissue and liver of F2 offspring cows of Charolais X German Holstein crosses that differ in body fat accumulation, J Dairy Sci 96(1), 278-289. https://doi.org/10.3168/jds.2012-5816. [ Links ]
Miranda, M., Benedito, J.L., Gutiérrez, B., et al., 2010a, The interlobular distribution of copper in the liver of beef calves on a high-copper diet, J Vet Diagn Invest 22, 277-281. https://doi.org/10.1177/104063871002200221. [ Links ]
Miranda, M., Gutiérrez, B., Benedito, J.L., et al., 2010b, Influence of breed on blood and tissue copper status in growing and finishing steers fed diets supplemented with copper, Arch Anim Nutr 64(2), 98-110. https://doi.org/10.1080/17450390903461576. [ Links ]
Mochizuki, M., Mori, M., Hondo, R., et al., 2008. A new index for evaluation of cadmium pollution in birds and mammals, Environ Monitor Assess 137, 35-49. https://doi.org/10.1007/s10661-007-9727-x. [ Links ]
Neville, T.L., Ward, M.A., Reed, J.J., et al., 2008, Effects of level and source of dietary selenium on maternal and fetal body weight, visceral organ mass, cellularity estimates and jejunal vascularity in pregnant ewe lambs, J Anim Sci 86(4), 890-901. https://doi.org/10.2527/jas.2006-839. [ Links ]
Nozière, P., Attaix, D., Bocquier, F., et al., 1999, Effect of underfeeding and refeeding on weight and cellularity of splanchnic organs in ewes, J Anim Sci 77(8), 2279-2290. https://doi.org/10.2527/1999.7782279x. [ Links ]
Pereira, V., Carbajales, P., López-Alonso, M., et al., 2018, Trace element concentrations in beef cattle related to the breed aptitude, Biol Trace Elem Res 186, 135-142. https://doi.org/10.1007/s12011-018-1276-3. [ Links ]
Puls, R., 1994, Mineral levels in animal health. Diagnostic data, (2nd ed.) Sherpa Int., Canada. [ Links ]
Reddy, J.K., Rao, M.S., 2006, Lipid metabolism and liver inflammation. II. Fatty liver disease and fatty acid oxidation, Am J Physiol Gastrointest Liver Physiol 290(5), G852-G858. https://doi.org/10.1152/ajpgi.00521.2005. [ Links ]
Reinoso, R.F., Telfer, B.A., Rowland, M., 1997, Tissue water content in rats measured by desiccation, J Pharmacol Toxicol Meth 38(2), 87-92. https://doi.org/10.1016/S1056-8719(97)00053-1. [ Links ]
Rosendo, O., McDowell, L.R., 2003, Liver dry matter and liver lipids in periparturient dairy cows, Acta Vet Brno 72(4), 541-546. https://doi.org/10.2754/avb200372040541. [ Links ]
Sainz, R.D., Bentley, B.E., 1997, Visceral organ mass and cellularity in growth-restricted and refed steers, J Anim Sci 75(5), 1229-1236. https://doi.org/10.2527/1997.7551229x. [ Links ]
Sleeman, J.M., Cristol, D.A., White, A.E., et al., 2010, Mercury poisoning in a free-living Northern River otter (Lontra canadensis), J Wildl Dis 46(3), 1035-1039. https://doi.org/10.7589/0090-3558-46.3.1035. [ Links ]
Socha, M., Torrison, J., Michael, N., 2012, Blood samples aid in assessing herd health, Feedstuffs 84(41). [ Links ]
Soto-Navarro, S.A., Lawler, T.L., Taylor, J.B., et al., 2004, Effect of high-selenium wheat on visceral organ mass, and intestinal cellularity and vascularity in finishing beef steers, J Anim Sci 82(6), 1788-1793. https://doi.org/10.2527/2004.8261788x. [ Links ]
Spears, J.W., Brandao, V.L.N., Heldt, J., 2022, Assessing trace element status in ruminants, and factors that affect measurements of trace elements, Appl Anim Sci 38(3), 252-267. https://doi.org/10.15232/aas.2021-02232. [ Links ]
Strickland, J.M., Lyman, D., Sordillo, L.M., et al., 2019, Effects of super nutritional hepatic copper accumulation on hepatocyte health and oxidative stress in dairy cows, Vet Med Int Article 3642954. https://doi.org/10.1155/2019/3642954. [ Links ]
Sullivan, J.M., Pando, K.M., Everson, R.J., et al., 1993, The effect of formalin on the concentration of selenium in porcine liver, J Vet Diagn Invest 5(1), 131-133. https://doi.org/10.1177/104063879300500134. [ Links ]
Suttle, N.F., 1988, Predicting the risk of mineral deficiencies in grazing animals, S Afr J Anim Sci 18(1), 15-22. [ Links ]
Suttle, N.F., 2010, Mineral nutrition of livestock, 4th ed. CABI Publishing, CABI International, Wallingford, Oxon OX10 8DE, UK. [ Links ]
Swanson, K.C., Reynolds, L.P., Caton, J.S., 2000, Influence of dietary intake and lasalocid on serum hormones and metabolites and visceral organ growth and morphology in wether lamb, Small Rumin Res 35, 235-247. https://doi.org/10.1016/S0921-4488(99)00092-9. [ Links ]
Tajik, H., Ramin, A., Nozad, S., et al., 2012, Relationship between liver lipid and liver dry matter in slaughtered ruminants, Vet Res Forum Autumn 3(4), 275-279. [ Links ]
Theron, P.F., Rimmer, R., Nicholls, H.A., 1974, Cause of variation in copper, iron, manganese, zinc and magnesium levels in bovine livers. 2. The dispersion of trace metals in bovine livers and the effect of formalinized storage on mineral concentrations and moisture content, J S Afr Vet Assoc 45(12), 73-76. [ Links ]
Underwood, E.J., Suttle, N.F., 1999, The mineral nutrition of livestock, 3rd ed. CABI Publishing, CABI International, Wallingford, Oxon OX10 8DE, UK. https://doi.org/10.1079/9780851991283.0000. [ Links ]
Van Ryssen, J.B.J., 1979, Aspects of the copper-molybdenum-sulphur interactions in sheep, PhD thesis, University of Natal, Pietermaritzburg, South Africa. [ Links ]
Van Ryssen, J.B.J., 1980, Estimation of liver mass in sheep, J S Afr Vet Assoc 51(1), 37-39. [ Links ]
Van Ryssen, J.B.J., 1995, Effect of different conditions in the rumen of sheep on the metabolism of selenium in the organic and inorganic form. University of Natal, Pietermaritzburg, South Africa. Report to: Biotechnology Center, Alltech Inc, Nicholasville, Kentucky, USA. [ Links ]
Van Ryssen, J.B.J., Barrowman, P.R., 1987, Effect of ionophores on the accumulation of copper in the livers of sheep, Anim Sci 44(2), 255-261. https://doi.org/10.1017/S0003356100018626. [ Links ]
Van Ryssen, J.B.J., Van Malsen, P.S.M., Hartmann, F., 1998, Contribution of dietary sulphur to the interaction between selenium and copper in sheep, J Agric Sci Camb 130(1), 107-114. https://doi.org/10.1017/S0021859697005030. [ Links ]
Vikøren, T., Kristoffersen, A.B., Lierhagen, S., et al., 2011, A comparative study of hepatic trace element levels in wild moose, roe deer, and reindeer from Norway, J Wildl Dis 47(3), 661-673. https://doi.org/10.7589/0090-3558-47.3.661. [ Links ]
Wilkinson, J.M., Hill, J., Livesey, C.T., 2001, Accumulation of potentially toxic elements in the body tissues of sheep grazed on grassland given repeated applications of sewage sludge, Anim Sci 72(1), 179-190. https://doi.org/10.1017/S1357729800055673. [ Links ]
WVDL (University of Wisconsin Veterinary Diagnostic Laboratory), 2015. www.wvdl.wisc.edu/wp-content/uploads/2013/06/WVDL.Info_Toxicology_Normal_Ranges.pdf (Cited by Kendall et al. 2015). [ Links ]
Zervas, G., Nikolaou, E., Manzios, A., 1990, Comparative study of chronic copper poisoning in lambs and young goats, Anim Prod 50(3), 497-506. https://doi.org/10.1017/S0003356100004980. [ Links ]
 Correspondence:
EC Webb
email:edward.webb@up.ac.za

