


Serviços Personalizados
Artigo
 Inglês (pdf)
 Artigo em XML
 Referências do artigo
Indicadores

Links relacionados
-
 Citado por Google
 -
 Similares em Google
Compartilhar

 Permalink
Journal of the South African Veterinary Association
versão On-line ISSN 2224-9435
versão impressa ISSN 1019-9128
J. S. Afr. Vet. Assoc. vol.93 no.2 Pretoria 2022
http://dx.doi.org/10.36303/JSAVA.163
REVIEW
Sources of error in acid-base analysis from a blood gas analyser result: a narrative review
AR KadwaI, II; JF GraceI, II; GE ZeilerI, II
IDepartment of Companion Animal Clinical Studies, Faculty of Veterinary Science, University of Pretoria, South Africa
IISection of Anaesthesia and Critical Care, Valley Farm Animal Hospital, South Africa
ABSTRACT
Preservation of blood pH within a narrow range is essential to optimal physiological function. This narrow pH range is maintained via the interactions of various buffer systems. Blood gas analysis is thus essential in the diagnosis and management of disorders affecting blood pH. Common methods of acid-base interpretation in veterinary science are the traditional approach, the physicochemical approach and the semiquantitative approach. However, blood gas analysis is prone to error during the pre-analytical, analytical and post-analytical phases of the laboratory process. The pre-analytical phase incorporates steps in obtaining the sample, thus sources of pre-analytical error are related to operator technique. Most errors occur during the pre-analytical phase. Pre-analytical errors include entrainment of air bubbles into the sample and delays between sampling and analysis, both of which cause inaccurate measurement of oxygen and carbon dioxide tensions. The analytical phase outlines processes within the analyser. Common analytical errors are related to substances confounding analyte measurements. The post-analytical phase mainly describes interpretation of the results. Some of the approaches to acid-base interpretation require extensive post-analytical calculations, thus lending themselves to error. Errors occurring during the prior phases will be amplified. Errors in the measurement of the carbon dioxide tension (from which bicarbonate concentration and base excess are calculated) will introduce error into all three methods of acid-base interpretation. Furthermore, errors occurring in the measurements of electrolytes and lactate will result in incorrect interpretations if the physicochemical and semiquantitative approaches are applied. The potential sources of error during the various phases are reviewed.
Keywords: pre-analytical phase, analytical phase, post-analytical phase, analytical errors, blood pH, Henderson-Hasselbalch, physicochemical approach, semiquantitative approach
Introduction
The body strives to maintain blood pH within a narrow range in order to optimise functioning of the cardiovascular and nervous systems as well as miscellaneous metabolic functions (Kules et al. 2015; Monnig 2013). The resultant pH is due to a complex balance between various intra- and extracellular buffer systems, plasma ion concentrations and functional interaction of the respiratory and renal systems (Hopper et al. 2014a; Hopper et al. 2014b; Monnig 2013). Thus, blood gas testing for acid-base analysis has become an indispensable tool in the management and prognostication of critically ill patients (Hopper et al. 2014a).
Requesting laboratory tests has been described as a brain-to-brain loop, commencing with the conception of requesting the test and culminating in the interpretation thereof and the resulting therapeutic interventions (Lundberg 1981). Furthermore, the laboratory process has been traditionally divided into three phases (Baird 2013). Firstly, the pre-analytical phase, which includes steps which occur prior to introducing a sample into an analyser. Secondly, the analytical phase which describes the processes within the analyser itself. Lastly, the post-analytical phase relates to steps occurring after obtaining the test result, including data management, calculation of certain variables from variables measured by the analyser and interpretation of the result (Baird 2013). Errors occurring during the laboratory process are not exclusive to blood gas testing for acid-base analysis. However, the physicochemical properties of blood gas analytes make them more prone to these errors (Baird 2013).
Clinicians making use of blood gas testing for acid-base analysis should therefore be aware of the potential errors during the laboratory process, including methods of recognising and mitigating these errors. The aim of this review is to highlight the pre-analytical, analytical and post-analytical errors that are frequently encountered when analysing acid-base status using a blood gas test result.
The data sources underpinning this review comprise original research articles, review articles, case reports, textbook chapters and clinical reference websites. These sources were found online by typing the following terms into a search engine (http://www.google.com): "blood gas errors", "pre-analytical blood gas errors", "analytical blood gas errors", "post-analytical blood gas errors". These search terms were also amended to include "veterinary", "dog", "canine", "cat", "feline", "horse", "equine", and "ruminant" in order to gain more relevant results. A search engine was used instead of traditional research databases (PubMed, Web of Science and CAB abstracts) for its ease of use as well as the wider variety of results obtained. The first page of the results was examined for journal articles and well-referenced anaesthesia and critical care resources, with a focus on veterinary-related sources. The first page of results was used only, as the relevancy of the results decreased, from the first result onward. A total of 95 discrete results were obtained using this search strategy.
Of these 95 results, 59 were used to develop the manuscript outline. Reasons for rejecting the remainder of the results were: articles not in the English language, unreferenced clinical guides and blogs, user manuals for blood gas machines and resources that were irrelevant to the subject of the manuscript. Further sources were obtained by perusing the reference lists of sources obtained using the above strategy.
Pre-analytical errors
The pre-analytical phase is arguably the most sensitive to errors. Up to 62% of errors during the laboratory process occur during this phase in human clinical pathology laboratories (Hawkins 2012).
Patient factors
Before ordering a laboratory test, it is prudent to decide whether the analysis is indicated. Discussing the indications for blood gas analysis is beyond the scope of this clinical review, however, an anaerobic arterial blood sample is considered the gold standard to assess both respiratory function and acid-base status (McCanny et al. 2012; Williams et al. 2014). Considering the technical difficulty and risk of iatrogenic complications associated with obtaining an arterial blood sample (Malatesha et al. 2007; McCanny et al. 2012; Williams et al. 2014), a venous blood sample may be sufficient to assess the carbon dioxide tension (PCO2) as well as the metabolic contributors to blood pH (Ilkiw et al. 1991; Malatesha et al. 2007; McCanny et al. 2012; Tamura et al. 2015). In this light, Ilkiw et al. (1991) and Tamura et al. (2015) compared arterial and venous blood gas analytes in conscious dogs and found good correlation between the pH, bicarbonate (HCO3-) and base excess (BE). Similarly, Kadwa et al. (2022) found good agreement between arterial and venous blood pH, HCO3-and BE, but not PCO2, in anaesthetised dogs with respiratory acidosis. Furthermore, it must be borne in mind that low-flow states (severe hypovolaemic shock with impending circulatory collapse), will significantly increase the arteriovenous PCO2 gradient, potentially resulting in a large disparity between the arterial and venous blood pH. Therefore, it is recommended that in haemodynamically unstable patients, an arterial blood sample be used to assess respiratory function and acid-base status. The arteriovenous PCO2 difference has been investigated as marker of global tissue perfusion in humans suffering septic shock and a rabbit model of haemorrhagic shock, where a difference of > 6 mmHg may be an indicator of insufficient perfusion (Vallée et al. 2008; Williams et al. 2014). It has also been investigated as marker of adequacy of cardiopulmonary resuscitation in dogs (Sato et al. 1994). Similarly, Zeiler et al. (2022), in a feline acute haemorrhage-resuscitation model, found a significant increase in the venous PCO2 in cats that underwent acute haemorrhage versus the control group. Thus, arterial and venous samples (specifically the PCO2) can be compared to assess the adequacy of resuscitative effects in shock states, however, the utility of the arteriovenous PCO2 gradient has not been completely validated in dogs.
Test over-utilisation is a common occurrence in resource-rich settings (Baird 2013), with serious consequences for patients. Lynch et al. (2016) found a moderate correlation between the number of phlebotomies performed and hospital-acquired anaemia (packed cell volume < 0.35 L/L in dogs and < 0.3 L/L in cats) in critically ill cats and dogs. When indexed to the duration of hospitalisation, patients that did not develop anaemia had a median of 1.25 phlebotomies performed per day, whereas patients that developed anaemia had a median of 1.67 phlebotomies performed per day. Additionally, patients that required blood products had a median of two phlebotomies performed per day. Furthermore, Lynch et al. (2016), also concluded that cats were more likely than dogs to develop hospital-acquired anaemia and that surgical patients were at increased risk of developing hospital-acquired anaemia as compared to medical patients. Furthermore, repeated blood gas analysis can account for up to 40% of blood loss in critically ill human patients (Andrews & Waterman 2008). It is therefore recommended that hospitalised cats and dogs do not undergo more than one phlebotomy per day, especially in cats and surgical patients, unless the results of the tests are essential to lifesaving therapeutic interventions.
Sampling and storage factors
The determination of oxygen (PO2) and carbon dioxide tensions in blood are amongst the major indications for blood gas analysis (Irizarry & Reiss 2009), with PCO2 being the only gaseous variable contributing to acid-base physiology and interpretation (Monnig 2013). The tendency of these gases within the blood to rapidly equilibrate with the tensions of their ambient counterparts gives rise to unique considerations during collection of a sample for blood gas analysis (Baird 2013; Magee 2012). Gas tight syringes are required to prevent equilibration with the environment (Baird 2013). Historically, glass syringes were used for this purpose, however, safety concerns have led to the adoption of plastic syringes (Baird 2013). It is imperative that any air bubbles entrained during the collection process be rapidly expelled as equilibration between the blood and air bubbles occurs within two minutes (Biswas et al. 1982). Typical results of samples exposed to air would be a tendency for the PO2 to approach ambient levels with a reduction in the PCO2. Consequently, less carbonic acid will be produced, leading to an increased pH, resulting in a greater binding of ionised calcium to albumin. A false hypocalcaemia may ensue (Baird 2013). Prior guidelines recommended the storage of samples on ice to prevent metabolic consumption of oxygen, however, low temperatures are hypothesised to cause contracture of the polymers in plastic syringes, making them permeable to oxygen, but not carbon dioxide (Baird 2013). Picandet et al. (2007) reported the effects of storage temperature and time to analysis on arterial blood of horses collected into plastic syringes. They concluded that the PO2 of a sample stored in iced water (0-5 °C) significantly increased (> 10 mmHg) within five minutes, compared to 20 minutes for a sample stored at ambient temperature (22-25 °C). Furthermore, they also found that PCO2 remained stable for 83 minutes when the sample was stored in a plastic syringe at ambient temperature. Therefore, a blood gas sample withdrawn into a plastic syringe should be stored at room temperature and analysis ideally performed within 10-15 minutes, if the PO2 is required (Baird 2013; Biswas et al. 1982).
Modern blood gas syringes are preloaded with lyophilised, cation-balanced heparin as an anticoagulant. Conversely, liquid heparin is a poly-anion which can bind cations within the sample. Additionally, excess liquid heparin (> 10% of the sample volume) causes dilution of analytes as well as equilibration of the partial pressures of gases within the heparin and the sample (Baird 2013; Hutchison 1983; Monnig 2013). Another important cause of analyte dilution and sample contamination is the aspiration of a sample from an indwelling vascular catheter with fluid within the line (Baird 2013). In order to limit dilution of a sample aspirated from an indwelling vascular catheter, the prior recommendation was to aspirate a waste sample (pre-sample) representing 300% of the catheter dead space, aspirate the actual sample and reinfuse the pre-sample in order to limit iatrogenic anaemia. Problems with reinfusion of the pre-sample include: infusion of blood clots, haemolysis, haemodilution, contamination of the pre-sample and accidental submission of the pre-sample (Barr et al. 2017). The push-pull technique was devised to minimise these risks. The pre-sample (300% catheter dead space volume) is aspirated and reinjected three times without disconnecting the syringe. A second syringe is then used to obtain the sample. Barr et al. (2017) compared this technique, to direct venipuncture, on venous blood gas analysis in dogs, before and after anaesthesia for elective surgeries. Samples drawn from a 20G catheter placed in a cephalic vein were compared to direct aspiration from the contralateral cephalic vein. There were statistically significant differences between the collection techniques for PCO2, BE and HCO3-, chloride, ionised calcium and potassium concentrations. However, these differences were deemed clinically irrelevant on the basis that all the values remained within their respective reference ranges for the laboratory used in the study. Furthermore, a high level of agreement between the techniques was found using Bland-Altman plots; the biases calculated from the Bland-Altman plots were small and were within the allowable limits of analytic error for clinical laboratory tests established by the American Society of Veterinary Clinical Pathologists. The push-pull technique may therefore be suitable for sampling of canine blood for blood gas analysis via an over-the-needle catheter. However, further investigation is required to determine the suitability of this technique for blood gas analysis on samples aspirated from over-the-wire catheters.
Fluctuations in the arterial PO2 during the respiratory cycle have been described in dogs, cats and lambs (Bergman 1961; Folgering et al. 1978; Purves 1966) These fluctuations are clinically irrelevant, and thus, no difference in arterial PO2 values will be observed in samples obtained at varying points in the respiratory cycle (Pfeiffer et al. 2006). However, large fluctuations of 439 mmHg (Baumgardner et al. 2002) and 283 mmHg (Pfeiffer et al. 2006) in arterial PO2 were noted between inspiration and expiration in surfactant-depleted models of lung injury in mechanically ventilated rabbits. The PO2 in these studies was continuously measured via a probe placed in the brachiocephalic artery (Baumgardner et al. 2002; Pfeiffer et al. 2006). It is theorised that the reason for these fluctuations is tidal recruitment (repetitive opening and closing of collapsed alveoli during the mechanical respiratory cycle [Tusman et al. 2015]) during inspiration (Baumgardner et al. 2002; Pfeiffer et al. 2006). Pfeiffer et al. (2006) recommend that arterial blood gas samples used to assess average oxygen delivery should be drawn over two to three respiratory cycles to obtain the mean arterial PO2. Ideally, this recommendation should also be applied in veterinary species, especially in patients suffering pulmonary diseases. However, this recommendation may only be practical in anaesthetised patients, considering the potentially fractious reaction to arterial blood sampling in veterinary species. Furthermore, it may not be possible to collect a sample over three respiratory cycles in species with low respiratory rates (horses, for example) without the sample clotting.
Haemolysis is another common cause of introduction of pre-analytical error into the laboratory process. Massive haemolysis in human blood samples can cause false elevations of intra-erythrocytic electrolytes (mainly potassium) and dilution of other electrolytes (mainly sodium and calcium), causing falsely low values (Buckley & Russel 1988; Delgardo et al. 2019; Dukic et al. 2016; Lippi et al. 2013). This error is due to the high intra-erythrocytic potassium concentration of human cells (Dugdale 2010; Leard et al. 1990), however, a false elevation in potassium does not occur in haemolysed samples of canine blood due to the significantly lower intra-erythrocytic potassium concentrations of dog erythrocytes as compared to human erythrocytes (10 mEq/L versus 155 mEq/L) (Bernadini et al. 2009; Leard et al. 1990). Nonetheless, false elevations in potassium (up to 10.9 mEq/L, reference range 3.6-6) have been described in haemolysed blood samples from Japanese dog breeds (Akita, Shiba, Jindo) and their crosses (Battison 2007). This phenomenon is thought to be as a result of a 10- to 13-fold higher concentration of intra-erythrocytic potassium concentrations in Japanese breeds as compared to other breeds (Battison 2007). Similar deviations are likely to occur with haemolysis of blood from horses, pigs and Holstein cattle, also due to their high intra-erythrocytic potassium concentrations (Battison 2007). Ionised calcium concentrations in human blood samples have been found to decline between 7% and 40% from the true values, depending on the degree of haemolysis (Buckley & Russel 1988; Lippi et al. 2013). Despite multiple studies investigating the effects of haemolysis on many analytes (Lippi et al. 2006a, Lippi et al. 2011), its effects on sodium concentrations has been poorly described (Delgardo et al. 2019). Various correction formulae for potassium (Dimeski et al. 2005) and sodium concentrations (Delgardo et al. 2019) have been described using free plasma haemoglobin as a correction factor for haemolysis. These formulae have not been described in veterinary species. Thus, the most practical solution in the face of a result that does not agree with the clinical picture would be to repeat the test, paying attention to sources of error if no other pathophysiological explanations are viable.
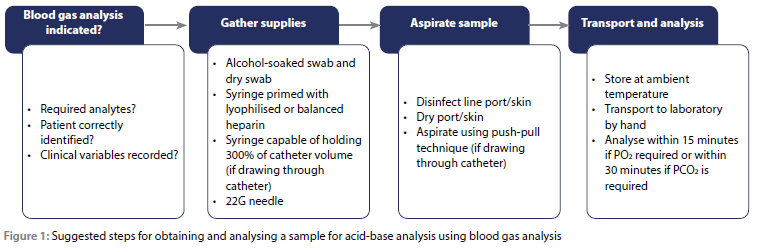
The major causes of haemolysis are thought to be aspiration of samples via narrow gauge needles and plastic intravenous catheters (Burns & Yoshikawa 2002; Lippi et al. 2006b; Sharp & Mohammad 2003). However, Sharp & Mohammad (2003) demonstrated that 18G needles produced the most and 22G needles the least haemolysis during phlebotomy. Unfortunately, Sharp and Mohammad (2003) could not provide a concrete reason for these counterintuitive results; they theorised that the samples drawn via the 18G needles may have been exposed to unknown shear stresses elsewhere in the phlebotomy apparatus. In another study, Lippi et al. (2006b) compared the influence of haemolysis on electrolytes in samples aspirated via 21G, 23G and 25G needles. They found that samples aspirated via 21G and 23G did not introduce sufficient haemolysis into the samples to interfere with sample analysis, however, samples aspirated via a 25G needle were sufficiently haemolysed to introduce an unacceptable margin of error into the analysis of calcium, chloride, potassium and sodium. Furthermore, Burns and Yoshikawa (2002) concluded that sample aspiration through a 20G plastic intravenous catheter reduces the risk for haemolysis when compared to a 22G catheter. Similarly, Kennedy et al. (1996) found a 100% haemolysis rate in samples aspirated via a 24G catheter, a 15% haemolysis rate in samples collected via a 20G catheter and a 0% haemolysis rate in samples collected via 18G and 16G catheters. In addition, excessive aspiration force during aspiration and residual alcohol-based disinfectants on the skin have been reported to cause haemolysis (Carraro et al. 2000). The World Health Organization (WHO) guidelines on drawing blood (2010) recommend thorough drying of a blood collection site after cleaning with an alcohol-based disinfectant. However, Salvango et al. (2013) and Sarmah et al. (2016) disputed the evidence behind this recommendation. In both studies, sampling was performed after skin preparation according to the WHO guidelines, these were compared to paired samples collected without drying the alcohol-based disinfectant used to clean the skin. Both Salvango et al. (2013) and Sarmah et al. (2016) concluded that not drying the skin of an alcohol-based disinfectant before sample collection does not lead to the development of haemolysis in the sample collected. Therefore, it is recommended that samples for blood gas analysis be drawn using a 22G or 23G needle or aspirated via a catheter 20G in size or larger. Excessive force should not be applied during aspiration. Figure 1 presents a suggested sequence of events for obtaining a sample for blood gas analysis.
Transport factors
Pneumatic vacuum tube systems are commonly used to transport blood samples from patient side to the laboratory in large hospital settings. These have the potential to introduce pre-analytical error by exposure of up to 15 times gravitational acceleration (147 m/s2), resulting in vigorous agitation of the sample leading to quicker gas equilibration from small air bubbles within the sample (Baird 2013). Victor Peter et al. (2011) reported deviations (increases and decreases) in arterial PO2 of up 40 mmHg when comparing paired blood gas samples transported to a laboratory by hand or a pneumatic vacuum system. Additionally, pneumatic vacuum systems have also been implicated in haemolysing samples when the acceleration within the system exceeds twice gravitational acceleration and the speed within the systems exceeds 2 m/s (Burns & Yoshikawa 2002; Mullins et al. 2016; Tiwari et al. 2012). It is thus recommended that if erroneous blood gas results are suspected, the pneumatic vacuum tube system be investigated as a potential cause. Furthermore, acceleration and speed must be considered during upgrading of existing systems or construction of new systems.
Analytical errors
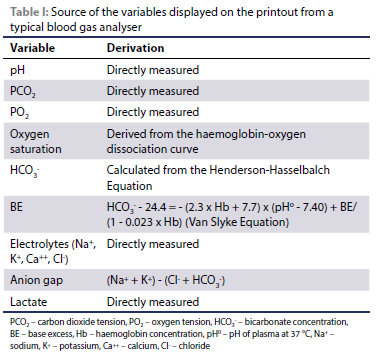
The modern blood gas analyser aspirates a presented sample into a temperature-controlled test chamber stabilised at 37 °C. The sample is then sequentially passed through a series of electrodes which directly measure the pH, PO2 and PCO2, electrolyte and lactate concentrations (Irizarry & Reiss 2009; Magee 2012). The HCO3-, BE and anion gap (AG) are derived from the measured variables by means of pre-programmed formulae and nomograms, as presented in Table I (Irizarry & Reiss 2009; Magee 2012; Siggaard-Andersen 1977). Thus, pre-analytical errors affecting the measured variables will directly affect the derived variables.
Errors occurring during the analytical phase can arise from problems within the analyser itself (poor quality control methods) or substances within the blood sample confounding analysis (such as selectivity failure of ion selective electrodes with similar ions) (Peacock & Smart 2013).
Quality control (QC) is essential for blood gas analysers as these analyses are usually performed on critically ill patients (Dukic et al. 2016). A complete discussion on QC is beyond the scope of this review. Briefly, the performance of the analyser is measured against a known standar; thus, clinicians can trust the repeatability of results reported (Dukic et al. 2016). The various electrodes have a finite lifespan and lose their accuracy over time due to deposition of blood proteins (Magee 2012). Therefore, newer analysers employ either single-use cartridges or cartridges which require replacement after 28-30 days (manufacturer dependant) (Radiometer n.d.; Abbott Point of Care n.d.; Siemens Healthineers n.d.). Moreover, these cartridges have automated QC capability which requires minimal operator input (Dukic et al. 2016).
Ionised electrolytes with similar ionisation could compete at the ion selective electrode when measuring the standard electrolytes used in acid-base analysis (Peacock & Smart 2013). These standard electrolyte ions are sodium (Na+), potassium (K+), calcium (Ca++) and chloride (Cl-) (Peacock & Smart 2013). An example of similar ions competing is that of elevated bromide concentration, which has been reported as a cause of a false hyperchloraemia in a dog which consumed potassium bromide supplemented horse feed (Peacock & Smart 2013). This phenomenon may also have theoretical implications in patients where potassium bromide is used as an anti-epileptic, especially if a gross overdose has occurred. Additionally, elevated plasma salicylate (aspirin) concentrations, especially in cases of acute intoxication, may also result in a spurious hyperchloraemia (Kashani et al. 2018). In addition to bromides and salicylates, thiocyanates (a product of cyanide metabolism) and iodides may also produce a false hyperchloraemia (Dukic et al. 2016).
In cases of ethylene glycol intoxication, a blood gas analyser may report a falsely elevated lactate level. In analysers where lactate concentration is measured by amperometry, the lactate within the sample is converted to pyruvate and hydrogen peroxide by lactate oxidase. The subsequent reduction of hydrogen peroxide produces an electrical current in proportion to the sample lactate concentration (Marwick et al. 2012). Glycolate, a product of ethylene glycol metabolism, is also a substrate for lactate oxidase, giving rise to a spuriously elevated lactate in cases of antifreeze toxicity (Marwick et al. 2012). Spectrophotometric assays using lactate dehydrogenase are not prone to this analytical error. The disparity between reported lactate levels utilising the different assay methods is known as the'lactate gap', a hallmark of ethylene glycol intoxication (Marwick et al. 2012). Lactate naturally exists in two isoforms: L-lactate and D-lactate. The L-isoform is the most abundant in mammalian blood, existing at 50 to 200 times the level of the D-isoform during homeostasis (Higgins 2011). The L-isoform predominates during pathophysiological states characterised by hypoperfusion and tissue hypoxia (type A hyperlactataemia). However, elevated L-lactate concentrations could also arise as a result of underlying disease resulting in decreased clearance, toxins and drugs interfering with oxidative phosphorylation or inborn errors of mitochondrial metabolism (type B1, B2 and B3, respectively) (Dugdale 2010; Higgins 2011; Pang & Boysen 2007). Neonatal diarrhoea in calves, D-lactic acid neurotoxicity in lambs (drunken lamb syndrome, a condition hypothesised to occur secondary to excessive ruminal or colonic fermentation) and short bowel syndrome in human beings are the only reported conditions to elevate D-lactate to clinically significant concentrations (> 3 mmol/L) (Angell et al. 2013; Lorenz et al. 2005). Both the lactate oxidase and dehydrogenase assays are specific for L-lactate; thus, a D-lactate-specific assay must be employed in cases where acidosis due to elevated D-lactate is suspected (Higgins 2011). Concerns also arise with infusions of Lactated Ringers' Solution (LRS), which usually contains a racemic mixture of lactate. However, an infusion thereof has been shown not to elevate D-lactate to clinically significant concentrations in human patients (Higgins 2011). Similarly, in healthy dogs, infusions of lactate containing fluids at clinically relevant rates, 10 ml/kg/hour for two hours or 30 ml/kg/hour for one hour had no effect on blood lactate concentrations (Muir 2017). However, a large volume of LRS (180 ml/kg over an hour) in healthy dogs was shown to significantly elevate blood lactate concentrations, likely due to lactate concentrations in excess of the metabolic capacity (Muir 2017). Furthermore, blood samples obtained from indwelling catheters improperly cleared of intravenous fluids will affect blood lactate results. Fluids which contaminate the catheter and do not contain lactate, will falsely decrease blood lactate concentrations through a dilutional effect, whereas fluids containing lactate will falsely elevate lactate concentrations (Pang & Boysen 2007). Moreover, patient restraint and struggling, especially in cats, are known to elevate blood lactate. Stress hyperglycaemia has been shown to be associated with hyperlactataemia due to struggling (Allen & Holm 2008). Thus, Allen and Holm (2008) have recommended obtaining blood glucose concentrations simultaneously with blood lactate concentrations to differentiate stress from underlying disease.
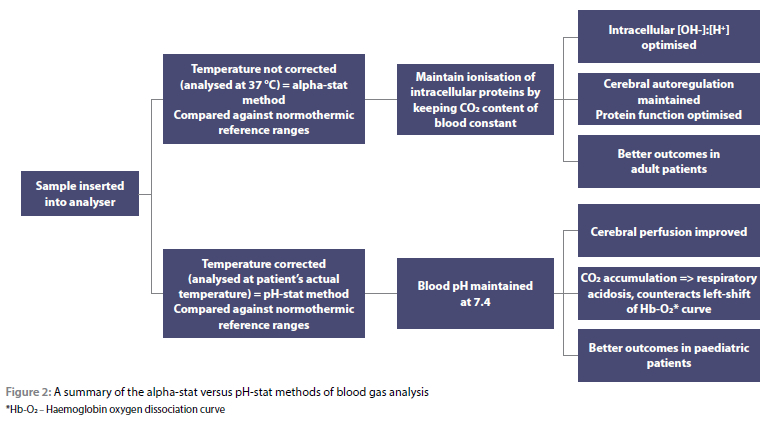
Anaesthetic and analgesic drugs inhibit thermoregulation in a dose-dependant manner which results in an increase in the body temperature interthreshold range from 0.2 °C to 4 °C (Sessler 1997). Thus, a controversial topic in both human and veterinary medicine arises - temperature correction of the blood gas results to the patient's temperature during analysis (Figure 2) (Abdul Aziz & Meduoye 2010; Brandis 2015). However, temperature correction only becomes relevant during significant deviations from physiological temperatures (> 2 °C outside the physiological range), typically, deep hypothermic cardiopulmonary bypass (Abdul Aziz & Meduoye 2010; Brandis 2015). With a decrease in temperature, solubility of gases in blood as well as the dissociation constant of water (thus the pH of neutrality) increases (Brandis 2015; Wang & Jackson 2016). Intracellular pH is maintained at the pH of neutrality with a change in temperature via the buffering capacity of the intracellular proteins (Brandis 2015). Optimal intracellular functioning occurs at a [OH-]:[H+] ratio of 16:1 (Dugdale 2010; Muir 2015). The imidazole group of the histidine residues of these proteins facilitates this ratio by maintaining its degree of ionisation (alpha) at 0.55 over a range of temperatures (Brandis 2015; Wang & Jackson 2016). However, imidazole alpha will only remain constant if the carbon dioxide content of blood is kept constant over a range of temperatures (Brandis 2015; Wang & Jackson 2016). Thus, the alpha-stat theory aims to maintain the intracellular [OH"]:[H+] ratio by keeping the imidazole alpha constant (Brandis 2015; Wang & Jackson 2016). Blood gas samples are analysed at 37 °C and interventions are instituted based against normothermic reference ranges (Dugdale 2010). Alternatively, the pH-stat theory aims to maintain blood pH at 7.4 regardless of body temperature. Blood gas samples are analysed at the patient's actual temperature and interventions are instituted based against normothermic reference ranges (Dugdale 2010). With decreases in body temperature, solubility of carbon dioxide in blood increases. Thus, ventilatory management according to the pH-stat method allows a greater accumulation of carbon dioxide at lower temperatures and therefore a respiratory acidosis ensues (Brandis 2015). Proponents of the alpha-stat theory claim that cerebral autoregulation is better maintained, whereas proponents of the pH-stat theory claim that cerebral perfusion is improved (Abdul Aziz & Meduoye 2010). Regardless, human studies into cardiopulmonary bypass have found better outcomes with the alpha-stat method in adults and the pH-stat strategy in paediatric patients (Abdul Aziz & Meduoye 2010). However, the alpha-stat method seems to be more widely accepted in human medicine (Brandis 2015).
Post-analytical errors
The post-analytical phase is the culmination of the brain-to-brain loop which commenced with the pre-analytical phase of processing a blood gas sample. Errors during this phase of the laboratory process can stem from poor data management, analyser differences and amplification of errors accrued during the pre-analytical and analytical phases (Lundberg 1981). Moreover, various schools of thought concerning the interpretation of acid-base status using blood gas tests can further augment these errors.
Ideally, clinicians should follow a hypothetico-deductive method in pursuing a diagnosis. However, clinicians may develop cognitive short-cutting strategies, especially in time-and resource-constrained environments (Croskerry 2002). These strategies are formed by clinical experience, impressions of patients, pattern recognition and prevailing socio-economic circumstances (Croskerry 2002; Gopal et al. 2021). Therefore, unfortunately, these strategies are prone to a host of cognitive biases (Croskerry 2002; Gopal et al. 2021), the scope of which is beyond this review. Briefly, blood gas analysis, which can comprise 10 or more steps in its complete interpretation, can fall prey to these biases at every step, possibly resulting in incorrect diagnoses (Croskerry 2002). Ideally, clinicians should be aware of these biases and practise debiasing strategies in order to limit the incidence of medical error (Croskerry 2002). Briefly, the debiasing strategies recommended by Croskerry (2002) are to be aware of the typical pitfalls associated with a particular process in order to better avoid them, as well as critically evaluating one's own thought processes.
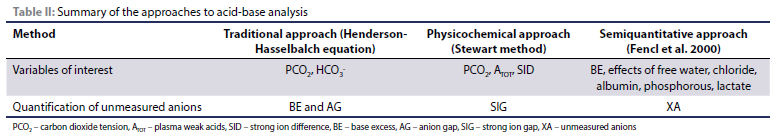
Currently, there exist several approaches to acid-base analysis and interpretation and three common veterinary methods are highlighted in Table II (Hopper et al. 2014a). The traditional approach aims to describe blood pH by its chemical relationship with HCO3- and PCO2. Carbon dioxide formed during metabolic processes combines with water to form carbonic acid, which dissociates into HCO3- and hydrogen ions, as follows (Hopkins et al. 2020):
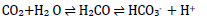
The traditional approach applies the Henderson-Hasselbalch equation to the above process to determine blood pH by its metabolic (HCO3-) and respiratory (PCO2) contributors (Chawla & Drummond 2008; Kellum 2005; Monnig 2013):
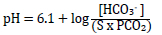
Where 'S' is the solubility co-efficient of CO2 in plasma: 0.03 mm/L/mmHg or 0.23 mm/L/kPa. PCO2 can therefore be measured in mmHg or kPa; HCO3- is measured in mmol/L or mEq/L.
Disorders in pH are classified as either primarily metabolic or respiratory in origin. If, for example, the primary disorder is respiratory in origin, then an expected metabolic compensation in an attempt to normalise blood pH should occur, and vice versa where respiratory compensation should occur if an acid-base disorder is of metabolic origin (Hopper 2014a; Irizarry & Reiss 2009; Monnig 2013). A mixed disorder may be present when the expected compensation is not present. Mixed disorders, however, can be additive (where the respiratory and non-respiratory/metabolic disturbances both alter the pH in the same direction) or off-setting (where the respiratory and non-respiratory/metabolic disturbances alter the pH in opposing directions) (Bateman 2008; Hopper 2014b; Irizarry & Reiss 2009; Monnig 2013).
The traditional approach can be further expanded by analysing the BE and AG (Hopper et al. 2014a). The BE (also known as the Actual Base Excess, ABE, or BEb, where b denotes blood), is the amount of strong acid or base that must be added to titrate 1 L of blood to a pH of 7.4 at 37 °C while the PCO2 is held constant at 40 mmHg (Bateman 2008). The BE, derived by the van Slyke equation, is used to determine the contribution of non-respiratory factors to acid-base disturbance (Hopper et al. 2014a; Monnig 2013; Siggaard-Andersen 1977). The BE defined by the van Slyke equation is accurate in in vitro calculations but inaccurate when applied in vivo due to the variations in HCO3-with changes in PCO2. The standard base excess (SBE, or BEecf, where ecf denotes extracellular fluid) was therefore developed, which incorporates the effects of haemoglobin as a buffer as well as the equilibration of HCO3- across the extracellular space (Hopper & Haskins 2008; Kellum 2005). The AG is based upon the preservation of plasma electroneutrality in order to quantify unmeasured ions which can further assist in determining the cause of a non-respiratory acid-base disturbance (Hopper et al. 2014b; Monnig 2013).
The physicochemical approach described by Stewart, aims to identify complex disturbances by analysing three independent variables: the PCO2, the strong ion difference (SID) and the total quantity of non-volatile weak acids (ATOT) (Hopper et al. 2014a). Strong ions are completely dissociated at physiological pH and the SID is the arithmetic difference between the plasma
concentrations of strong cations and anions. The ATOT considers the two main plasma weak acids: albumin and phosphate (Hopper et al. 2014a). The SID can be calculated in two ways: the apparent SID (SIDa) which considers measured cations and chloride concentrations; or the effective SID (SIDe) which considers HCO3- and ATOT. In the healthy patient, the arithmetic difference between SIDa and SIDe (the strong ion gap, SIG) is close to zero. Increases in SIG are associated with unmeasured anions (Hopper et al. 2014b). Thus, using the Stewart approach, acid-base disturbances can be described in terms of changes of the PCO2, SID and the AOT, with unmeasured anions quantified using the SIG (Torrente et al. 2014).
Lastly, the semiquantitative approach described by Fencl et al. (2000) combines the traditional and physicochemical approaches (Hopper et al. 2014a; Hopper et al. 2014b). Fencl et al. (2000) criticised the fact that the BE and AG methods do not consider the influence of non-bicarbonate buffers, namely albumin and phosphate on metabolic acid-base abnormalities. The semiquantitative approach examines the individual effects of free water, chloride, albumin, phosphorus and lactate on the BE. Using this method, unmeasured anions (XA) are quantified by the difference between the BE and sum total of the individual effects (Hopper et al. 2014a).
The major advantage of the traditional approach to blood pH analysis is its wide recognition as well as its relative simplicity of application (Monnig 2013). However, critics of the traditional approach claim that its main disadvantage is that it is descriptive, rather than offering a mechanistic explanation for changes in blood pH (Monnig 2013). Furthermore, it has been found to be too simplistic to identify complex mixed disturbances commonly found in critical patients (Hopper et al. 2014a). Moreover, Hopper et al. (2014a) criticised the traditional approach in its failure to provide a clear managemental path for critical patients.
The physicochemical and semiquantitative approaches have been found to be more effective at identifying acid-base abnormalities and quantifying unmeasured anions in dogs and cats presenting for emergency care, when compared to the traditional approach (Hopper et al. 2014a; Hopper et al. 2014b). Similarly, in horses, the physicochemical approach has been shown to be superior at detecting acid-base abnormalities resulting from electrolyte imbalances after cross-country events and gastrointestinal disorders (Gomez et al. 2013; Kirsch & Sandersen 2020; Navarro et al. 2005). The physicochemical approach has also been shown to be better at detecting acid-base disorders in cattle suffering various gastrointestinal and respiratory disorders (Garzon-Audor et al. 2020). However, these approaches require extensive post-analytical calculations and are thus prone to amplification of errors accumulated during the pre-analytical and analytical phases. Furthermore, these approaches are cumbersome and difficult to apply at the patient-side, without using computer spreadsheets (Hopper et al. 2014a; Monnig 2013). Hopper et al. (2014a) has suggested that these approaches may not improve the management of all patients and thus should only be applied to critically ill patients (Hopper et al. 2014b).
The differences in PCO2, electrolyte and albumin reference ranges for domestic species must be borne in mind, as these will influence reference ranges for variables relating to all three approaches to acid-base analysis (PCO2, AG, ATOT, SID, sum total of effects) (Dugdale 2010; Hopper et al. 2014a; Hopper et al. 2014b). The chemical characteristics of non-volatile weak acids in plasma pose an additional layer of complexity. The ATOT value for a species is directly derived from the effective dissociation constant of non-volatile weak acids in plasma (McCullough & Constable 2003). McCullough and Constable (2003) demonstrated that the effective dissociation constant of these weak acids is similar between humans, cattle and cats but significantly different in horses. Therefore, particular attention must be paid to the species at hand when acid-base analysis is carried out.
It is crucial to ensure that the results obtained are those of the patient being assessed. Some sources recommend attaching at least two patient identifiers to the blood gas syringe before submission for analysis (Dukic et al. 2016). This strategy should reduce the likelihood of confusing patient samples during analysis, especially during busy periods in the laboratory. It is also prudent to record the patient's physical condition and clinical parameters at the time of sample collection (Baird 2013) so that the results can be interpreted in context of the patient's physiology. Furthermore, understanding the patient's physiological state will assist in deciding whether to collect an arterial or venous sample. Additionally, laboratory results should be reported in a timeous manner in order to optimise patient outcomes, especially unstable patients whose condition may quickly deteriorate without rapid interventions which are based on laboratory results.
In 2016, Roels et al. compared the results of four different analysers in healthy dogs and dogs with cardiopulmonary disease. Significant differences in the pH, PO2 and PCO2 values between analysers were noted. Therefore, in institutions where analysers from more than one manufacturer are present, it is recommended that serial blood gas analyses for a patient be performed on the same analyser (Roels et al. 2016).
Conclusion
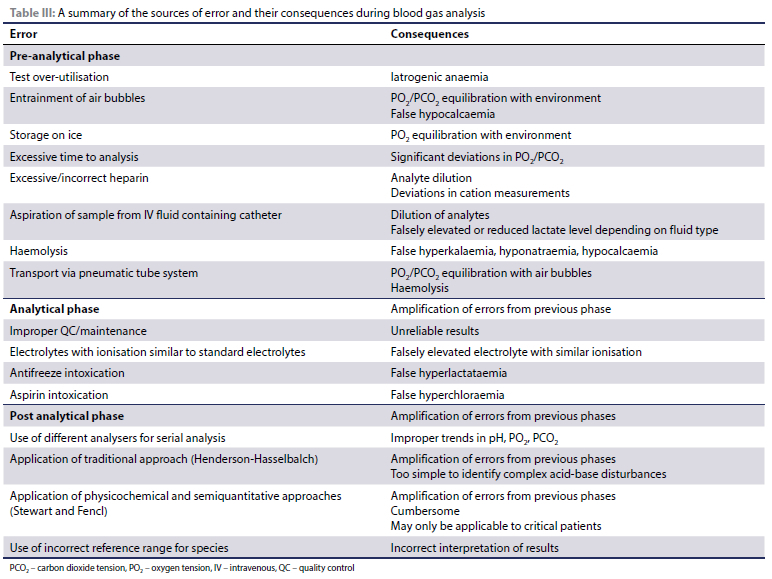
The sources of error during blood gas analysis, as summarised in Table III, are numerous. However, the majority of these errors occur during the pre-analytical phase as a direct result of human error. It is imperative that the veterinarian performing or requesting the test understands the indications for blood gas analysis, anaerobically aspirates the sample into a syringe containing an appropriate quantity of the correct anticoagulant and correctly identifies the sample. A thorough history and clinical exam as well as appropriate QC and analyser maintenance should mitigate most of the potential analytical errors. Understanding how each blood gas test variable was obtained should provide insight of the potential drawbacks of each approach to blood gas analysis.
ORCID
AR Kadwa: https://orcid.org/0000-0002-5955-2067
JF Grace: https://orcid.org/0000-0001-7534-8798
GE Zeiler: https://orcid.org/0000-0001-7653-7726
References
Abbott Point of Care n.d., i-STAT Test Cartridges Abbott Point of Care. Available from: https://www.pointofcare.abbott/int/en/offerings/istat/istat-test-cartridges. Accessed 11 May 2021. [ Links ]
Abdul Aziz, K.A. & Meduoye, A., 2010, Is pH-stat or alpha-stat the best technique to follow in patients undergoing deep hypothermic circulatory arrest?, Interact Cardiovasc Thorac Surg 10(2), 271-282. https://doi.org/10.1510/icvts.2009.214130. [ Links ]
Allen, S.E. & Holm, J.L., 2008, Lactate: physiology and clinical utility, J Vet Emerg Crit Care 18(2), 123-132. https://doi.org/10.1111/j.1476-4431.2008.00286.x. [ Links ]
Andrews, T. & Waterman, H., 2008, What factors influence arterial blood gas sampling patterns?, Nurs Crit Care 13(3), 132-137. https://doi.org/10.1111/j.1478-5153.2008.00275.x. [ Links ]
Angell, J.W., Jones, G.L., Voigt, K., et al, 2013, Successful correction of D-lactic acid neurotoxicity (drunken lamb syndrome) by bolus administration of oral sodium bicarbonate, Vet Rec 173(8), 193-193. https://doi.org/10.1136/vr.101536. [ Links ]
Baird, G., 2013, Preanalytical considerations in blood gas analysis, Biochem Med 23(1), 19-27. https://doi.org/10.11613/BM.2013.005. [ Links ]
Barr, C.A., Gianotti, G., Graffeo, C.E., et al., 2017, Effect of blood collection by the push-pull technique from an indwelling catheter versus direct venipuncture on venous blood gas values before and after administration of alfaxalone or propofol in dogs, J Am Vet Med Assoc 251(10), 1166-1174. https://doi.org/10.2460/javma.251.10.1166. [ Links ]
Bateman S.W., 2008, Making sense of blood gas results, Vet Clin North Am Small Anim Pract 38(3), 543-557. https://doi.org/10.1016/j.cvsm.2008.01.002. [ Links ]
Battison A., 2007, Apparent pseudohyperkalemia in a Chinese Shar Pei dog, Vet Clin Pathol 36(1), 89-93. https://doi.org/10.1111/j.1939-165X.2007.tb00188.x. [ Links ]
Baumgardner, J.E., Markstaller, K., Pfeiffer, B., et al., 2002, Effects of respiratory rate, plateau pressure, and positive end-expiratory pressure on PaO2 oscillations after saline lavage, Am J Respir Crit Care Med 166(12 Pt 1), 1556-1562. https://doi.org/10.1164/rccm.200207-717OC. [ Links ]
Bergman N.A., 1961, Cyclic variations in blood oxygenation with the respiratory cycle, Anesthesiology 22, 900-908. https://doi.org/10.1097/00000542-196111000-00006. [ Links ]
Bernardini, D., Gerardi, G., Contiero, B., et al., 2009, Interference of haemolysis and hyperproteinemia on sodium, potassium, and chloride measurements in canine serum samples, Vet Res Commun 33(Suppl 1), 173-176. https://doi.org/10.1007/s11259-009-9280-x. [ Links ]
Biswas, C.K., Ramos, J.M., Agroyannis, B., et al., 1982, Blood gas analysis: effect of air bubbles in syringe and delay in estimation, Br Med J (Clin Res Ed) 284(6320), 923-927. https://doi.org/10.1136/bmj.284.6320.923. [ Links ]
Brandis, K., 2015, Acid-Base Physiology, Anaesthesia Education Website, Available from: from http://www.anaesthesiamcq.com/AcidBaseBook/ABindex.php. Accessed 8 May 2021. [ Links ]
Buckley, B.M. & Russell, L.J., 1988, The measurement of ionised calcium in blood plasma, Ann Clin Biochem 25(5), 447-465. https://doi.org/10.1177/000456328802500501. [ Links ]
Burns, E.R. & Yoshikawa, N., 2002, Hemolysis in serum samples drawn by emergency department personnel versus laboratory phlebotomists, Lab Med 33(5), 378-380. https://doi.org/10.1309/PGM4-4F8L-2P1M-LKPB. [ Links ]
Carraro, P., Servidio, G., Plebani, M., 2000, Hemolyzed specimens: a reason for rejection or a clinical challenge?, Clin Chem 46(2), 306-307. https://doi.org/10.1093/clinchem/46.2.306. [ Links ]
Chawla, G. & Drummond, G., 2008, Water, strong ions, and weak ions, Continuing Education in Anaesthesia Critical Care & Pain 8(3), 108-112. https://doi.org/10.1093/bjaceaccp/mkn017. [ Links ]
Croskerry P., 2002, Achieving quality in clinical decision making: cognitive strategies and detection of bias, Acad Emerg Med 9(11), 1184-1204. https://doi.org/10.1111/j.1553-2712.2002.tb01574.x. [ Links ]
Delgado, J.A., Morell-Garcia, D., Bauça, J.M., 2019, Hemolysis Interference Studies: The Particular Case of Sodium Ion, EJIFCC 30(1), 25-34. [ Links ]
Dimeski, G., Clague, A.E., Hickman, P.E., 2005, Correction and reporting of potassium results in haemolysed samples, Ann Clin Biochem 42(2), 119-123. https://doi.org/10.1258/0004563053492739. [ Links ]
Dugdale, A., 2010, Veterinary Anaesthesia Principles to Practice, Blackwell, Oxford. [ Links ]
Dukic, L., Kopcinovic, L.M., Dorotic, A., et al., 2016, Blood gas testing and related measurements: National recommendations on behalf of the Croatian Society of Medical Biochemistry and Laboratory Medicine, Biochem Med 26(3), 318-336. https://doi.org/10.11613/BM.2016.036. [ Links ]
Fencl, V., Jabor, A., Kazda, A., et al., 2000, Diagnosis of metabolic acid-base disturbances in critically ill patients, Am J Respir Crit Care Med 162(6), 2246-2251. https://doi.org/10.1164/ajrccm.162.6.9904099. [ Links ]
Folgering, H., Smolders, F.D., Kreuzer, F., 1978, Respiratory oscillations of the arterial PO2 and their effects on the ventilatory controlling system in the cat, Pflugers Arch 375(1), 1-7. https://doi.org/10.1007/BF00584141. [ Links ]
Garzon-Audor, A., Oliver-Espinosa, O., Castaneda-Salazar, R. 2020, Acid base disorders in hospitalized cattle, Brazilian Journal of Veterinary Research and Animal Science 57(1), e159837. https://doi.org/10.11606/issn.1678-4456.bjvras.2020.159837. [ Links ]
Gomez, D.E., Arroyo, L.G., Stampfli, H.R., et al., 2013, Physicochemical interpretation of acid-base abnormalities in 54 adult horses with acute severe colitis and diarrhea, J Vet Intern Med 27(3), 548-553. https://doi.org/10.1111/jvim.12071. [ Links ]
Gopal, D.P., Chetty, U., O'Donnell, P., et al., 2021, Implicit bias in healthcare: clinical practice, research and decision making, Future Healthc J 8(1), 40-48. https://doi.org/10.7861/fhj.2020-0233. [ Links ]
Hawkins, R., 2012, Managing the pre- and post-analytical phases of the total testing process, Ann Lab Med 32(1), 5-16. https://doi.org/10.3343/alm.2012.32.L5. [ Links ]
Higgins, C., 2011, L-lactate and D-lactate - clinical significance of the difference, in acutecaretesting.org, Available from: https://acutecaretesting.org/en/articles/l-lactate-and-d-lactate-clinical-significance-of-the-difference/. Accessed 11 May 2021. [ Links ]
Hopkins, E., Sanvictores, T., Sharma S., 2020, Physiology, Acid Base Balance in: StatPearls, Available from: https://www.ncbi.nlm.nih.gov/books/NBK507807/. Accessed 11 May 2021. [ Links ]
Hopper, K., Epstein, S.E., Kass, P.H., et al., 2014a, Evaluation of acid-base disorders in dogs and cats presenting to an emergency room. Part 1: comparison of three methods of acid-base analysis. J Vet Emerg Crit Care 4(5), 493-501. https://doi.org/10.1111/vec.12215. [ Links ]
Hopper, K., Epstein, S.E., Kass, P.H., et al., 2014b, Evaluation of acid-base disorders in dogs and cats presenting to an emergency room. Part 2: comparison of anion gap, strong ion gap, and semiquantitative analysis, J Vet Emerg Crit Care 24(5), 502-508. https://doi.org/10.1111/vec.12214. [ Links ]
Hopper, K. & Haskins, S.C., 2008, A case-based review of a simplified quantitative approach to acid-base analysis, J Vet Emerg Crit Care 18(5), 467-476. https://doi.org/10.1111/j.1476-4431.2008.00344.x. [ Links ]
Hutchison, A.S., Ralston, S.H., Dryburgh, F.J., et al., 1983, Too much heparin: possible source of error in blood gas analysis, Br Med J (Clin Res Ed) 287(6399), 1131-1132. https://doi.org/10.1136/bmj.287.6399.1131. [ Links ]
Ilkiw, J.E., Rose, R.J., Martin, I.C., 1991, A comparison of simultaneously collected arterial, mixed venous, jugular venous and cephalic venous blood samples in the assessment of blood-gas and acid-base status in the dog, J Vet Intern Med 5(5), 294-298. https://doi.org/10.1111/j.1939-1676.1991.tb03136.x. [ Links ]
Irizarry, R. & Reiss, A., 2009, Arterial and venous blood gases: indications, interpretations, and clinical applications, Compend Contin Educ Vet 31(10), E1-E7. [ Links ]
Kadwa, A.R., Boustead, KJ. Zeiler, G.E., 2022 Agreement between arterial and central venous blood pH and its contributing variables in anaesthetized dogs with respiratory acidosis, Vet Anaesth Analg 49(3), 299-303. https://doi.org/10.1016/j.vaa.2022.02.001. [ Links ]
Kashani, K.B., Steuernagle IV, J.H., Qian, Q., 2018, Spurious hyperchloremia in the presence of elevated plasma salicylate: A cohort study, Nephron 138(3), 186-191. https://doi.org/10.1159/000484636. [ Links ]
Kellum, J.A., 2005, Clinical review: reunification of acid-base physiology, Crit Care 9(5), 500-507. https://doi.org/10.1186/cc3789. [ Links ]
Kennedy, C., Angermuller, S., King, R., et al., 1996, A comparison of hemolysis rates using intravenous catheters versus venipuncture tubes for obtaining blood samples, J Emerg Nurs 22(6), 566-569. https://doi.org/10.1016/S0099-1767(96)80213-3. [ Links ]
Kirsch, K. & Sandersen, C., 2020, Traditional and quantitative analysis of acid-base and electrolyte imbalances in horses competing in cross-country competitions at 2-star to 5-star level, J Vet Intern Med 34(2), 909-921. https://doi.org/10.1111/jvim.15708. [ Links ]
Kules, J., Brkljacic, M., Crnogaj, M., et al., 2015, Arterial blood acid-base and electrolyte values in dogs: conventional and "strong ion" approach, Veterinarski Arhiv 85(5), 533-545. [ Links ]
Leard, B.L., Alsaker, R.D., Porter, W.P., et al., 1990, The effect of haemolysis on certain canine serum chemistry parameters, Lab Anim 24(1), 32-35. https://doi.org/10.1258/002367790780890239. [ Links ]
Lippi, G., Avanzini, P., Pavesi, F., et al., 2011, Studies on in vitro hemolysis and utility of corrective formulas for reporting results on hemolyzed specimens. Biochem Med 21(3), 297-305. https://doi.org/10.11613/BM.2011.040. [ Links ]
Lippi, G., Fontana, R., Avanzini, P., et al., 2013, Influence of spurious hemolysis on blood gas analysis, Clin Chem Lab Med 51(8), 1651-1654. https://doi.org/10.1515/cclm-2012-0802. [ Links ]
Lippi, G., Salvagno, G.L., Montagnana, M., et al., 2006a, Influence of hemolysis on routine clinical chemistry testing, Clin Chem Lab Med 44(3), 311-316. https://doi.org/10.1515/CCLM.2006.054. [ Links ]
Lippi, G., Salvagno, G.L., Montagnana, M., et al., 2006b, Influence of the needle bore size used for collecting venous blood samples on routine clinical chemistry testing, Clin Chem Lab Med 44(8). https://doi.org/10.1515/CCLM.2006.172. [ Links ]
Lorenz, I., Gentile, A. & Klee, W., 2005, Investigations of D-lactate metabolism and the clinical signs of D-lactataemia in calves, Vet Rec 156(13), 412-415. https://doi.org/10.1136/vr.156.13.412. [ Links ]
Lundberg, G.D., 1981, Acting on significant laboratory results, JAMA 245(17):1762-1763. https://doi.org/10.1001/jama.1981.03310420052033. [ Links ]
Lynch, A.M., Respess, M., Boll, A.E., et al., 2016, Hospital-acquired anemia in critically ill dogs and cats: A multi-institutional study, J Vet Intern Med 30(1), 141-146. https://doi.org/10.1111/jvim.13650. [ Links ]
Magee, P.T., 2012, Physiological monitoring: gasses, in A.J. Davey & A. Diba (eds), Ward's Anaesthetic Equipment, 6th edn, pp. 337-350, Saunders Elsevier, UK. https://doi.org/10.1016/B978-0-7020-3094-9.00015-2. [ Links ]
Malatesha, G., Singh, N.K., Bharija, A., et al., 2007, Comparison of arterial and venous pH, bicarbonate, PCO2 and PO2 in initial emergency department assessment, Emerg Med J 24(8), 569-571. https://doi.org/10.1136/emj.2007.046979. [ Links ]
Marwick, J., Elledge, R.O.C., Burtenshaw, A., 2012, Ethylene glycol poisoning and the lactate gap, Anaesthesia 67(3), 299. https://doi.org/10.1111/j.1365-2044.2012.07067.x. [ Links ]
McCanny, P., Bennett, K., Staunton, P., et al., 2012, Venous vs arterial blood gases in the assessment of patients presenting with an exacerbation of chronic obstructive pulmonary disease, Am J Emerg Med 30(6), 896-900. https://doi.org/10.1016/j.ajem.2011.06.011. [ Links ]
McCullough, S.M. & Constable, P.D., 2003, Calculation of the total plasma concentration of nonvolatile weak acids and the effective dissociation constant of nonvolatile buffers in plasma for use in the strong ion approach to acid-base balance in cats, Am J Vet Res 64(8), 1047-1051. https://doi.org/10.2460/ajvr.2003.64.1047. [ Links ]
Monnig A.A., 2013, Practical acid-base in veterinary patients, Vet Clin North Am Small Anim Pract 43(6), 1273-1286. https://doi.org/10.1016/j.cvsm.2013.07.009. [ Links ]
Muir, W., 2017, Effect of intravenously administered crystalloid solutions on acid-base balance in domestic animals, J Vet Intern Med 31(5), 1371-1381. https://doi.org/10.1111/jvim.14803. [ Links ]
Muir, W.W., 2015, Acid-base Physiology, in K.A. Grimm, L.A. Lamont, W.J. Tranquilli, S.A. Greene & S.A. Robertson (eds), Veterinary Anesthesia and Analgesia, 5th edn, pp. 357-371, John Wiley & Sons, Inc., USA. [ Links ]
Mullins, G.R., Harrison, J.H., Bruns, D.E., 2016, Smartphone monitoring of pneumatic tube system-induced sample hemolysis, Clin Chim Acta 462, 1-5. https://doi.org/10.1016/j.cca.2016.08.011. [ Links ]
Navarro, M., Monreal, L., Segura, D., et al., 2005, A comparison of traditional and quantitative analysis of acid-base and electrolyte imbalances in horses with gastrointestinal disorders, J Vet Intern Med 19(6), 871-877. https://doi.org/10.1111/j.1939-1676.2005.tb02780.x. [ Links ]
Pang, D.S. & Boysen, S., 2007, Lactate in veterinary critical care: pathophysiology and management, J Am Anim Hosp Assoc 43(5), 270-279. https://doi.org/10.5326/0430270. [ Links ]
Peacock, R.E. & Smart, L., 2013, False hyperchloraemia in a dog secondary to ingestion of horse feed supplemented with potassium bromide, Aust Vet J 91(8), 320-322. https://doi.org/10.1111/avj.12079. [ Links ]
Pfeiffer, B., Syring, R.S., Markstaller, K., et al., 2006, The implications of arterial Po2 oscillations for conventional arterial blood gas analysis, Anesth Analg 102(6), 1758-1764. https://doi.org/10.1213/01.ane.0000208966.24695.30. [ Links ]
Picandet, V., Jeanneret, S., Lavoie, J.P., 2007, Effects of syringe type and storage temperature on results of blood gas analysis in arterial blood of horses, J Vet Intern Med21(3), 476-481. https://doi.org/10.1111/j.1939-1676.2007.tb02993.x. [ Links ]
Purves, M.J., 1966, Fluctuations of arterial oxygen tension which have the same period as respiration, Respir Physiol 1(3), 281-296. https://doi.org/10.1016/0034-5687(66)90047-8. [ Links ]
Radiometer, n.d., Blood gas analyzer - ABL90 FLEX - Radiometer, Available from: https://www.radiometer.com/en/products/blood-gas-testing/abl90-flex-blood-gas-analyzer. Accessed 11 May 2021. [ Links ]
Roels, E., Gommeren, K., Farnir, F., et al., 2016, Comparison of 4 point-of-care blood gas analyzers for arterial blood gas analysis in healthy dogs and dogs with cardiopulmonary disease, J Vet Emerg Crit Care 26(3), 352-359. https://doi.org/10.1111/vec.12469. [ Links ]
Salvagno, G.L., Danese, E., Lima-Oliveira, G., et al., 2013, Avoidance to wipe alcohol before venipuncture is not a source of spurious hemolysis, Biochem Med 23(2), 201-205. https://doi.org/10.11613/BM.2013.023. [ Links ]
Sarmah, D., Sharma, B., Sharma, D., et al., 2016, Alcohol used as disinfectant before venipuncture does not lead to sample haemolysis or sample dilution, J Clin Diagn Res 10(2), BC16-BC18. https://doi.org/10.7860/JCDR/2016/15967.7245. [ Links ]
Sato, S., Okubo, N., Satsumae, T., et al., 1994, Arteriovenous differences in PCO2 and cardiac output during CPR in the dog, Resuscitation 27(3), 255-259. https://doi.org/10.1016/0300-9572(94)90039-6. [ Links ]
Sessler D.I., 1997, Mild perioperative hypothermia, N Engl J Med 336(24), 1730-1737. https://doi.org/10.1056/NEJM199706123362407. [ Links ]
Sharp, M.K. & Mohammad, S.F., 2003, Hemolysis in needleless connectors for phlebotomy, ASAIO J 49(1), 128-130. https://doi.org/10.1097/00002480-200301000-00021. [ Links ]
Siemens Healthineers n.d., RAPIDPoint 500 Systems, Available from: from https://www.siemens-healthineers.com/blood-gas/blood-gas-systems/rapidpoint-500-systems. Accessed 11 May 2021. [ Links ]
Siggaard-Andersen, O., 1977, The van Slyke equation, Scand J Clin Lab Invest Suppl 146, 15-20. https://doi.org/10.3109/00365517709098927. [ Links ]
Tamura, J., Itami, T., Ishizuka, T., et al., 2015, Central venous blood gas and acid-base status in conscious dogs and cats, J Vet Med Sci 77(7), 865-869. https://doi.org/10.1292/jvms.14-0503. [ Links ]
Tiwari, A.K., Pandey, P., Dixit, S., et al., 2012, Speed of sample transportation by a pneumatic tube system can influence the degree of hemolysis, Clin Chem Lab Med 50(3), 471-474. https://doi.org/10.1515/cclm.2011.779. [ Links ]
Torrente, C., Manzanilla, E.G., De Gopegui, R.R., 2014, A comparison of traditional and quantitative analysis of acid-base imbalances in hypoalbuminemic dogs, J Vet Emerg Crit Care 24(5), 509-518. https://doi.org/10.1111/vec.12218. [ Links ]
Tusman, G., Acosta, C.M., Nicola, M., et al., 2015, Real-time images of tidal recruitment using lung ultrasound, Crit Ultrasound J 7(1), 19. https://doi.org/10.1186/s13089-015-0036-2. [ Links ]
Vallée, F., Vallet, B., Mathe, O., et al., 2008, Central venous-to-arterial carbon dioxide difference: an additional target for goal-directed therapy in septic shock? Intensive Care Med 34(12), 2218-2225. https://doi.org/10.1007/s00134-008-1199-0. [ Links ]
Victor Peter, J., Patole, S., Fleming, J.J., et al., 2011, Agreement between paired blood gas values in samples transported either by a pneumatic system or by human courier. Clin Chem Lab Med 49(8), 1303-1309. https://doi.org/10.1515/CCLM.2011.611. [ Links ]
Wang, T. & Jackson, D.C. 2016, How and why pH changes with body temperature: the a-stat hypothesis, J Exp Biol 219(8), 1090-1092. https://doi.org/10.1242/jeb.139220. [ Links ]
World Health Organization, 2010, WHO guidelines on drawing blood, Available from: http://whqlibdoc.who.int/publications/2010/9789241599221_eng.pdf. Accessed 20 Aug 2021. [ Links ]
Williams, K.B., Christmas, A.B., Heniford, B.T., et al., 2014, Arterial vs venous blood gas differences during hemorrhagic shock, World J Crit Care Med 3(2), 55-60. https://doi.org/10.5492/wjccm.v3.i2.55. [ Links ]
Zeiler, G.E., Fuller, A., Kamerman, P., et al., 2022, Describing acid-base balance using three different methods of analysis in a feline acute haemorrhage-resuscitation model, Vet Anaesth Analg 49(1), 65-75. https://doi.org/10.1016/j.vaa.2021.07.004. [ Links ]
 Correspondence:
AR Kadwa
Email: abdur.kadwa@up.ac.za

