


Serviços Personalizados
Artigo
 Inglês (pdf)
 Artigo em XML
 Referências do artigo
Indicadores

Links relacionados
-
 Citado por Google
 -
 Similares em Google
Compartilhar

 Permalink
Journal of the South African Veterinary Association
versão On-line ISSN 2224-9435
versão impressa ISSN 1019-9128
J. S. Afr. Vet. Assoc. vol.84 no.1 Pretoria Jan. 2013
ORIGINAL RESEARCH
The comparison of bolus tracking and test bolus techniques for computed tomography thoracic angiography in healthy beagles
Nicolette CasselI; Ann CarstensI; Pieter BeckerII
ISection Diagnostic Imaging, Department of Companion Animal Clinical Studies, Faculty of Veterinary Science, University of Pretoria, South Africa
IIMedical Research Council of South Africa, Biostatistics Unit, South Africa
ABSTRACT
Computed tomography thoracic angiography studies were performed on five adult beagles using the bolus tracking (BT) technique and the test bolus (TB) technique, which were performed at least two weeks apart. For the BT technique, 2 mL/kg of 300 mgl/mL iodinated contrast agent was injected intravenously. Scans were initiated when the contrast in the aorta reached 150 Hounsfield units (HU). For the TB technique, the dogs received a test dose of 15% of 2 mL/kg of 300 mgI/mL iodinated contrast agent, followed by a series of low dose sequential scans. The full dose of the contrast agent was then administered and the scans were conducted at optimal times as identified from time attenuation curves. Mean attenuation in HU was measured in the aorta (Ao) and right caudal pulmonary artery (rCPA). Additional observations included the study duration, milliAmpere (mA), computed tomography dose index volume (CTDI[vol]) and dose length product (DLP). The attenuation in the Ao (BT = 660 52 HU ± 138 49 HU, TB = 469 82 HU ± 199 52 HU, p = 0.13) and in the rCPA (BT = 606 34 HU ± 143 37 HU, TB = 413 72 HU ± 174.99 HU, p = 0.28) did not differ significantly between the two techniques. The BT technique was conducted in a significantly shorter time period than the TB technique (p = 0.03). The mean mA for the BT technique was significantly lower than the TB technique (p = 0.03), as was the mean CTDI(vol) (p = 0.001). The mean DLP did not differ significantly between the two techniques (p = 0.17). No preference was given to either technique when evaluating the Ao or rCPA but the BT technique was shown to be shorter in duration and resulted in less DLP than the TB technique.
Introduction
Thoracic computed tomography (CT) is a well established and increasingly important imaging procedure in human and veterinary medicine. Computed tomography is superior to conventional radiography of the thorax as it eliminates superimposition and demonstrates enhanced resolution, thus detects subtle changes in organ size, shape, margins, contours and position (Rivero et al. 2009). Except for some of the smaller vessels, nerves and details of the heart, most of the osseous, visceral and vascular structures of the dog thorax can be identified and described (Cardoso et al. 2007; De Rycke et al. 2005). Computed tomography angiography (CTA) analyses imaging data that is acquired during the first pass of a bolus of contrast medium. Proper selection of acquisition timing is thus critical in order to optimise contrast medium enhancement (Bae 2003). When performing any intravenous contrast study there are several factors that need to be taken into account: physico-chemical factors (such as concentration of the contrast medium); technical factors (such as injection duration and rate); and patient factors, with body weight cited as the most important factor affecting the amount of aortic enhancement (Bae 2008). The variability introduced by patient factors is overcome in CTA by the application of either a bolus tracking (BT) or a test bolus (TB) technique.
For the BT technique, a circular or rectangular region of interest (ROI) with a desired Hounsfield unit (HU) is placed in a blood vessel of interest related to the study, such as the aorta. The computer detects vessel opacification by contrast medium within this ROI during real-time monitoring of the main bolus during injection. This is done by means of the acquisition of a series of low-dose sequential scans at a specific level containing the ROI in the vessel of interest. The scan is initiated automatically when the desired HU in the ROI is met. One study has shown that the BT technique (when compared with the TB technique) has better synchronisation between the scanning and contrast medium enhancement, with a more homogenous and steady enhancement for coronary angiography (Cademarriti et al. 2005). This technique has been shown to require a shorter scan time (and hence reduced radiation exposure) with up to 20% less contrast medium being used. A recent study on pulmonary angiography in beagles has shown no advantage in using the TB technique above the BT technique, but a limitation to this study was that only one patient had both techniques performed and compared (Habing et al. 2011). Various factors can affect the outcome of the BT technique; should the ROI be inaccurately positioned, then erroneous monitoring may lead to either the desired HU never being reached in the vessel, or if the ROI is placed in such a manner that part of the area of the ROI includes the vessel wall, the desired HU may be artifactually reached earlier than it actually should. These scenarios can result in a suboptimal CTA scan. If the patient moves during the monitoring scans, the ROI may move out of the vessel of interest and an unsuccessful scan may result. However, by monitoring the procedure, should the scan not trigger automatically the main scan can be started manually.
Factors to bear in mind when using the BT technique include the transition delay (delay between the time at which the threshold is reached and the start of the actual CT scan) and the inter-scan delay (time between the consecutive dynamic scans). Both delays are variable, depending on the machine used, but it has been reported than even machines from the same vendors can have different delays (Henzler et al. 2012). The BT technique has been reported to be particularly beneficial for patients with right heart failure or pulmonary hypertension due to the delayed passage of contrast through the pulmonary vessels in such conditions (Roggenland et al. 2008). BT techniques are preferred for CT angiography in children, this is due to the various patient factors that can affect the timing of the application of empirical scan delays, such as varying body weight and cardiac output (Frush 2005). For the TB technique, a low dose of the contrast medium (usually 15% - 20% of the total dose of the contrast medium) is injected and low radiation dose, single-slice, sequential images are obtained at a slice containing the vessel of interest. This is to allow for evaluation of vascular contrast medium enhancement over time. Time attenuation curves are then generated and the contrast medium arrival time and time of maximal enhancement of the vessel are determined (Cademartiri et al. 2002). From these curves, the time delays between the start of contrast medium injection and initiation of the scan are calculated automatically (Cademartiri et al. 2002; Cademartiri et al. 2005; Zwingenberger et al. 2004). This method has a significant advantage because it is specifically adapted to the patient being examined and the variability of the BT technique is therefore removed. The technique has been advocated for use in human patients with compromised cardiac function or in debilitated patients (Sheiman et al. 1996). A study in 1995 concluded that the injection of a test bolus improved the timing of spiral CT acquisition in human patients when evaluating the enhancement in the aorta (van Hoe et al. 1995). When evaluating smaller vessels, the TB technique is preferred over other CTA techniques (Sheiman et al. 1996). The disadvantages of the TB technique are increased scan time, radiation exposure, anaesthetic time and contrast medium dose.
Although there are several human studies comparing the BT and TB techniques (Henzler et al. 2012; Cademartiri et al. 2004; Itoh et al. 2004; Kim et al. 2006; Mehnert et al. 2001), there are no such veterinary studies. Therefore, the purpose of this study was to compare the attenuation (in HU) in the aorta (Ao) and right caudal pulmonary artery (rCPA) following thoracic CTA using the BT and the TB techniques. Additional parameters that were evaluated included the subjective visualisation of the smaller thoracic arteries, the procedural duration of the studies, the milliAmpere (mA), the computed tomography dose index (volume) (CTDI (vol)) and the dose length product (DLP).
Materials and methods
Animals
Five adult purpose-bred research beagles (median age = 38 months, median weight = 15.05 kg) were used for the study. There were three spayed females and two castrated males. They were deemed to be healthy and eligible for the study based on normal physical examination, full blood count, serum chemistry analysis, blood pressure evaluation, urinalysis, thoracic radiography and abdominal ultrasound.
Each animal underwent both the BT CTA and the TB CTA. The animals were randomly assigned and divided into two groups by pulling the number of the dog 1 - dog 5 out of a hat. Group 1 received the TB technique first, followed at least two weeks later by the BT technique. Group 2 had the studies conducted in the reverse order.
A 20-gauge intravenous catheter was placed in the cephalic vein of either the left or right thoracic limb and secured with tape. Patients were placed in sternal recumbency on the CT table, this was to prevent dependant lung hypostasis and to minimise excessive motion artifacts during scanning.
The patients were premedicated with 0.2 mg/kg diazepam (Pax®, Pharmcare limited, Woodmead, Sandton, South Africa) and anaesthesia was induced with Propofol 1% (Fresenius Kabi SA (Pty) Ltd, Stand 7, Growthpoint Park 2 Tonetti Street, Halfway House, Midrand, South Africa) at 5.5 mg/kg i/v to effect. Anaesthesia was maintained with isoflurane (Forane® liquid, Abbott Laboratories Pty Ltd., Constantia Kloof, Roodepoort, South Africa) in 100% oxygen. During various stages of the CTAs, positive pressure ventilation with breath holding techniques, by means of manual rebreathing bag compression, were employed to eliminate motion artifacts.
Survey CT scan
A dorsal survey helical topogram was performed on all animals, from the level of the thoracic inlet to the furthest caudal extent of the diaphragm, in a cranio-caudal direction using a dual-slice 6th generation Siemens Emotion duo CT scanner with sliding gantry (Siemens South Africa, 300 Janadel Avenue, Halfway House, Midrand, 1685). A collimated helical scan was also performed from the level of the seventh cervical vertebra to the level of the second lumbar vertebra in a caudal to cranial direction. Collimation was set at 2.5 mm with a slice thickness of 3.0 mm. A kilovoltage of 130, mA of 24 and a pitch of 1.65 was used. Images from the survey scan were assessed for any pathology or abnormalities not noted during the thoracic radiographic examination.
Bolus tracking technique
For the BT technique, a slice from the pre-contrast scan was chosen that contained the Ao and rCPA on a single slice. A ROI was placed in the lumen of the aorta at this level, approximately at the level of the eighth thoracic vertebra. The ROI occupied approximately ¾ of the internal diameter of the vessel and was placed clear of the vessel wall. This was done to prevent possible movement of the ROI out of the lumen during respiratory movement. The scan range and scan parameters used for the systemic arterial phase CTAs were planned using this survey pre-contrast scan. A threshold of 150 HU was set in the ROI. This level of contrast medium attenuation was selected based on literature reports deeming this level to be diagnostic (Habing et al. 2011). The patients then received a 2 mL/kg bolus dose of 300 mgI/mL Iohexol (OmnipaqueTM, GE Healthcare Pty Ltd., Weltevreden Park, South Africa, 1709), which was administered with a pressure injector set to inject at a rate of 3 mL/s. A manual saline chaser of 1 mL/kg immediately followed this. The contrast medium injection was started at the same time as the pre-monitoring phase. During the pre-monitoring phase, low dose sequential scans were performed at the pre-selected level. By means of an inherent software program, a near-instantaneous time attenuation curve was generated. When contrast medium reached the desired 150 HU, the machine automatically triggered the start of the angiographic scan of the arterial phase. The scan direction of caudal to cranial was chosen so as to limit motion artifacts from diaphragmatic movement. The scan was conducted from the level of the tenth thoracic vertebra to the cervical inlet. This range was chosen as the blood vessels of interest (Ao and rCPA and cranial thoracic arteries) were expected to lie within this scan range. If it was noted that the attenuation in the Ao was rising to a subjectively adequate level of attenuation without automatic triggering the scan, it was triggered manually. Scan parameters for the systemic arterial phase were the same as for the pre-contrast survey helical scan. The kilovoltage ranged from 110 to 135 and the mA was chosen inherently by the Caredose® software and ranged from 19-29.
Test bolus technique
A topogram and pre-contrast survey thoracic CT was performed as per the BT technique. Again, a single slice from the survey scan was chosen in the region of the eighth thoracic vertebra, which contained the Ao and rCPA. The patient received a test bolus of Iohexol 300 mgI/mL at 15% of the full dose of 2 mL/kg. This test bolus was administered manually due to limitations encountered with the pressure injector. The test bolus injection was immediately followed by a manual saline flush at a dose of 1 mL/kg. Then, 40 serial sequential low-dose scans followed at the slice identified on the pre-contrast scan. A breath hold technique was again employed to minimise motion artifacts due to respiration. Following initiation of the scan, there was an unavoidable scan delay, inherent to the machine, of 4 s.
Using the dynamic evaluation software programme (DYNAEVA®), the 40 sequential scans obtained in the previous step were evaluated and information regarding time to peak enhancement was obtained for the Ao. Immediately following this, a helical systemic arterial angiographic scan with a contrast medium dose of 2 mL/kg of 300 mgI/ mL Iohexol was performed, using the time delay obtained during the dynamic scanning. Injection parameters were as for the BT technique.
Imaging data analysis
A primary investigator then evaluated the raw data using a 50% reconstruction increment. The images were viewed with a window width of 750 HU and a window level of 40 HU, which is described as a 'pleural' window (Henninger 2003), as well as with a window width of 400 HU and window level of 40 HU, which is termed as a 'mediastinal' window in the Siemens software. The investigator subjectively determined that the images viewed with the 'mediastinal' window to be easier to interpret and all measurements were done in this window. Thoracic pre-contrast survey and arterial post-contrast images were evaluated on transverse and multiplanar reformatted images. Motion artifacts were noted if present.
Three measurements of the attenuation in HU were taken for the Ao and rCPA in the systemic arterial phase by drawing a ROI in the lumen of the vessels. The three measurements were taken 4.5 mm apart at the level of the eighth thoracic vertebra, where both the Ao and rCPA were visualised on one slice. It was aimed to include approximately 90% of the lumen and not include the vessel wall. These values were averaged and one value was obtained for each vessel during each angiographic phase for the BT tracking and TB technique.
A subjective assessment from 0 to 3 (0 = not visualised, 1 = mild attenuation, 2 = moderate attenuation, 3 = marked homogenous attenuation) of the following vessels was made in the arterial phase: the cranial vena cava, brachiocephalic trunk, left and right subclavian arteries, carotid arteries, costocervical trunk, internal thoracic arteries and the vertebral arteries.
Any side effects noted during the procedure were documented and the mA, CTDI (vol) and the DLP were noted. The total time taken for the studies was documented; this was the time from the start of the CTA procedure, not including the process involved in anaesthetising and positioning the patients. The total dose of contrast medium used for each procedure was also documented and compared. The duration of the delays before initiation of the scans, as well as the duration of the angiographic scans and injections were noted in order to facilitate interpretation of the results, but were not statistically evaluated. All the dogs were closely monitored during their recovery from anaesthesia in the CT room under direct veterinary supervision.
Statistical analysis
All measurements were entered into an Excel spread sheet. The above information was compared between the two groups. In this within-subject study design, the BT and TB techniques were compared with respect to the HU in the Ao and the rCPA areas for the systemic arterial phase. The Shapiro-Wilks test was used to assess whether differences (BT-TB) within parameters were normally distributed. The comparisons were performed using the Students paired t-test. To facilitate the interpretation of the t-test results, the 95% confidence interval for the difference of the means between the BT and the TB was rewritten to a 95% confidence interval for BT as a ratio of TB. The latter was considered the gold standard. When evaluating the 95% confidence interval for the difference of the means, the closer the values are together, the more comparable they are to one another.
The assessment of the visualisation of the smaller cranial thoracic vessels was largely subjective in nature, with a subjective grading score used and the scores averaged and subjectively compared between the two techniques (BT and TB).
The radiation parameters (mA, CTDI(vol) and DLP), the duration of the studies and the total dose of contrast medium used were compared between the BT and TB techniques using the Students paired t-test and significance was set at p < 0.05.
Ethical considerations
The study was approved by the Animal Use and Care Committee (V09/44). The animals used in this study were cared for in a manner approved by this committee.
Results
Each dog responded well to the chosen anaesthetic protocol and recovered well from the anaesthetic. No adverse reactions were noted.
All of the CT scans were considered successful and diagnostic, with adequate attenuation noted in the vessels of interest. Motion artifacts were noted during one of the scans; the systemic arterial phase of the bolus-tracking scan for dog number two. However, the scan was nevertheless considered diagnostic.
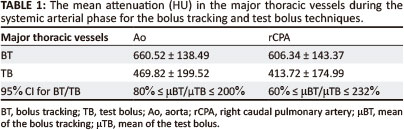
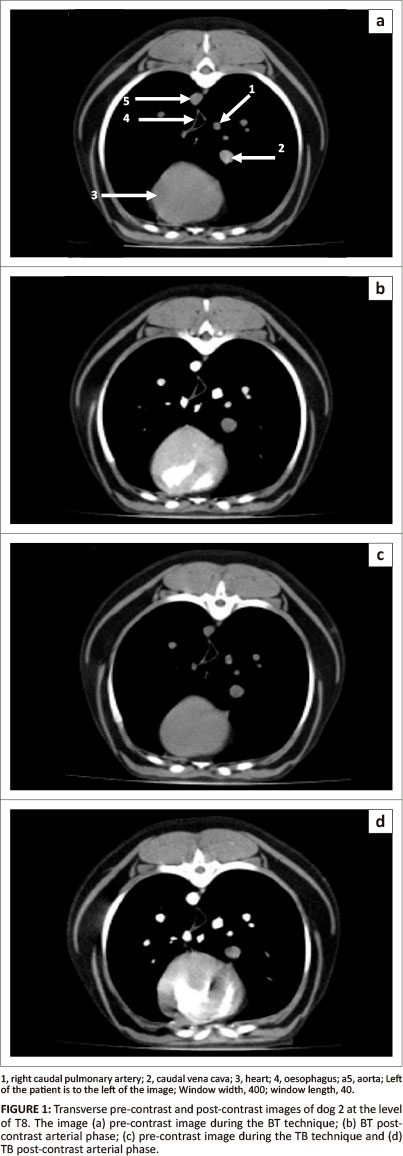
The results for the mean attenuation in the two vessels (Ao and rCPA) are shown in Table 1. Representative transverse images taken at the level of the eighth thoracic vertebra in dog two during the systemic arterial phase during the BT and TB technique are shown in Figure 1.
There was no significant difference in the attenuation in the Ao during the arterial phase between the two techniques (BT = 660.52 HU ± 138.49 HU, TB = 469.82 HU ± 199.52 HU, p = 0.13) (Table 1). However, to further facilitate interpretation, the 95% confidence interval for the difference of the means between BT and TB was rewritten as a ratio of BT to TB (Table 1). This indicated that although BT and TB are comparable techniques, the BT technique could be regarded as superior to the TB technique for attenuation in the Ao during the systemic arterial phase.
The mean attenuation values in the rCPA during the systemic arterial phase did not differ significantly between the two techniques (BT = 606.34 HU ± 143.37 HU, TB = 413.72 HU ± 174.99 HU, p = 0.28) (Table 1). However, the 95% confidence for BT rewritten as a ratio of TB indicated that BT could be regarded as superior to the TB technique for the rCPA in the arterial phase (Table 1).
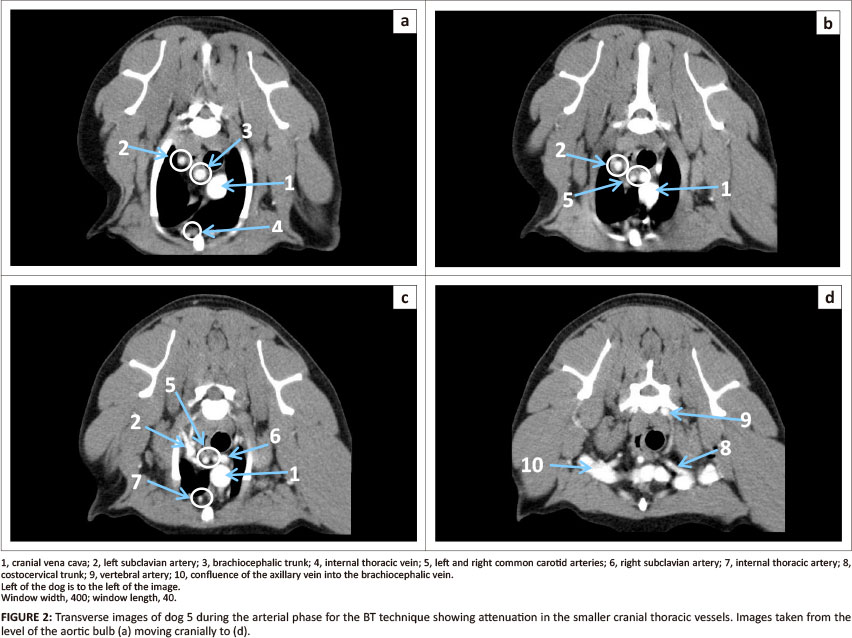
On assessment of the smaller cranial thoracic vessels, the cranial thoracic arteries could most often be visualised with moderate attenuation during the systemic arterial phases (Figure 2 and Figure 3). The internal thoracic artery and vertebral artery were the only smaller cranial thoracic arteries that showed a lower grade of subjective enhancement during the arterial phase for both the BT and TB techniques(Table 2).
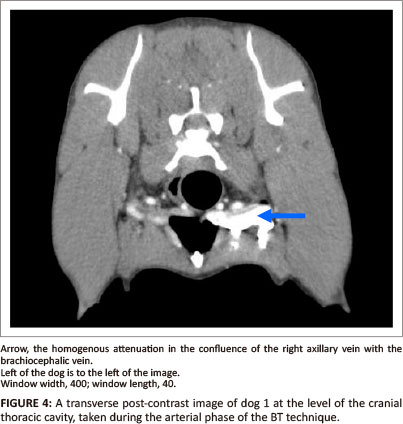
The most striking finding during the assessment of the smaller cranial thoracic vessels was that the cranial vena cava (or, at times, the axillary vein as it merged with the brachiocephalic vein) was consistently visualised during the systemic arterial phase during both techniques on the side of injection (Figure 4).
The mean mA for the BT technique (3564.4 ± 131.94) was significantly lower than for the TB technique (3984.1 ± 315.7) (p = 0.03). The mean CTDI(vol) for the BT technique (31.18 ± 18.01) was significantly lower than for the TB CTDI(vol) (45.45 ± 1) (p = 0.001). The mean DLP did not differ significantly between the two techniques (BT = 140.8 ± 5.4, TB = 166.4 ± 35.73) (p = 0.17).
The BT technique was conducted in a significantly shorter time period than the TB technique (BT = 7.6 min ± 1.07 min, TB = 12.7 min ± 4.19 min, p = 0.03). As expected, the TB technique resulted in the use of significantly more contrast medium (33.2 mL ± 4.02 mL) compared with the BT technique (28 mL ± 3.52 mL) (p = 0.0007). This resulted in an average dose of 1.89 mL/kg for the BT technique and 2.2 mL/kg for the TB technique.
The delay prior to the onset of the arterial phase scan was 4.2 s ± 0.44 s for the BT technique (taken from start of injection and monitoring) and 12.6 s ± 2.5 s for the TB technique. The duration of the arterial phase scan was 18.37 s ± 2.85 s for the BT technique and 16.6 s ± 0.58 s for the TB technique. The duration of injection for the BT technique was 8.83 s ± 1.7 s for the BT technique to 9.95 s ± 1.6 s for the TB technique.
Discussion
Computed tomography thoracic angiographic studies were conducted in healthy adult beagle dogs using both the BT technique and the TB technique. When evaluating the Ao and rCPA during the systemic arterial phase, the BT technique is regarded as superior based on the 95% confidence interval for BT rewritten as a ratio of TB. Explained simply, the BT technique performs better than the TB technique. The BT technique results in a shorter procedural duration, less contrast medium and less mA and CTDI(vol). Thus for a general CTA of the thorax, taking all the above information into account, the BT technique should suffice, giving adequate attenuation in the Ao and rCPA.
The mean attenuation of the rCPA in the systemic arterial phase using both techniques was good, comparable to that achieved in the aorta during this study, and attenuation levels were considered to be adequate for diagnostic purposes (Habing et al. 2011). The good attenuation in the rCPA during the arterial phase is due to the fact that during the systemic arterial phase of the study, the blood has already entered the pulmonary system from the right heart prior to entering the systemic circulation. It can be hypothesised that whilst the systemic arterial phase scan was underway, there was still flow of contrast medium from the right heart (and pulmonary circulation) to the left heart and subsequently the aorta (Erturk et al. 2008). In a recent study investigating pulmonary angiography in dogs, the initial pulmonary enhancement was noted at around 6 s after onset of contrast medium injection, and peak enhancement in the rCPA was noted between 8 s - 10 s (Habing et al. 2011). In a more recent canine study comparing two injection protocols for CTA of the pulmonary arteries, the time to peak enhancement was 8.6 s ± 3.5 s for a fixed injection rate protocol (Makara et al. 2011). The injection duration ranged from 8.83 s ± 1.7 s for the BT technique to 9.95 s ± 1.6 s for the TB technique and the scan times ranged from 16.6 s ± 0.58 s for the TB technique to 18.37 s ± 2.85 s for the systemic arterial phase during BT. Considering this, as well taking into account that the scans were conducted in a caudal to cranial direction, it can be concluded that although the attenuation in the rCPA was good during the systemic arterial phases, it was most likely obtained post peak enhancement. However, to confirm this speculation, specific studies into pulmonary enhancement would be needed.
The visualisation of the cranial thoracic arteries was considered to be adequate for their identification and detection of gross pathology, with no marked subjective difference between the two techniques. This is in contrast to human medical literature, which cites the TB technique to be preferable when evaluating smaller vessels (Sheiman et al. 1996). However, that study pertained to the abdominal aorta and its branches. If pathology is suspected in any of the cranial thoracic vessels, it is expected that the ROIs for both the BT and TB techniques will be placed in an appropriate level of the ascending aorta. Scanning should be done over a limited scan range, over the region of suspect pathology, and done in a caudal to cranial direction (Joly, D'Anjou & Huneault 2008). If such a defined protocol is followed, it is expected that improved attenuation in the cranial thoracic arteries will be obtained.
It is likely that the reason for seeing contrast consistently in all studies in the cranial vena cava (or at the confluence between the axillary veins into the brachiocephalic veins) on the side of injection, despite the use of a manual saline flush, was due to residual contrast medium remaining in the venous structures. The use of a saline flush has been advocated to improve the bolus shape by 'pushing' the bolus forward, to flush out contrast medium remaining in the injection tubing and to eliminate the extra step required to clear the vascular access site of residual contrast medium. It has also been shown to be beneficial in reducing artifact formation, in particular streak or per venous artifacts (Haage et al. 2000), and it increases the amount of contrast medium available for image acquisition (Bae 2008, Suzuki et al. 2004). A saline flush is most often administered by means of a double-barrel pressure injector. Due to the technical limitations of the pressure injector used in this study, the mode of administering the saline flush was by manual injection. Thus the pressure attained during injection was most likely inadequate to fully achieve the benefits described above. In order to investigate this theory, the study should be repeated with a double-barrel pressure injector. Another method that could have been employed in this study in order to achieve a saline chaser injected under pressure would have been to layer the contrast medium and saline in the same syringe. A previous study has shown that a saline bolus chaser administered with a pressure injector increased the point of maximal enhancement and also increased the time to point of maximal enhancement (tPME) (Cademartiri et al. 2002). Similarly, should a saline bolus chaser be used, the dose of contrast medium could be reduced, whilst attaining similar peak enhancement values to those obtained with an increased dose and no saline chaser. The injection rates of the saline chaser mentioned in this study were as high as 10 mL/s (Cademartiri et al. 2002). The effects of the use of a pressure injector to administer the saline chaser in this study are speculative and need further investigation.
The radiation emitted by the CT x-ray tube is affected by the tube current (mAs) and the tube voltage (kilovolt peak) (Huda, Rowlett & Schoepf 2010). However, the total amount of radiation that is directed towards a given location within the CT gantry is also affected by the tube rotation speed and the pitch (Huda, Rowlett & Schoepf 2010). The finding that the mA is significantly higher for the TB technique compared to that of the BT technique is due to the addition of a series of low dose sequential scans required for the TB technique. This consequently leads to a significant increase in the CTDI(vol) for the TB technique, as CTDI(vol) relates to the intensity of the x-ray beam incident on the patient and is measured from a single rotation of the x-ray tube. CTDI(vol) generally depends on the kilovolt and mA chosen to perform the examination (Huda & Mettler 2011). However, neither the mA nor the CTDI(vol) take into account the patient size and the scan length. The DLP is not significantly different between the two studies, although the BT technique has lower mean DLP values than the TB technique. This finding holds more weight than that of the other dose parameters evaluated (mA and CTDI(vol)), as the DLP can be used to estimate the effective dose for a CT examination by applying a DLP to Energy conversion factor (k), which depends on the anatomic region examined (Huda & Mettler 2011; McCollough, Christner & Kofler 2010). The effective dose takes into account the tissue being irradiated and permits comparisons between different forms of radiation as well as background radiation. It is agreed that the value calculated for effective dose in human studies is subject to many uncertainties and approximations (McCollough, Christner & Kofler 2010), thus making the term 'effective dose' a broad, generic estimation of risk. To the best of our knowledge, there are no effective doses described for animal studies. However, as the estimation of effective dose calculation in humans makes use of small anthropomorphic patient models, thus making these estimates applicable to small humans only, it would seem logical to associate this term with an estimate of dose to animal patients. Further work would be needed to define animal equivalent models not only in CT but also in other forms of diagnostic imaging involving ionising radiation. However, to minimise radiation dose to a patient the BT technique is suggested.
As expected, the duration of the BT study compared with the TB study is significantly shorter; this is because additional scans are required during the TB technique. However, in some cases, the BT technique took half the time and it was unexpected that the time difference would be so significant. This is thought to be partly due to operator inexperience and partly due to the learning curve experienced when using the TB technique in practice. It can be expected that the TB technique will be quicker as experience with the technical aspects involved is gained. None the less, if a patient has an anaesthetic risk or is compromised in any way, it would be better to choose a protocol that is known to be shorter in duration, whilst still providing diagnostic quality studies. For this reason, the BT technique would be desirable over the TB technique.
The finding that the dose of contrast medium used during the BT technique was significantly less than the TB technique was expected. It is a characteristic of a TB technique, as the name implies, that an additional dose of contrast medium be used for dynamic evaluation of enhancement in the vessels of interest prior to planning the angiographic study. This may translate into increased costs incurred for the extra contrast medium used, a factor that may need to be considered when cost sensitive cases are under study. There is also a potential increased risk of contrast medium-associated toxicities, such as in patients with underlying renal pathology or diabetes (Baerlocher, Asch & Myers 2010; Barrett 1994; Barrett et al. 2006; Bryniarski 2010; Bui et al. 2007; Deray et al. 1999; Galimany-Masclans et al. 2010; Katzberg & Newhouse 2010). Although this will most likely not be the major factor in the decision between performing a TB or BT technique in a patient, it may be a deciding factor to consider when all other factors prove equal.
The main limitation to this study was the low number of animals investigated, although each animal was used as its own control. For this reason, the 95% confidence interval for the obtained data was rewritten as a 95% confidence interval for BT as a ratio of TB, with the latter being considered the gold standard. The question arises whether the TB technique being considered the gold standard should be a limitation to this study. When using the TB technique the scan is individualised for the patient under study and takes into account the inherent factors that may affect the scan, such as cardiac output (CO), heart rate and blood pressure. However, the use of the TB technique presumes a relationship between the bolus geometry of the test bolus and the main bolus. The correlation between the test bolus tPME and the main bolus tPME has been found to be variable depending on which study is reviewed and can vary from none to moderate (Cademartiri et al. 2002). What has been found is a strong correlation between the test bolus tPME and the time to reach certain attenuation levels in the main bolus (Cademartiri et al. 2002). These findings indicate that the bolus geometry between the test bolus and the main bolus is, in fact, different and this may lead to the TB technique being demoted as the gold standard technique as applied in this study. However, currently there are no other study designs that could be used as the gold standard for CTA.
The test dose during the TB technique was administered manually and then followed by a manual saline flush; therefore the flow rates achieved during this administration would not have been close to the flow rate of 3 mL/s achieved with a pressure injector. It can be expected that the test bolus was thus not delivered in a tight bolus and may have been diluted in the blood pool. This would affect not only the tPME but also the PME recorded and evaluated during the dynamic evaluation, which would translate into potentially erroneous time delays during the TB scan. In studies comparing BT to TB techniques in humans, the test bolus is injected using a pressure injector with the same injection rate as that used during injection of the main bolus (Cademartiri et al. 2005). In these studies the test bolus was 20 mL, but in this study, due to the lower mean weight of the animals, the test bolus injected was on average 4.0 mL. Injecting such a low dose under pressure with the pressure injector currently in use at the facility, made this technically difficult. Because the saline flushes were all manually injected, the pressures obtained during manual injection are likely to be much less than those obtained when using a pressure injector and this may have negated the effects of a saline flush. However, the influence of this variable was considered to be minimal, as each animal was used as its own control in this study.
One of the main variables that have been shown to affect the bolus geometry during CTA is CO (Bae 2008, Cademartiri et al. 2002), with a decrease in CO resulting in a longer tPME and a higher PME. Although the animals used in this study were deemed to be healthy based on routine clinical tests, CO of the animals was not investigated. Another factor to consider is that the animals were placed under general anaesthetic, which is known to affect cardiopulmonary parameters. The same anaesthetic protocol was used for each animal to limit this variable. Considering the design of the study, where each animal acted as its own control, it can be concluded that CO did not significantly affect the outcome of the study.
Cognisance was taken of the fact that the animals undergoing the TB technique received 15% more contrast medium than the BT group, but it is anticipated that this low dose of contrast medium was diluted by the blood pool and did not have an effect on the attenuation achieved following the bolus injection.
Conclusion
This study is useful as it gives the clinician the confidence to make an informed choice when choosing a CTA thoracic study protocol in a medium-sized canine patient whilst using a dual-slice CT scanner. The limitations identified in this study can be taken into account during clinical CTAs and the variables kept to a minimum. This study did not investigate the use of different injection rates or contrast medium concentrations on the attenuation in the vessels of interest using the two techniques and this warrants future investigation. Similarly, with the knowledge obtained from this research, for patients that have sub-clinical renal disease or are at higher risk of adverse reactions to the contrast medium, the clinician can consider the benefit of using additional contrast medium to perform a TB CTA. However, for CTA evaluation of the systemic arterial phase of the thorax, the risk and cost of using extra contrast medium can be eliminated and the BT technique can confidently be used, knowing that BT will give similar results to the TB technique.
Acknowledgements
Competing interests
'The authors declare that they have no financial or personal relationship(s) that may have inappropriately influenced them in writing this article.'
Author's contributions
N.C. (University of Pretoria) was the project leader, designed and executed the study, was responsible for care of the animals and wrote the manuscript. A.C. (University of Pretoria) gave intellectual and practical contributions regarding the study and manuscript preparation. P.B. (Medical Research Council) did the statistical analysis for the study.
References
Bae, K.T., 2008, 'Technical aspects of CT delivery in advanced CT', viewed n.d., Available: http://www.ctisus.com/cta_web/Bae.html [ Links ]
Bae, K.T., 2003, 'Peak contrast enhancement in CT and MR angiography: when does it occur and why? Pharmacokinetic study in a porcine model', Radiology 227, 809-816. http://dx.doi.org/10.1148/radiol.2273020102, PMid:12702823 [ Links ]
Baerlocher, M.O., Asch, M. & Myers, A., 2010, 'Contrast-induced nephropathy', Canadian Medical Association Journal 182, 1445-1445. http://dx.doi.org/10.1503/cmaj.090372, PMid:20547713, PMCid:2942918 [ Links ]
Barrett, B.J., 1994, 'Contrast nephrotoxicity', Journal of the American Society of Nephrology 5, 125-137. PMid:7993992 [ Links ]
Barrett, B.J., Katzberg, R.W., Thomsen, H.S., Chen, N., Sahani, D., Soulez, G., Heiken, J.P., Lepanto, L., Ni, Z.H., Ni, Z.H. & Nelson, R., 2006, 'Contrast-induced nephropathy in patients with chronic kidney disease undergoing computed tomography: a double-blind comparison of iodixanol and iopamidol', Investigative Radiology 41, 815-821. http://dx.doi.org/10.1097/01.rli.0000242807.01818.24, PMid:17035872 [ Links ]
Bryniarski, L., 2010, 'Acute renal failure caused by contrast - as is always the most important prevention', Kardiologia polska 68, 1021-1022. PMid:20859893 [ Links ]
Bui, K.L., Horner, J.D., Herts, B.R. & Einstein, D.M., 2007, 'Intravenous iodinated contrast agents: risks and problematic situations', Cleveland Clinic Journal of Medicine 74, 361. http://dx.doi.org/10.3949/ccjm.74.5.361, PMid:17506241 [ Links ]
Cademartiri, F., Luccichenti, G., Gualerzi, M., Brambilla, L., Brambilla, V. & Coruzzi, P., 2005, 'Intravenous contrast material administration in multislice computed tomography coronary angiography', Acta Bio-Medica: Atenei Parmensis 76, 86-94. PMid:16350553 [ Links ]
Cademartiri, F., Nieman, K., van der.Lugt, A., Rolf, H., Raaijmakers, R.H., Mollet, N., et al., 2004, 'Intravenous contrast material administration at 16-detector row helical CT coronary angiography: test bolus versus bolus-tracking technique', Radiology 233, 817-823. http://dx.doi.org/10.1148/radiol.2333030668, PMid:15516601 [ Links ]
Cademartiri, F., van der Lugt, A., Luccichenti, G., Pavone, P. & Krestin, G.P., 2002, 'Parameters affecting bolus geometry in CTA: a review', Journal of Computer Assisted Tomography 26, 598-607. http://dx.doi.org/10.1097/00004728-200207000-00022, PMid:12218827 [ Links ]
Cardoso, L., Gil, F., Ramirez, G., Teixeira, M.A., Agut, A., Rivero, M.A., et al., 2007, 'Computed tomography (CT) of the lungs of the dog using a helical CT scanner, intravenous iodine contrast medium and different CT windows', Anatomia Histologia Embryologia. 36, 328-331. http://dx.doi.org/10.1111/j.1439-0264.2007.00776.x, PMid:17845220 [ Links ]
De Rycke, L.M., Gielen, I.M., Simoens, P.J. & van Bree, H., 2005, 'Computed tomography and cross-sectional anatomy of the thorax in clinically normal dogs', American Journal of Veterinary Research 66, 512-524. http://dx.doi.org/10.2460/ajvr.2005.66.512, PMid:15822598 [ Links ]
Deray, G., Bagnis, C., Jacquiaud, C., Dubois, M., Adabra, Y. & Jaudon, C., 1999, 'Renal effects of low and isoosmolar contrast media on renal hemodynamic in a normal and ischemic dog kidney', Investigative Radiology 34, 1-4. http://dx.doi.org/10.1097/00004424-199901000-00001, PMid:9888047 [ Links ]
Erturk, S.M., Ichikawa, T., Sou, H., Tsukamoto, T., Motosugi, U. & Araki, T., 2008, 'Effect of duration of contrast material injection on peak enhancement times and values of the aorta, main portal vein, and liver at dynamic MDCT with the dose of contrast medium tailored to patient weight', Clinical Radiology 63, 263-271. http://dx.doi.org/10.1016/jJ.crad.2007.02.024, PMid:18275866 [ Links ]
Frush, D.P., 2005, 'Technique of pediatric thoracic CT angiography', Radiologic Clinics of North America 43, 419-433. http://dx.doi.org/10.1016/j.rcl.2004.09.013, PMid:15737377 [ Links ]
Galimany-Masclans, J., Garrido-Aguilar, E., Pernas-Canadell, J. & Diaz-Rodriguez, S., 2010, 'Adverse reactions to iodinated contrast media', Enfermeria Clinica 20, 297-300. http://dx.doi.org/10.1016/j.enfcli.2010.05.011, PMid:20727803 [ Links ]
Haage, P., Schmitz-Rode, T., Húbner, D., Piroth, W. & Gúnther, R.W., 2000, 'Reduction of contrast material dose and artifacts by a saline flush using a double power injector in helical CT of the thorax', American Journal of Roentgenology 174, 1049-1053. http://dx.doi.org/10.2214/ajr.174A1741049, PMid:10749248 [ Links ]
Habing, A., Coelho, J.C., Nelson, N., Brown, A., Beal, M. & Kinns, J., 2011, 'Pulmonary angiography using 16 slice multidetector computed tomography in normal dogs', Veterinary Radiology and Ultrasound 52, 173-178. http://dx.doi.org/10.1111/j.1740-8261.2010.01770.x, PMid:21388469 [ Links ]
Henninger, W., 2003, 'Use of computed tomography in the diseased feline thorax', Journal of Small Animal Practice 44, 56-64. http://dx.doi.org/10.1111/j.1748-5827.2003.tb00121.x, PMid:12622469 [ Links ]
Henzler, T., Meyer, M., Reichert, M., Krissak, R., Nance Jr., J.W., Haneder, S. et al., 2012, 'Dual-energy CT angiography of the lungs: Comparison of test bolus and bolus tracking techniques for the determination of scan delay', European Journal of Radiology 81, 132-138. http://dx.doi.org/10.1016/j.ejrad.2010.06.023, PMid:20621430 [ Links ]
Huda, W. & Mettler, F.A., 2011, 'Volume CT dose index and dose-length product displayed during CT: what good are they?', Radiology 258, 236-242. http://dx.doi.org/10.1148/radiol.10100297, PMid:20971777 [ Links ]
Huda, W., Rowlett, W.T. & Schoepf, U.J., 2010, 'Radiation dose at cardiac computed tomography: facts and fiction', Journal of Thoracic Imaging 25, 204-212. http://dx.doi.org/10.1097/RTI.0b013e3181cf8058, PMid:20711036 [ Links ]
Itoh, S., Ikeda, M., Achiwa, M., Satake, H., Iwano, S. & Ishigaki, T., 2004, 'Late-arterial and portal-venous phase imaging of the liver with a multislice CT scanner in patients without circulatory disturbances: automatic bolus tracking or empirical scan delay?', European Radiology 14, 1665-1673. http://dx.doi.org/10.1007/s00330-004-2321-5, PMid:15067427 [ Links ]
Joly, H., D'Anjou, M. & Huneault, L., 2008, 'Imaging diagnosis: CT angiography of a rare vascular ring anomaly in a dog', Veterinary Radiology and Ultrasound 49, 42-46. http://dx.doi.org/10.1111/j.1740-8261.2007.00315.x, PMid:18251293 [ Links ]
Katzberg, R.W. & Newhouse, J.H., 2010, 'Intravenous contrast medium-induced nephrotoxicity: is the medical risk really as great as we have come to believe?', Radiology 256, 21-28. http://dx.doi.org/10.1148/radiol.10092000, PMid:20574082 [ Links ]
Kim, M., Chung, Y.C., Kim, K.W., Chumg, J., Lim, J.S., Oh, et al., 2006, 'Variation of the time to aortic enhancement of fixed-duration versus fixed-rate injection protocols', American Journal of Roentgenology 186, 185-192. http://dx.doi.org/10.2214/AJR.04.0923, PMid:16357400 [ Links ]
Makara, M., Dennler, M., Kuhn, K., Kalchofner, K. & Kirchner, P., 2011, 'Effect of contrast medium injection duration on peak enhancement and time to peak enhancement of canine pulmonary arteries', Veterinary Radiology and Ultrasound 52, 42-46. http://dx.doi.org/10.1111/j.1740-8261.2011.01850.x, PMid:21831249 [ Links ]
McCollough, C.H., Christner, J.A. & Kofler, J.M., 2010, 'How effective is effective dose as a predictor of radiation risk?', American Journal of Roentgenology 194, 890896. http://dx.doi.org/10.2214/AJR.09.4179, PMid:2030848 [ Links ]
Mehnert, F., Pereira, P.L., Trúbenbach, J., Kopp, A.F. & Claussen, C.D., 2001, 'Biphasic spiral CT of the liver: automatic bolus tracking or time delay?', European Radiology 11, 427-431. http://dx.doi.org/10.1007/s003300000633, PMid:11288847 [ Links ]
Rivero, M.A., Vázquez, J.M., Gil, F., Ramirez, J.A., Vilar, J.M., Miguel, A. et al., 2009, 'CT-soft tissue window of the cranial abdomen in clinically normal dogs: an anatomical description using macroscopic cross-sections with vascular injection', Anatomia Histologia Embryologia 38, 18-22. http://dx.doi.org/10.1111/j.14390264.2008.00886.x, PMid:18803632 [ Links ]
Roggenland, D., Peters, S.A., Lemburg, S.P., Holland-Letz, T., Nicolas, V. & Heyer, C.M., 2008, 'CT angiography in suspected pulmonary embolism: impact of patient characteristics and different venous lines on vessel enhancement and image quality', American Journal of Roentgenology 190, W351-W359. http://dx.doi.org/10.2214/AJR.07.3402, PMid:18492877 [ Links ]
Sheiman, R.G., Raptopoulos, V., Caruso, P., Vrachliotis, T. & Pearlman, J., 1996, 'Comparison of tailored and empiric scan delays for CT angiography of the abdomen', American Journal of Roentgenology 167, 725-729. http://dx.doi.org/10.2214/ajr.167.3.8751690, PMid:8751690 [ Links ]
Suzuki, H., Oshima, H., Shiraki, N., Ikeya, C. & Shibamoto, Y., 2004, 'Comparison of two contrast materials with different iodine concentrations in enhancing the density of the the aorta, portal vein and liver at multi-detector row CT: a randomized study', European Radiology 14, 2099-2104. http://dx.doi.org/10.1007/s00330-004-2439-5, PMid:15309493 [ Links ]
Van Hoe, L., Marchal, G., Baert, A.L., Gryspeerdt, S. & Mertens, L., 1995, 'Determination of scan delay time in spiral CT-angiography: utility of a test bolus injection', Journal of Computer Assisted Tomography 19, 216-220. http://dx.doi.org/10.1097/00004728-199503000-00009, PMid:7890844 [ Links ]
Zwingenberger, A.L. & Schwarz, T., 2004, 'Dual-phase CT angiography of the normal canine portal and hepatic vasculature', Veterinary Radiology and Ultrasound 45, 117-124. http://dx.doi.org/10.1111/j.1740-8261.2004.04019.x, PMid:15072142 [ Links ]
 Correspondence:
Nicolette Cassel
nicky.cassel@up.ac.za
Private bag X04
Onderstepoort 0110, South Africa
Received: 05 Sep. 2012
Accepted: 18 Mar. 2013
Published: 07 May 2013

