


Serviços Personalizados
Artigo
 Inglês (pdf)
 Artigo em XML
 Referências do artigo
Indicadores

Links relacionados
-
 Citado por Google
 -
 Similares em Google
Compartilhar

 Permalink
Journal of the South African Veterinary Association
versão On-line ISSN 2224-9435
versão impressa ISSN 1019-9128
J. S. Afr. Vet. Assoc. vol.82 no.2 Pretoria Jan. 2011
ARTICLE ARTIKEL
The utility of uric acid assay in dogs as an indicator of functional hepatic mass
J M Hill*; A L Leisewitz; A Goddard
Department of Companion Animal Clinical Studies, Faculty of Veterinary Science, University of Pretoria, Private Bag X04, Onderstepoort, 0110 South Africa
ABSTRACT
Uric acid was used as a test for liver disease before the advent of enzymology. Three old studies criticised uric acid as a test of liver function. Uric acid, as an end-product of purine metabolism in the liver, deserved re-evaluation as a liver function test. Serum total bile acids are widely accepted as the most reliable liver function test. This study compared the ability of serum uric acid concentration to assess liver function with that of serum pre-prandial bile acids in dogs. In addition, due to the renal excretion of uric acid the 2 assays were also compared in a renal disease group. Using a control group of healthy dogs, a group of dogs with congenital vascular liver disease, a group of dogs with non-vascular parenchymal liver diseases and a renal disease group, the ability of uric acid and pre-prandial bile acids was compared to detect reduced functional hepatic mass overall and in the vascular or parenchymal liver disease groups separately. Sensitivities, specificities and predictive value parameters were calculated for each test. The medians of uric acid concentration did not differ significantly between any of the groups, whereas pre-prandial bile acids medians were significantly higher in the liver disease groups compared with the normal and renal disease group of dogs. The sensitivity of uric acid in detecting liver disease overall was 65 % while the specificity of uric acid in detecting liver disease overall was 59 %. The sensitivity and specificity of uric acid in detecting congenital vascular liver disease was 68 % and 59 %, respectively. The sensitivity and specificity of uric acid in detecting parenchymal liver disease was 63 % and 60 %, respectively. The overall positive and negative predictive values for uric acid in detecting liver disease were poor and the data in this study indicated uric acid to be an unreliable test of liver function. In dogs suffering from renal compromise serum uric acid concentrations may increase into the abnormal range due to its renal route of excretion.
Keywords: bile acids, dog, hepatic function, uric acid.
INTRODUCTION
Physiologically, uric acid is an attractive candidate for a liver function test. In most mammalian species uric acid (UA) is the end-point of purine metabolism in the liver4,14,24,30. In most mammals, and in dogs in particular, the UA is then decarboxylated producing allantoin, which is watersoluble and can be excreted by the kidneys10,14,24,30. In these species serum UA levels only increase to the levels encountered in humans when there is hepatic dysfunction4,7,10,14,24,30. However, UA is predominantly excreted in the urine and could be affected by renal insufficiency 17,18,21,23,25,36.
UA was used as a liver test in the late 1950s and early 1960s. UA fell out of favour as a liver function test following the publication of 2 studies and 1 case report in the late 1950s12,19,22. One of the studies compared UA with bromosulphothalein in experimental carbon-tetrachloride hepatotoxicosis22. The case report and other study compared UA with liver enzymes, particularly alkaline phosphatase (ALP)12,19. Subsequent analysis of these studies identified some shortcomings, including inconsistencies in definition of liver disease, the lack of histopathological confirmation of liver pathology and the fact that UA and ALP were compared despite not having been run on the same sample. In addition, when these studies were published the differences between liver function tests and liver enzymes were not always emphasised and UA, a liver function test, was compared with liver enzymes12,19,22. Despite the limitations of these studies, several prominent reference texts have since perpetuated their findings and UA fell out of favour as a test of liver function4,6,7.
We believe that UA deserved a reassessment as a test of liver function. Plasma ammonia concentration is a very reliable test of liver function but has very stringent sample-handling requirements that often make its application in the average clinic setting impractical2,8,9,33,35. The provocative ammonia-tolerance test, which is used to increase sensitivity15, has inherent risks of inducing hepatic encephalopathy in dogs with subclinical liver disease when administered at the challenge dose16,31. Basal serum bile acid concentrations, while not as sensitive or specific for portosystemic shunts as ammonia, are easier to perform and also more useful in non vascular-associated liver disease1,3,5,11,13,20,32. However, bile acid assays are not widely available in South Africa resulting in delays in turn-around times. Post-prandial bile acid tests increase the sensitivity of the bile acid assay, particularly in diagnosing portosystemic shunts, but the 2-hour delay (post-prandially) is often not practical in a busy practice setting.
In today's climate of ever-increasing costs, and demand for rapid turn-around times, it would be very useful to veterinarians if a simple, rapid, cheap and robust assay could be found for evaluating functional hepatic mass. UA would appear to have this potential and is performed by most medical laboratories. The purpose of this study was to compare the utility of serum UA concentrations compared with the concentration of serum pre-prandial or baseline bile acids (b-BA) as a screening test to assess liver function in dogs with liver disease, and to assess UA in dogs with renal disease and a control group of healthy dogs.
The hypotheses were as follows: (1) uric acid is an effective test of liver function in dogs with both vascular and non-vascular liver disease; (2) renal compromise does not result in elevated serum UA concentration.
MATERIALS AND METHODS
Data collection
A group of dogs, determined to be clinically healthy based on a clinical examination, haematology and biochemistry panels was included as a healthy control group (Group 1). The biochemistry panel included urea, creatinine, electrolytes (Na, K, Cl), total protein, albumin, ALT, ALP, GGT calcium, inorganic phosphate, pre-and post-prandial bile acids, and uric acid. Dogs were included in this group if they had serum baseline bile acid concentrations within normal limits (<15 µmoℓ/). Dalmatians and Bulldogs were excluded from any of the disease groups because of possible hyperuricaemia due to defective hepatic uric acid metabolism28,29.
Retrospective case data from the data base of the Clinical Pathology Laboratory of the Onderstepoort Veterinary Academic Hospital (OVAH) of the Faculty of Veterinary Science, University of Pretoria, were analysed to identify dogs with liver disease and renal disease as indicated below. For Groups 2 (portosystemic shunt), 3 (liver disease) and 4 (renal disease) cases were selected on the basis of a combination of characteristic history, clinical, biochemical, ultrasound or histopathology. Not all data were available in all cases but sufficient data were available in all cases to ensure that diagnostic criteria for the group were met. The exact criteria used in each group are described below. Uric acid was measured retrospectively on stored serum samples for cases from Groups 2, 3 and 4. The samples had been stored at -20 ºC at the OVAH. Uric acid is stable in serum frozen at -20 ºC for 6 months37; studies recording longer duration periods could not be found. The oldest cases were from Group 2 and were up to 26 months old when assayed. Similarly, baseline bile acid concentration was measured on stored samples for dogs of Group 4. All the dogs in Groups 2 and 3 had pre-and post-prandial bile acid data sets, which were included for completeness, but for the dogs from the renal failure group (Group 4) only baseline bile acid results were possible. The cases selected for Group 2 had elevated bile acids and evidence of portosystemic shunts based on ultrasound and or histopathology. Dogs in this group had no evidence of renal failure based on serum urea and creatinine concentrations. Group 3 consisted of dogs that had biochemical indications of liver disease, raised baseline bile acids and ultrasound and/or histopathological evidence of liver disease that was not vascular associated. Dogs were included if they had elevated liver enzymes, elevated bile acid concentrations and no evidence of renal compromise based on serum urea and creatinine concentrations. Members of Group 4 were included if they had elevated serum urea and creatinine concentrations, ultrasound or histopathology results indicating renal failure and no evidence of raised liver enzymes or other results that would suggest concurrent liver disease. Seven of the 8 dogs had inappropriately dilute urine specific gravity (Table 1, median urine SG 1.015) for the degree of azotaemia.
The bile acid assays were conducted using an enzymatic end-point formazan method (Materlab bile acid assay Cod BIL8900, Materlab, Spain, Madrid)24,31. The reference interval for baseline bile acids (b-BA) in the Clinical Pathology Laboratory (OVAH) is <15 µmoℓ/ , and <25 µmoℓ/ for post-prandial bile acids (pp-BA).
The uric acid assays were conducted using a colorimetric uricase enzymatic 2-stage end-point method which catalyses the reaction of water, oxygen and uric acid in the sample to allantoin, peroxide and carbon dioxide24 (AE2-25 reagent for the uric acid assay on the NExCT analyser, Alfa Wassermann, USA, New Jersey). The reference interval for uric acid in the Clinical Pathology Laboratory (OVAH) is 0-0.06 mmoℓ/ .
Statistical analysis
Files from the OVAH database were searched and data from suitable cases were extracted and entered into Microsoft Excel® spreadsheets (Microsoft Corporation, Johannesburg South Africa). The statistical analysis was performed by the Department of Statistics, University of Pretoria. The software packages used included STATISTICA® (Release 7), BMDP Statistical Software® (Release 7.1) and SAS® (version 9.1). The Kruskal-Wallis method was used to compare the medians of UA, b-BA and pp-BA from all 4 groups. Chi-square analysis was used to test for any relationship between UA and b-BA. The P value indicative of significance was P < 0.05
Group selection
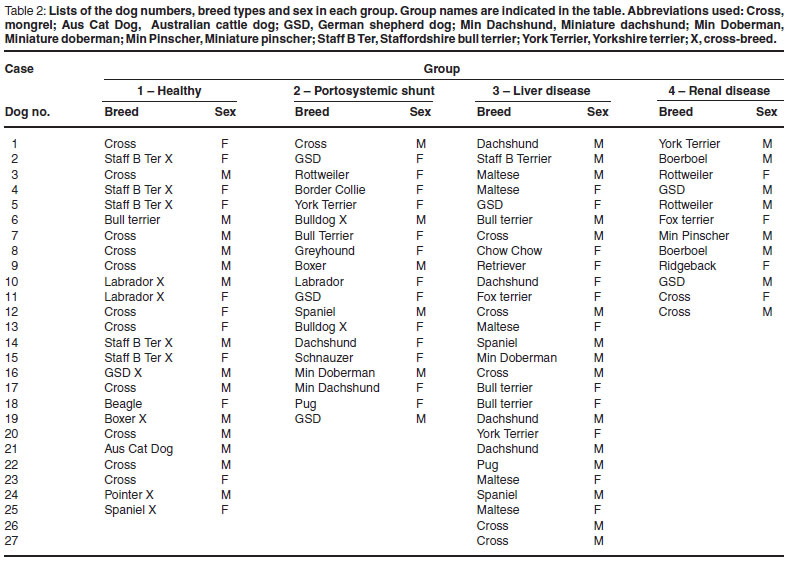
Group 1 consisted of 25 dogs, of which 11 were females and 14 were males (Table 2). The age range was from 5 to 84 months with a median age of 18 months. Their body weights ranged from 9-26 kg with a median body weight of 15.2 kg. The breeds consisted of 11 nondescript cross-breeds, 5 Staffordshire bull terrier crosses, 2 Labrador crosses and 1 each of Australian cattle dog, Boxer, Bull terrier, German shepherd dog, Beagle, Pointer and Spaniel cross-breeds.
Group 2 consisted of 19 dogs, of which 13 were females and 6 were males (Table 2). The age range was from 2 to 11 months with a median age of 7 months. Their body weights ranged from 1-27.7 kg with a median body weight of 7.8 kg. The breeds consisted of 3 German shepherd dogs, 2 Bulldog crosses, and 1 each of Miniature doberman, Miniature dachshund, Dachshund, Boxer, Bull terrier, Greyhound, Rottweiler, Labrador, Spaniel, Border collie, Schnauzer, Pug, Yorkshire terrier and a cross-breed.
Group 3 comprised 27 dogs, of which 12 were females and 15 males (Table 2). The age range was from 3 to 216 months with a median age of 7 years 10 months. Their body weights ranged from 1.8-36 kg with a median body weight of 8.6 kg. The breeds consisted of 5 each of cross-breeds and Maltese poodles, 4 Dachshunds, 3 Bull terriers, 2 Spaniels and 1 each of German shepherd dog, Labrador, Pug, Staffordshire Bull terrier, Miniature doberman, Yorkshire terrier, Chow chow and Fox terrier.
Group 4 consisted of 12 dogs, of which 4 were females and 8 were males (Table 2). The age range was from 12 to 156 months with a median age of 5 years. Their body weights ranged from 2.92-45 kg with a median body weight of 28.1 kg. The breeds consisted of 2 each of cross-breed dogs, Rottweilers, German shepherd dogs and Boerboels and 1 each of Rhodesian ridgeback, Miniature pinscher, Fox terrier and Yorkshire terrier.
Ultrasound and histopathology results
In Group 2 (Table 2), 3 of the cases had evidence of a shunt on ultrasound alone and this was sufficient for a diagnosis and inclusion into this group (Dogs 10, 14, 18). One of the cases had an intra-hepatic porto-caval shunt confirmed by scintigraphy (Dog 10), while the other 2 were extra-hepatic porto-caval shunts (Dogs 14, 18). Four other cases had an extrahepatic shunt diagnosed on ultrasound. Histopathology was performed on all the cases and microvascular dysplasia (MVD) was reported as an underlying cause in 3 of them (Dogs 11, 13, 16), while the 4th dog (Dog 9) had a shunt detected at post mortem examination (PM). Two cases had only histopathological confirmation of MVD without any ultrasound evidence (Dogs 6, 12). Four cases had inconclusive ultrasound results (microhepatia, suspected hepatopathy) but had histopathological confirmation of MVD (Dogs 1, 4, 5, 19). Ultrasound and additional portovenography or scintigraphy reports were available for 3 of the cases (Dogs 2, 3, 10). Two of these cases also had histopathology (Dogs 2, 3) in which Dog 2 was confirmed to have an intra-hepatic shunt and Dog 3 was confirmed to have an extra-hepatic shunt; both had underlying MVD on histopathology.
Histopathology was not available for Dog 10, but scintigraphy confirmed an extra-hepatic shunt. Scintigraphy results identifying shunts with significant shunt fractions were available for Dogs 8 and 17. Dog 8 had a portosystemic shunt with a shunt fraction of 74 %, while Dog 17 had an azygos vein shunt with a shunt fraction of 63 %. Both of these cases had MVD on histopathology and a patent ductus venosus was diagnosed in Dog 8. Overall, among the 15 cases for which histopathology was available, MVD was reported in all but 1 case, which had an extra-hepatic shunt found at PM. Of the 4 dogs for which histopathology was not available, 1 dog had no evidence of a shunt on ultrasound but abnormally small portal veins (Dog 7), while the other 3 had ultrasound indicating porto-caval shunts (listed previously). One additional case (Dog 15) had a previously diagnosed congenital shunt (2 years previously) which had been medically managed but the dog was presented due to deterioration in health. Initial records and diagnostic methods were not available for this dog.
In Group 3 (Table 2) ultrasound only was available for 14 of the cases in which no shunts were identified. Dog 7 did not have an ultrasound examination and Dog 17 had an ultrasound report of microhepatia from the referring veterinarian. Seven cases had abnormalities such as fatty liver, steroid hepatopathy, biliary distension, cholangitis/cholangiohepatitis, microhepatia and suspected early aberrant larval migration on ultrasound (Dogs 1, 2, 3, 14, 19, 22, 25). In 6 other cases, no shunts could be visualised but the appearance of the parenchyma was abnormal and early fibrosis or cirrhosis was suggested (Dogs 13, 15, 16, 20, 23, 27). Two cases had echocardiography only (Dogs 4, 11). Dogs 5, 6, 8, 9, 12, 18 and 26 had distinct nodules or masses identified on ultrasound, which in 4 cases were confirmed to be tumours (6, 8, 12, 26) on histopathology. Of the 3 other cases, Dog 5 had centrilobular necrosis and duplication of central veins; Dog 18 had severe centrilobular to bridging necrosis and Dog 9 had diffuse cirrhosis on histopathology. Dogs 10 and 24 had diffuse hypoechogenicity on ultrasound and chronic centrilobular to bridging necrosis and chronic active hepatitis on histopathology, respectively. A total of 13 cases had histopathology performed. In 7 of these, liver biopsies were taken for histopathology and 6 other cases had histopathology of liver done at PM. In the cases where biopsies were taken, the reports included 2 cases each of hepatic carcinoma (Dogs 6, 8) and centrilobular to bridging necrosis (Dogs 5, 7); 1 case each of necrotic hepatitis (Dog 21), chronic active hepatitis (Dog 24) and chronic cholangitis (Dog 3). The PM cases included 2 cases of diffuse cirrhosis (Dogs 9, 17); 2 cases of neoplasia (Dog 12, 26) and 2 cases of severe centrilobular to bridging necrosis (Dogs 10, 18).
In Group 4 (Table 2) 10 dogs had ultrasound reports. Two cases (Dogs 4, 6) did not have ultrasound results. Five cases in this group had histopathology results, 4 of them from PM examinations and 1 case had bladder biopsies done. Two cases (Dogs 4, 6) only had histopathology results and no ultrasound report. Dog 4 had extensive nephrocalcinosis and Dog 6 had chronic interstitial nephritis at post mortem. Dog 7 had a bladder biopsy that showed severe cystic fibrosis with an ultrasound report of bilateral hydroureter. The other PM cases were Dog 8 which had tubulo-interstitial nephritis with an ultrasound report indicating chronic renal disease and Dog 5 which had severe chronic glomerulonephritis and interstitial fibrosis with prominent medullary rim signs on ultrasound. The remaining 7 cases had ultrasound findings suggesting renal disease, and clinicopathological (azotaemia and dilute urine specific gravity) results consistent with renal disease. In these cases 3 (Dogs 1, 9, 10) had ultrasound changes consistent with chronic renal failure; 2 cases (Dogs 11, 12) had bilateral hyperechoic cortices; Dog 3 had pyelonephritis and Dog 2 had bilateral hydronephrosis and hydroureters.
RESULTS
Comparison between groups for tests of liver function
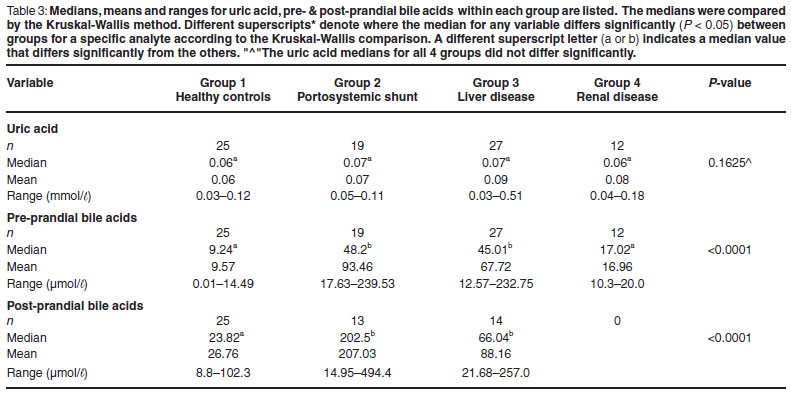
The dogs in the Group 1 had a b-BA range of 0.1-14.49 µmol/ℓ and a median of 9.24 µmol/ℓ ; b-BA had a range of 17.63-239.53 µmol/ℓ and a median of 48.2 µmol/ℓ in Group 2; a range of 12.57-232.75 µmol/ℓ and a median of 45.01 µmol/ℓ in Group 3 and in Group 4 a range of 10.3-20 µmol/ℓ and the median for b-BA was 17.02 µmol/ℓ . The relative distribution for b-BA in all 4 groups is given in Fig. 1. Groups 2 and 3 had significantly higher medians (P < 0.0001) than Groups 1 and 4 as indicated in Table 3. The medians for b-BA were not statistically significantly different between Groups 2 and 3 or between Groups 1 and 4.
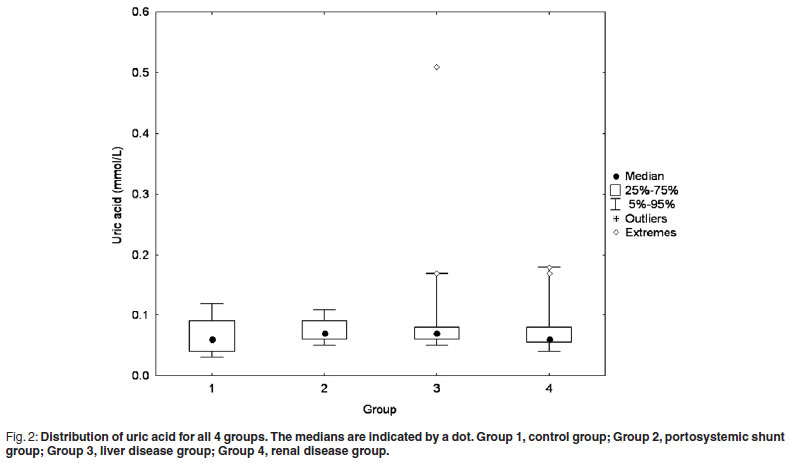
UA had a range of 0.03-0.12 mmol/ℓ and a median of 0.06 mmol/ℓ in Group 1; Group 2 had an UA range of 0.05- 0.11 mmol/ℓ and a median of 0.07 mmol/ℓ ; Group 3 had an UA range of 0.03-0.51 mmol/ℓ and a median of 0.07 mmol/ℓ and in Group 4 the range and median for UA were 0.04-0.18 mmol/ℓ and 0.06 mmol/ℓ , respectively. The relative distribution for UA in all 4 groups is given in Fig. 2. Using the Kruskal-Wallis method the medians of UA were not significantly different for any of the groups (P = 0.1605) as indicated in Table 3. The mean and medians for UA for each group were almost identical suggesting for all groups that the proportion of elevated UA results per group was insignificant.
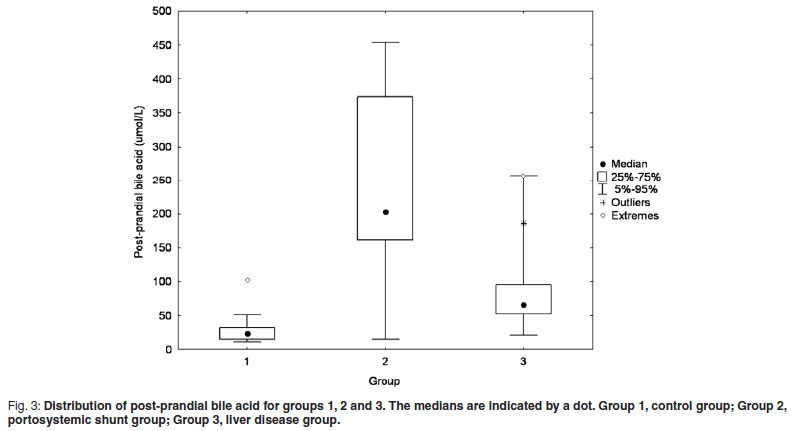
Post-prandial bile acids had a median of 23.82 µmol/ℓ in Group 1. Not all dogs had a pp-BA result in Groups 2 and 3. The median for Group 2 was 202.5 µmol/ℓ and for Group 3 the median was 66.04 µmol/ℓ . None of the dogs in Group 4 had a pp-BA result. The relative distribution for pp-BA in Groups 1, 2 and 3 is given in Fig. 3. Groups 2 and 3 had significantly higher medians (P <0.0001) than Group 1 as indicated in Table 3. The medians for pp-BA were not statistically significantly different between Groups 2 and 3.
Sensitivity and specificity for the uric acid assay
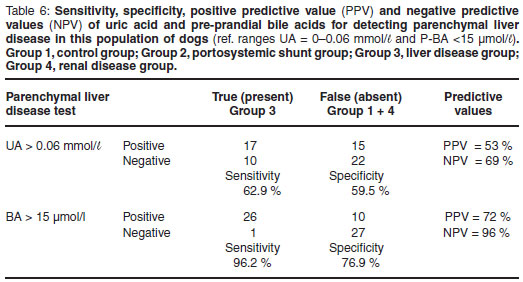
The sensitivity and specificity for UA as a test to identify liver disease (both congenital vascular anomalies and other primary and secondary hepatic disease) was calculated. In this study the sensitivity of UA for diagnosing liver disease overall was 65 %; and the specificity 59 % (Table 4). Chi-square analysis for UA being within the normal range or above normal range showed a similar pattern across all 4 groups (P = 0.1595), confirming the lack of association between UA and liver disease (Table 8). The sensitivity and specificity for UA to detect vascular anomalies and portosystemic shunts (Group 2 cases only) were 68 % and 59 %, respectively (Table 5). The sensitivity and specificity to detect primary parenchymal or secondary hepatopathies (Group 3 cases only) was 63 % and 60 %, respectively (Table 6). At the 95 % confidence interval, the lower and upper limits for these 2 calculations overlapped indicating no statistical difference.


Predictive values for the uric acid assay
The positive predictive value (PPV) for UA as a test of liver function for Groups 2 and 3 combined was 66 % and the negative predictive value (NPV) was 58 % (Table 4). When only cases from Group 2 were evaluated to test the predictive values for identifying congenital vascular anomalies and portosystemic shunts the PPV was 46 % and the NPV was 79 % (Table 5). Similarly with cases from Group 3 alone, the predictive values for identifying primary and secondary parenchymal disease were calculated and the PPV was 53 % and the NPV was 69 % (Table 6).
Relationship between uric acid and pre-prandial bile acids
The levels of UA and b-BA can be categorised as either falling above normal or within the reference interval (Table 7). A chi-square analysis was done to determine whether there was any significant relationship between the levels of UA and b-BA when cases were categorised as above normal or within reference range. The P-value was 0.3096, indicating that there was no significant relationship between the levels of UA and b-BA (Table 8).
DISCUSSION
The purpose of this study was to test the utility of UA in comparison with b-BA as a screening test to identify reduced hepatic function in dogs. These results show that UA is not a reliable screening test for liver disease, whether it be portosystemic shunts, other vascular anomalies, hepatic neoplasia or inflammatory hepatopathies. The medians of UA for all 4 groups of dogs were not statistically significantly different from each other.
When the sensitivity and specificity of UA to detect liver disease overall (Groups 2 and 3 combined) were calculated, the lack of any significant difference between the UA medians across the groups resulted in a poor sensitivity of 65 % and even poorer specificity of just 59 %, while b-BA have been shown in various studies to have better sensitivity and specificity in screening for reduced hepatic function. One study compared serum bile acids with plasma ammonia concentrations as tests to identify portosystemic shunting in 64 cases of surgically confirmed portosystemic shunts34. The authors did not use a single bile acid cut-off value because their data came from more than 1 laboratory that had different reference intervals35. Applying the cut-off of <15 µmol/ℓ to all the cases in their study where a b-BA value was available (44 cases), 39 of them had an elevated result providing a sensitivity of 89 %35. In another study the authors calculated sensitivity and specificity of b-and pp-BA in dogs suffering from various liver diseases5. The study calculated sensitivity and specificity at different serum bile acids cut-off values and for a b-BA concentration of 15.5 µmol/ℓ (similar to this study) the sensitivity was 63.4 % for all types of liver disease and 73.3 % for severe liver disease5. The specificity at this cut-off was 95 % for the non-liver disease group5.Ina study comparing b-BA to plasma ammonia concentration in diagnosing portosystemic shunting9, the authors again used various cut-off values and at a b-BA of 10 µmol/ the sensitivity and specificity were 85.6 % and 72.8 %, respectively, while at the cut-off value of 20 µmol/ they were 77.8 % and 81.5 %, respectively9. These authors stated in their introduction that various studies had calculated sensitivities for b-BA that varied from 64 % to 100 % depending on the cut-off value for abnormal bile acids used, and that the lower sensitivities were not ideal for a screening test9. In another study specificity for fasted b-BA to identify animals without liver disease, using a cut-off value of 15 µmol/ , was reported to be greater than 95 %3. In the same study PPV and NPV were greater than 92 %3, compared with the PPV and NPV of UA of 66 % and 58 %, respectively, reported in this study. Plasma ammonia level is widely regarded as the most sensitive assay for detecting congenital portosystemic shunts9,33,. Unfortunately not enough cases with congenital portovascular anomalies or liver disease in this retrospective study had plasma ammonia data to allow for comparison between UA and ammonia but this comparison would almost certainly not have changed the conclusions drawn.
Dogs in Group 2 all had either ultrasound and/or histopathological evidence of hepatic vascular anomalies and markedly abnormal b-BA and pp-BA concentrations, which is an expected finding2,5,9,33. The UA median for this group (0.07 mmol/ℓ) was, however, only slightly above the reference interval. Dogs in Group 3 also had ultrasound and/or histopathological evidence of various parenchymal hepatopathies and their median for UA concentration was again only slightly above the reference interval (0.07 mmol/ℓ), while their medians for b-BA and pp-BA were significantly elevated above the normal reference intervals, although not to the same degree as those of Group 2. In a study of different forms of hepatitis26, a bile acid cut-off of <10 µmol/ℓ had a sensitivity of 82 %26; the sensitivity of UA in Group 3 in this study was only 62.9 %. The data in this study showed that there was no statistical relationship between UA and b-BA with respect to values falling within and above the reference range.
Dogs in Group 4 were included in this study to test the hypothesis that renal disease would elevate serum UA concentrations. The cases were selected only if they had ultrasound and/or histopathological evidence of renal disease, azotaemia and normal serum bile acid concentrations. Therefore the median for b-BA in this group was within the reference interval, but significantly, their UA median was also at the upper limit of the reference interval of 0.06 mmol/ℓ . The majority of UA is excreted through the kidneys and renal impairment is known to cause increased serum UA concentrations17,18,25. This group only contained 12 cases and the dogs may not have had severe enough renal disease to cause significant impairment of UA excretion. The finding of a median for UA within the reference range was unexpected, but does not alter the findings of the study. In fact if this hypothesis was true it would make the interpretation of elevated UA concentration more complicated and less specific.
CONCLUSION
The major finding in the study was thus that UA should not be used as a biochemical test to evaluate functional hepatic mass. There was no statistical difference between the medians for the liver disease groups (Groups 2 and 3) compared with the non-liver disease groups (Groups 1 and 4) for UA. The sensitivity and specificity of UA concentration as a test of functional hepatic mass were very poor while b-BA has been found to be both sensitive and specific in many previous studies3,5,9,16,27,35. Renal disease did not significantly influence the concentration of UA in this study.
ACKNOWLEDGEMENTS
Rina Owen and Rene Ehlers of the Statistics Department at the University of Pretoria are thanked for all their assistance with the statistical analyses.
REFERENCES
1. Bain P J 2003 Liver. In Latimer K S, Mahaffey E A, Prasse K W (eds) Duncan & Prasse's veterinary laboratory medicine: clinical pathology. Blackwell Publishing, Ames: 193-214 [ Links ]
2. Center S A 1990 Liver function tests in the diagnosis of portosystemic vascular anomalies. Seminars in Veterinary Medicine and Surgery (Small Animal) 5: 94-99 [ Links ]
3. Center S A 1993 Serum bile acids in companion animal medicine. Veterinary Clinics of North America Small Animal Practice 23: 625-657 [ Links ]
4. Center S A 1995 Pathophysiology and laboratory diagnosis of hepatobiliary disorders. In Ettinger S J, Feldman E C (eds) Textbook of veterinary internal medicine (4th edn). W B Saunders, Philadelphia: 1261-1312 [ Links ]
5. Center S A, ManWarren T, Slater M R, Wilentz E 1991 Evaluation of 12-hour preprandial and 2-hour postprandial serum bile acids concentrations for diagnosis of hepatobiliary disease in dogs. Journal of the American Veterinary Medical Association 199: 217-226 [ Links ]
6. Cornelius C E 1970 Liver function. In Kaneko J J (ed.) Clinical biochemistry of domestic animals (2nd edn). Academic Press, San Diego: 161-230 [ Links ]
7. Cornelius C E 1989 Liver function. In Kaneko J J (ed.) Clinical biochemistry in domestic animals (4th edn). Academic Press, San Diego: 364-397 [ Links ]
8. Dial S M 1995 Clinicopathologic evaluation of the liver. Veterinary Clinics of North America Small Animal Practice 25: 257-273 [ Links ]
9. Gerritzen-Bruning M J, van den Ingh T S, Rothuizen J 2006 Diagnostic value of fasting plasma ammonia and bile acid concentrations in the identification of portosystemic shunting in dogs. Journal of Veterinary Internal Medicine 20: 13-19 [ Links ]
10. Gregory LC 2001 Metabolic analytes. In Christenson R H, Gregory L C, Johnson L I (eds) Appleton & Lange's outline review: clinical chemistry. McGraw-Hill, New York: 121-124 [ Links ]
11. Hess P R, Bunch S E 2000 Diagnostic approach to hepatobiliary disease. In Bonagura D G (ed.) Kirk's current veterinary therapy Vol. XIII. W B Saunders, Philadelphia: 659-664 [ Links ]
12. Hoe C M, Harvey D G 1961 An investigation into liver function tests in dogs; Part 2; Tests other than transaminase estimations. Journal of Small Animal Practice 2: 109-127 [ Links ]
13. Huxtable C R R 2003 The liver and exocrine pancreas. In Robinson W F, HuxtableCRR (eds) Clinicopathologic Principles for veterinary medicine (2nd edn). Cambridge University Press, Cambridge: 194-215 [ Links ]
14. Kruger J M, Osborne C A 1986 Etiopathogenesis of uric acid and ammonium urate uroliths in non-Dalmatian dogs. Veterinary Clinics of North America Small Animal Practice 16: 87-126 [ Links ]
15. Kummeling A, Teske E, Rothuizen J, van Sluijs F J 2006 Coagulation profiles in dogs with congenital portosystemic shunts before and after surgical attenuation. Journal of Veterinary Internal Medicine 20: 1319- 1326 [ Links ]
16. Lassen E D 2004 Laboratory evaluation of the liver. In Thrall M A, Baker D C, Campbell T W, DeNichola D, Fettman M J, Lassen E D, Rebar A, Weiser G (eds) Veterinary haematology in clinical chemistry (1st edn). Lippincott Williams & Wilkins, Philadelphia: 355-376 [ Links ]
17. Lathem W, Davis B B, Rodnan G P 1960 Renal tubular secretion of uric acid in the mongrel dog. American Journal of Physiology 199: 9-12 [ Links ]
18. Leary W P, Reyes A J 1987 Angiotensin I converting enzyme inhibitors and the renal excretion of urate. Cardiovascular Drugs and Therapy 1: 29-38 [ Links ]
19. Malherbe W D 1959 Intrahepatic cholestasis in a Rhodesian ridgeback dog: a clinicopathological study. Journal of the South African Veterinary Medical Association 30: 113-124 [ Links ]
20. Meyer D J, Williams D A 1992 Diagnosis of hepatic and exocrine pancreatic disorders. Seminars in Veterinary Medicine and Surgery (Small animal) 7: 275-284 [ Links ]
21. Miller G E, Danzig L S, Talbott J H 1951 Urinary excretion of uric acid in the Dalmatian and non-Dalmatian dog following administration of diodrast, sodium salicylate and a mercurial diuretic. American Journal of Physiology 164: 155-158 [ Links ]
22. Morgan H C 1959 A comparison of uric acid determinations and sulphobromophthalein sodium retention tests as an index to canine liver dysfunction. American Journal of Veterinary Research 20: 372-377 [ Links ]
23. Mudge G H, Cucchi J, Platts M, O'Connell J M, Berndt W O 1968 Renal excretion of uric acid in the dog. American Journal of Physiology 215: 404-410 [ Links ]
24. Newman D J, Price C P 2001 Non-protein nitrogen metabolites. In Burtis C A, Ashwood E R (eds) Tietz's fundementals of clinical chemistry. W B Saunders, Philadelphia: 422-426 [ Links ]
25. Pea F 2005 Pharmacology of drugs for hyperuricemia. Mechanisms, kinetics and interactions. Contributions to Nephrology 147: 35-46 [ Links ]
26. Poldervaart J H, Favier R P, Penning L C, van den Ingh T S, Rothuizen J 2009 Primary hepatitis in dogs: a retrospective review (2002-2006). Journal of Veterinary Internal Medicine 23: 72-80 [ Links ]
27. Rothuizen J, Bunch S E, Charles J A, Cullen J M, Desmet V J, Szatmari V, Twedt D C, van den InghTSGAM,Van Winkle T, Washabau R J 2006 WSAVA Standards for clinical and histological diagnosis of canine and feline liver diseases. Saunders Limited, London [ Links ]
28. Safra N, Ling G V, Schaible R H, Bannasch D L 2005 Exclusion of urate oxidase as a candidate gene for hyperuricosuria in the Dalmatian dog using an interbreed backcross. Journal of Heredity 96: 750-754 [ Links ]
29. Safra N, Schaible R H, Bannasch D L 2006 Linkage analysis with an interbreed backcross maps Dalmatian hyperuricosuria to CFA03. Mammalian Genome 17: 340-345 [ Links ]
30. Smith S T 1996 Non-protein Nitrogen. In Bishop M L, Duben-Engelkirk J L, Foden F P (eds) Clinical chemistry: Principles, procedures and correlations. Lippincot-Raven Publishers, Philadelphia: 348-350 [ Links ]
31. Stockham S L, Scott M A 2002 Liver function. In Stockham S L, Scott M A (eds) Fundamentals of veterinary clinical pathology. Blackwell Publishing, Ames: 461-486 [ Links ]
32. Sutherland R J 1989 Biochemical evaluation of the hepatobiliary system in dogs and cats. Veterinary Clinics of North America Small Animal Practice 19: 899-927 [ Links ]
33. Tisdall P L, Hunt G B, Tsoukalas G, Malik R 1995 Post-prandial serum bile acid concentrations and ammonia tolerance in Maltese dogs with and without hepatic vascular anomalies. Australian Veterinary Journal 72: 121-126 [ Links ]
34. Willard M D, Twedt D C 2004 Gastrointestinal, pancreatic and hepatic disorders. In Willard M D, Tvedten H (eds) Small animal clinical diagnosis by laboratory methods. Saunders Elsevier, St Louis: 208-246 [ Links ]
35. Winkler J T, Bohling M W, Tillson D M, Wright J C, Ballagas A J 2003 Portosystemic shunts: diagnosis, prognosis, and treatment of 64 cases (1993-2001). Journal of the American Animal Hospital Association 39: 69-185 [ Links ]
36. Yonetani Y, Ishii M, Iwaki K 1980 Hyperuricemia induced by some antihypertensives and uricosuric drugs in oxonatetreated rats. Japanese Journal of Pharmacology 30: 29-840 [ Links ]
37. Young D S 1997 Effects of drugs on clinical laboratory tests. Annals of Clinical Biochemistry 34: 579-581 [ Links ]
Received: June 2010.
Accepted: May 2011.
* Author for correspondence. E-mail: hillj@ampath.co.za

