


Servicios Personalizados
Articulo
 Inglés (pdf)
 Articulo en XML
 Referencias del artículo
Indicadores

Links relacionados
-
 Citado por Google
 -
 Similares en Google
Compartir

 Permalink
South African Journal of Sports Medicine
versión On-line ISSN 2078-516X
versión impresa ISSN 1015-5163
SA J. Sports Med. vol.35 no.1 Bloemfontein 2023
http://dx.doi.org/10.17159/2078-516X/2023/V35I1A16880
REPORTS
SA Rugby Injury and Illness Surveillance and Prevention Project (SARIISPP) - The Currie Cup Premiership Competition Injury Surveillance Report 2022
Lara PaulI; Clint ReadheadII; Wayne ViljoenIII; Mike LambertIV
ICurrie Cup Injury Surveillance Manager
IISA Rugby, Senior Manager: Medical, and University of Cape Town
IIISA Rugby, Senior Manager: Rugby Safety, and University of Cape Town
IVUniversity of Cape Town
Introduction
In 2014, the South African Rugby Union (SA Rugby) introduced a standardised injury surveillance format for the Currie Cup Premiership Division Competition as part of the SA Rugby Injury and Illness Surveillance and Prevention Project (SARIISPP). This format required the team's medical doctor or medical support staff to record all relevant injury data from matches and training sessions using the standardised BokSmart injury surveillance data capture format. The definitions and reporting format used in this system are aligned with the recent IOC consensus statement for injury recording in sport [2], and with the consensus statement on injury definitions and data collection procedures for studies of injuries in rugby union [3].
Injury surveillance is an essential step in injury prevention. Specifically, injury surveillance is important for developing injury prevention strategies, and assessing their efficacy and effectiveness after implementation. By capturing injury surveillance in a standardized format, it becomes possible to compare injury rates between teams participating in the same tournament, to track tournament injuries over consecutive years, and compare findings with other rugby injury surveillance studies. This standardised approach enables comprehensive analysis and enhances the ability to make well-informed evidence-based decisions regarding injury patterns and potential prevention strategies.
Reports on rugby tournament injuries typically present the injury numbers as a rate (or incidence) i.e., the total number of injuries divided by the total amount of time exposed to the risk of experiencing an injury. The standardised format is to present the number of injuries per 1000 player exposure hours. Match exposure hours are calculated as the number of matches played multiplied by the number of exposed players (30) and the match duration (80 mins); for team-specific match-related exposure 15 players would be utilised. Training exposure hours are calculated as the average number of players present at training multiplied by the average time spent training each week. These values are then summed to obtain the training exposure hours over the competition period. In this report the standardised injury rates have been provided to allow for comparison with other reports. Every effort has been made to present these rates on a 'per team' and 'per match' basis for easier and more practical interpretation.
Since 2016, the Currie Cup medical doctors and medical support staff were asked to record the physical return to play date of the injured players, thereby allowing for the actual severity of the injury to be calculated. Injury burden is a combination of the injury rate and severity and is expressed as the number of days absent from training and matches per 1000 player hours. Throughout this report, only actual, rather than predicted severity is used for analysis.
The report includes data from the 2014 and 2015 seasons only in those sections that report on injury numbers and incidence. The sections that report on injury severity and burden begin with the 2016 season, which was the first-time actual severity data was collected.
In the Currie Cup 2020/21 seasonal report, the South African Rugby Injury and Illness Surveillance and Prevention Project (SARIISPP) began capturing Time-Loss training injuries and training exposure data. This addition enables SARIISPP to gain a more comprehensive understanding of injury data by combining match and training exposure and injury data.
An inherent bias with most injury surveillance studies is that the teams' medical doctors or medical support staff are responsible for entering their team's injury data. As no audit process is done on the collection of these data, in many cases, the accuracy of the data depends on the compliance of the medical doctors or medical support staff. This potential limitation is present in most injury surveillance studies. To minimise this potential limitation, SARIISPP had a project coordinator who maintained regular communication with the medical doctors or medical support staff. This ensured that data capturing was up to date.
The Currie Cup 2022 semi-finals were contested between Airlink Pumas vs. Toyota Cheetahs and Vodacom Blue Bulls vs. Windhoek Draught Griquas. The final was between Airlink Pumas vs. Windhoek Draught Griquas, with the Airlink Pumas eventually winning the tournament for the first time in history.
Definitions
All definitions are originally based on the 2007 consensus statement for injury reporting in rugby union [3] and have since been realigned with the latest International Olympic Committee (IOC) consensus statement for methods of recording and reporting epidemiological data on injury and illness in sport [2].
MEDICAL ATTENTION INJURY:
All injuries that were seen by the teams' medical doctor or medical support staff were classified as Medical Attention injuries. These injuries are defined by the 2007 statement as an "Injury that results in a player receiving medical attention" [3], and by the more recent IOC statement as "a health problem that results in an athlete receiving medical attention" [2]. For clarity, this means an injury sustained by a rugby union player during a match or training session that prevented or would have prevented the player from taking full part in all rugby training activities and/or match play for more than 1 day following the day of injury, irrespective of whether match or training sessions were scheduled [4].
TIME-LOSS INJURY:
Medical Attention injuries were further categorised as Time-Loss injuries, where appropriate, and defined by the 2007 statement as, "an injury that results in a player being unable to take a full part in future rugby training or match play" [3]. The IOC definition is, "a health problem that results in a player being unable to complete the current or future training session or competition" [2].
INJURY RATE:
For this report, an injury rate is defined as the number of injuries expressed per 1000 player exposure hours. This method of expressing injury rate has been used in previous years' reports of the Currie Cup Premiership tournament and other international literature, and therefore makes comparisons easy. Moreover, the injury rate is expressed as a mean with 95% confidence intervals. A 95% confidence interval around a mean value indicates that there is a 95% chance (i.e., very high chance) that the true value falls within this range. In this report, we present the 95% confidence intervals assuming normal distribution of the data and use the approach of examining the overlap of the confidence intervals, to determine whether the injury incidences are significantly different; if the range of confidence interval values of two comparisons do not overlap, there is a strong chance (95%) that their injury rates are different from each other. We have opted for this method because it is easy to use, conservative and less likely to produce false positive results [5].
MEDIAN (INTERQUARTILE RANGE):
When numbers are ordered from the lowest to highest, the median is the value which separates the higher half of the values from the lower half of the values. Simply put, it is the middle value of a list of ranked numbers. The interquartile range (IQR) describes the spread of the data. When rank-ordered data are divided into quartiles the first and the third quartile represents the value under which 25% and 75% of the data points fall, respectively. As an example, consider a team with a median injury severity of 32 days (IQR 7 to 40). This means that when the teams' injury severities are ranked in order the mid-point or median of the injury severities is 32 days. Also 25% of their injuries result in 7 or less days absent from training and matches and 25% of their injuries result in 40 days or more absent from training and matches.
NEW, SUBSEQUENT AND RECURRENT INJURIES:
In 2022, in the Currie Cup Premiership Division Competition, a 'New Injury' was defined as when a player sustained his first injury. Any injury the same player sustained after this initial injury was defined as a 'Subsequent Injury'.
According to the IOC statement, any subsequent injury to the same site and of the same type is referred to as a 'Recurrence' if the index injury was fully recovered before reinjury, and as an 'Exacerbation' if the index injury was not yet fully recovered [2].
To provide more detail on the subsequent injuries for practitioners, we have further categorized the subsequent injuries in this report into one of four groups based on the Orchard Sports Injury and Illness Classification System (OSIICS) classification diagnosis:
- Different site - Different type
- Different site - Same type
- Same site - Different type
- Same site - Same type
According to the 2007 Consensus Statement for rugby, any subsequent injury classified as 'Same site - Same type' was a 'Recurrent injury' [3].
INJURY SEVERITY:
The total severity of an injury is defined as "the number of days that have elapsed from the date of injury to the date of the player's return to full participation in team training and availability for match selection" [2,3].The actual severity of each injury is classified by the severity groupings provided in the 2007 consensus statement; Slight (0-1 days lost), Minimal (2-3 days lost), Mild (4-7 days lost), Moderate (8-28 days lost), Severe (>28 days lost), Career ending and Non-fatal catastrophic [3]. To align with the latest IOC statement the injuries have been re-grouped to reflect the severity groupings '1-7 days', '8-28 days' and '>28 days' [2].
The average severity represents the average number of days lost per injury when dividing the accumulated total number of days lost by the total number of injury events. For example, a team may have a total severity of 550 days absent, accumulated from 22 injuries. The average severity of the team's injuries would therefore be 550/22, which equals, on average 25 days absent per injury.
INJURY BURDEN:
Injury burden is determined by the combination of injury rate and severity. It is calculated by multiplying the injury rate by the average severity (number of days lost due to injury) and is expressed as the number of days absent per 1000 player hours. For example, consider a team with an injury rate of 75 injuries per 1000 player exposure hours, and an average severity of 38 days lost per injury. In this case, the injury burden for the team would be calculated as 2850 days absent per 1000 player hours (i.e., 75 x 38 = 2850).
OPERATIONAL INJURY BURDEN:
The operational burden is the expected number of days lost per injury per team for every match played over the tournament or season. The measure is an extrapolation of injury rates and severities over a season and includes the most severe injuries together with the least severe injuries in its estimation. For example, if a team has an operational injury burden of 2 days, it means that based on their injury rates and average severity, on average, 2 days absence can be expected from every match injury the team sustains.
META-ANALYSIS:
A meta-analysis is a study using statistical methods to combine multiple scientific studies with varying levels of evidence on the same topic. The goal is to determine overall defining patterns and results based on the combined data. As such, it represents the highest level of scientific evidence available. The findings in this report are compared to the data in the most recent meta-analysis, which was published in 2021. The meta-analysis specifically focuses on rugby union injuries at an elite professional level [1].
MATCH INJURIES
Injured players
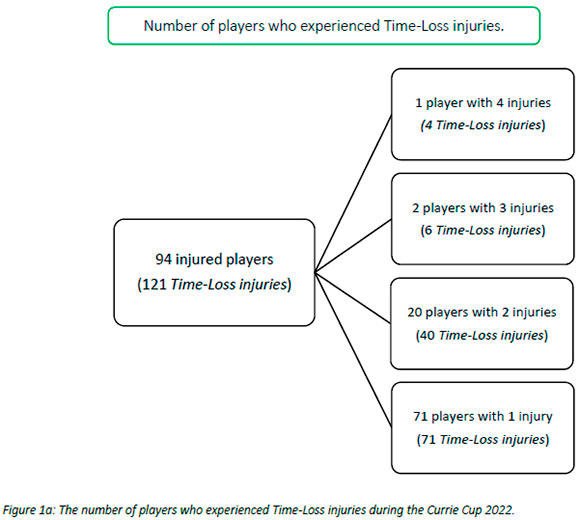
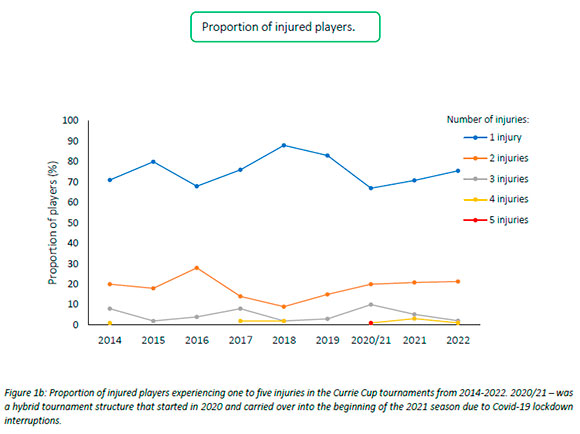
During the Currie Cup 2022, 94 players sustained a total of 121 Time-Loss injuries. Due to squad changes over the tournament duration for various reasons, a total number of 330 different players were physically exposed to injury at some point while playing rugby matches as part of the Currie Cup 2022 tournament. However, for analysis and exposure calculation purposes, we assumed a total of 161 players were available for playing rugby on match days in the tournament (7 teams x 23 players per match-day squad). Fifty-eight percent (58%) of the 161 available match-day players sustained a match injury during the tournament (Figure 1a). The proportion of players who sustained one Time-loss injury increased slightly from 2021 to 2022. Furthermore, the proportion of players who experienced 3 or 4 injuries decreased similarly from 2021 to 2022 (Figure 1b). Only the absolute number of Time-loss injuries were analysed further in this report (n = 121), regardless of the number of players who sustained them.
Overall Injury Rate
Only Time-loss injuries have been analysed in this report because these injuries are more comparable between different teams, tournaments and with the published scientific literature [1]. As mentioned previously, Time-loss injuries resulted in players missing a match or training session.
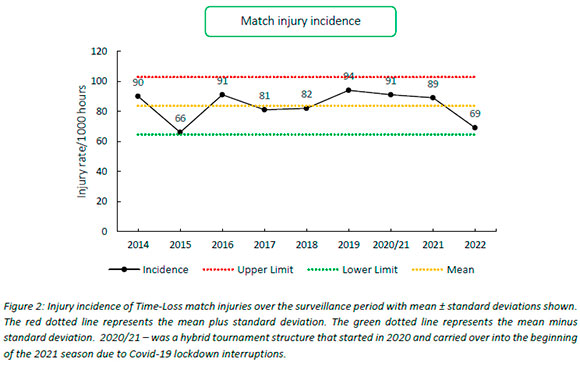
The overall match injury incidence for the Currie Cup 2022 was 69 (57 to 81) injuries per 1000 player exposure hours: the lowest injury rate since 2015. The 2022 Currie Cup tournament's injury rate is however not significantly different to the international meta-analysis injury rate of 91 (77 to 106) injuries per 1000 player hours [1] and falls within the season-to-season variation for the Currie Cup, based on the last 8 years' collective data (Figure 2). An injury incidence of 69 injuries per 1000 player hours equates to 1.4 injuries per team per match.
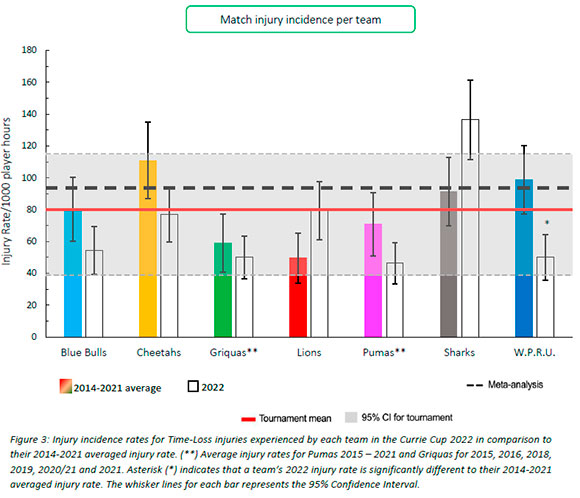
When comparing the team's 2014-2021 averaged tournament injury incidence to their 2022 season's injury incidence data, the DHL Western Province experienced a significantly lower injury incidence rate in 2022 (Figure 3). The Sharks had a significantly higher injury rate compared to all other teams in 2022. No team showed significantly higher injury incidences than their 2014-2021 tournament averages.
Overall, the combined average injury incidence of 80 (39 to 115) injuries per 1000 player hours for all the teams over the last 9 years is similar to the international meta-analysis summary of 91 (77 to 106) injuries per 1000 player hours [1] .
Injury incidence over the season
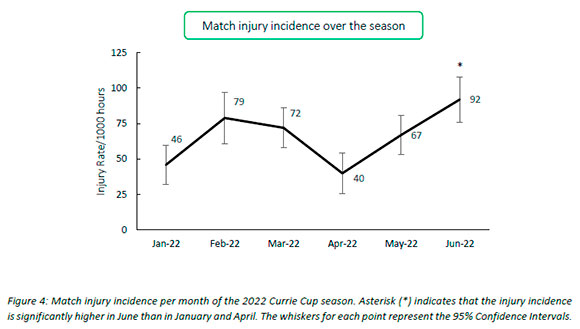
The 2022 Currie Cup tournament consisted of two rounds of matches and took place from January to June. Unlike previous years, when the competition was held in the second half of the year and either had one or two rounds, this year's format was changed to a double round competition in the first half of the year. When examining the Time-loss injury incidence during the 2022 Currie Cup tournament, it was found that the injury incidence in June was significantly higher compared to January and April. Throughout the other months in the 2022 season, there were no significant differences (Figure 4).
Overall Severity
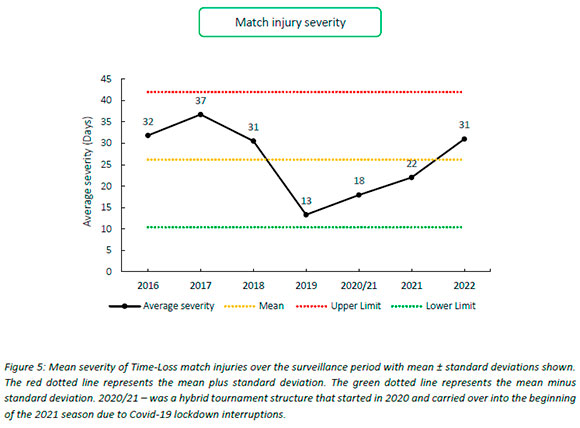
The average severity of match injuries for the Currie Cup 2022 was 31 days, which is higher than the averaged severities for the Currie Cup tournament 2016-2021 (25 days) but was within the expected season-to-season variation (Figure 5). There has been a consistent increase in match severity since 2019, although it has not exceeded the level observed between 2016 and 2018. The median severity in 2022 was 19 days (IQR 10 to 44). This means that the half-way mark of the injury severities was 19 days, with 25% of all Time-Loss injuries lasting 10 days or less and 25% lasting 44 days or longer.
When the medical doctors or medical support staff clinically assessed the injured player, they recorded the injury time from the date the injury occurred, as the starting date. Similarly, when the player returned to full participation in team training and availability for match selection, the return to play date was recorded. The injury severity was determined from the difference between these two dates.
These data are grouped to align with the latest IOC statement. The severity groupings include '1-7 days', '8-28 days' and '>28 days' [2].
Figure 6 compares the injury severity rates for the Currie Cup 2022 tournament to the averaged injury severity rates of the 2016-2021 tournaments. Injury rates in the severity category of '1-7 days' were significantly lower in 2022 compared to their 2016-2021 average (Figure 6). Interestingly, the injury severity categories in 2022 show a trend towards more severe injuries as opposed to the trend demonstrated by the 2016-2021 accumulated data, which has a trend towards the less severe injuries.
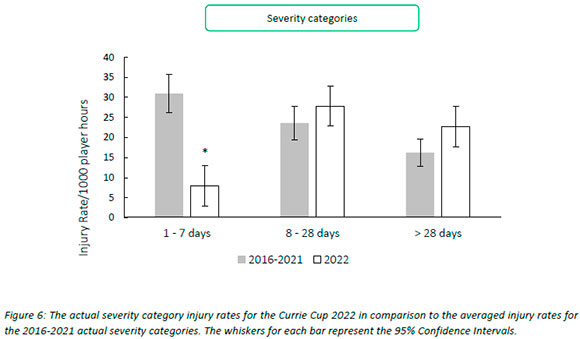
Table 1 describes the actual severity of each teams' Time-Loss injuries for the Currie Cup 2022. The Airlink Pumas have been used as a worked example to explain Table 1. The Airlink Pumas sustained 0.9 injuries per match, meaning that for every 1.1 matches played, they sustained one injury. The Airlink Pumas lost 163 training and match days due to injury. This equates to an average of 13 training and match days lost for every injury sustained. The burden of the team's injuries equates to 582 days lost per 1000 player hours. Translating this to an operational burden per match shows that the Airlink Pumas lost 11.6 days per injury per match over the season. The median injury severity for the Airlink Pumas was 11 days (IQR 10 to 27). This means that when severities of the Airlink Pumas Time-Loss injuries were rank ordered, the midpoint of the severities was 11 days off from rugby, with 25% of their injuries lasting equal to or less than 10 days off and 25% of their injuries lasting equal to or longer than 27 days off.
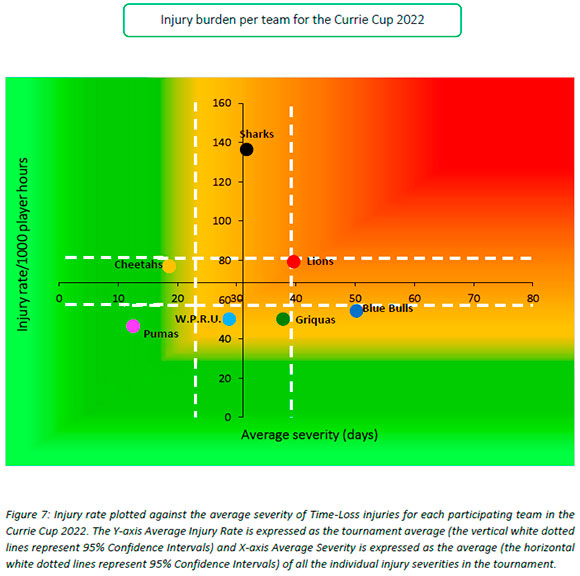
The Cell C Sharks had the highest Time-Loss injury rate by quite some distance, followed by the Sigma Golden Lions and then Toyota Free State Cheetahs. In contrast, the Airlink Pumas had the lowest injury rate, the lowest severity, and by extension the lowest injury burden per team (Table 1; Figure 7). It has been shown in previous studies that teams with lower injury rates had more success in the Currie Cup competition [6, 7]. It has also been shown that injury burden needs to be considered for success and not simply injury rates alone [8]. Teams who fall in the green zone (below average and 95%CI), will generally not be impacted as much by their injury burden, regardless of whether their injury rate or average severity is relatively high. As soon as the combination of rate and severity moves into the orange (close to average) and/or red zone (above average and 95% CI), the impact on team performance and player availability becomes more problematic. None of the teams participating in the 2022 Currie Cup were in the red zones. However, Cell C Sharks showed the highest injury burden because of their combination of high injury rates and severity. This was followed by the Sigma Golden Lions.
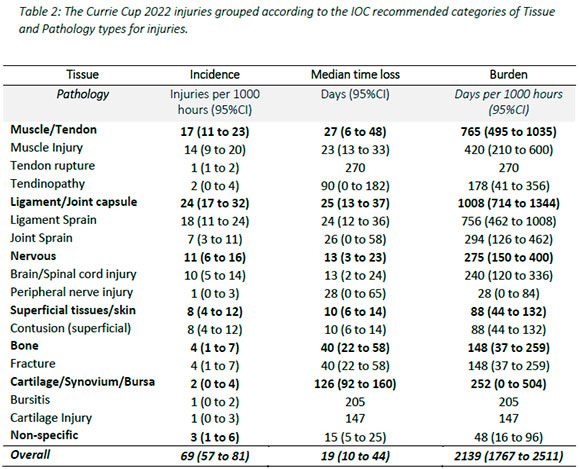
All the data in this report are aligned with the 2019 IOC consensus statement [2] and are further presented as such to compare against previous season reports and the international meta-analysis [1]. Table 2 presents the Currie Cup 2022 injury data in the format recommended by the 2019 IOC consensus statement. This table provides an overview of the Tissue and Pathology types of injuries sustained during the 2022 season. This format is used throughout this report.
New, Subsequent and Recurrent Injuries
During the Currie Cup 2022, the overall injury incidence for New injuries was 53 (43 to 64) injuries per 1000 player hours. This is a similar injury rate to the Currie Cup 2021.
Seventy-one players experienced only one injury during the Currie Cup 2022 season (76% of all injured players). Sixty-six percent (66%) of subsequent injuries to those 23 players sustaining multiple injury events during the season (Figure 1a), occurred at a different anatomical site and were of a different type when compared to the initial index injury. 'Different site - different type', 'different site - same type' and 'same site - different type' are classified as subsequent new injuries. Figure 8 shows the percentage subsequent Time-loss injuries.
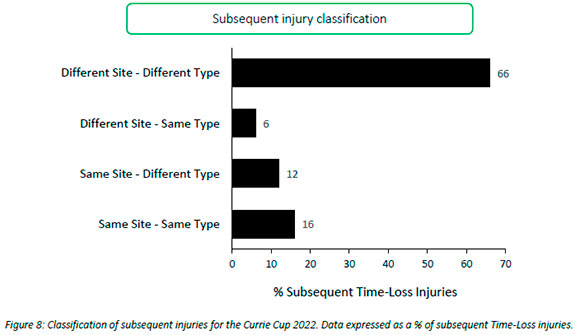

A subsequent recurrent injury was any subsequent injury classified as 'same site - same type', which refers to the same location and same tissue type involved as the original index injury. Only four subsequent recurrent injuries occurred in the Currie Cup 2022.
The injury incidence in 2022 for subsequent recurrent injuries was 3 (0 to 5) injuries per 1000 player hours, which is slightly lower than the 2021 tournament's injury incidence of 4 (1 to 7) injuries per 1000 player hours.
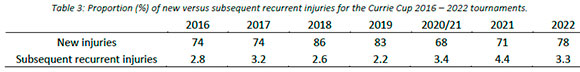
There is a slight increase in the proportion of new injuries and a corresponding decrease in subsequent recurrent injuries compared to the Currie Cup 2021 tournament (Table 3).
Injury Type
Overall, Ligament sprain was the most common Time-loss injury during the Currie Cup 2022 (26%), followed by Muscle (rupture/strain/tear) injuries (21%).
The median severity for Ligament sprain injuries was 24 days with 25% of injuries resulting in 13 or less days absent from training and matches, and 25% of injuries resulting in 75 or more days absent from training and matches (Table 4). The average severity was 42 days absent.
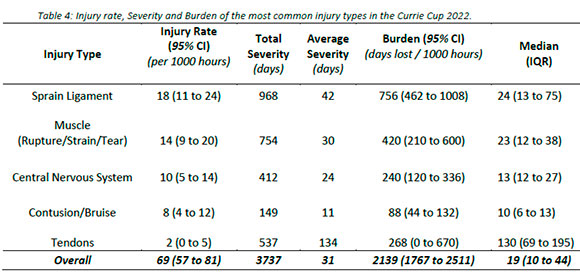
Figure 9 shows the injury burden for the period 2016-2022. Ligament sprain followed by muscle injury were the two injury types with the highest burden when data were combined for the 2016-2022 Currie Cup tournaments. These injury types have the highest combination of injury incidence and average severity of injury. Consistent with previous reports, these two injury types continue to dominate across the different teams.
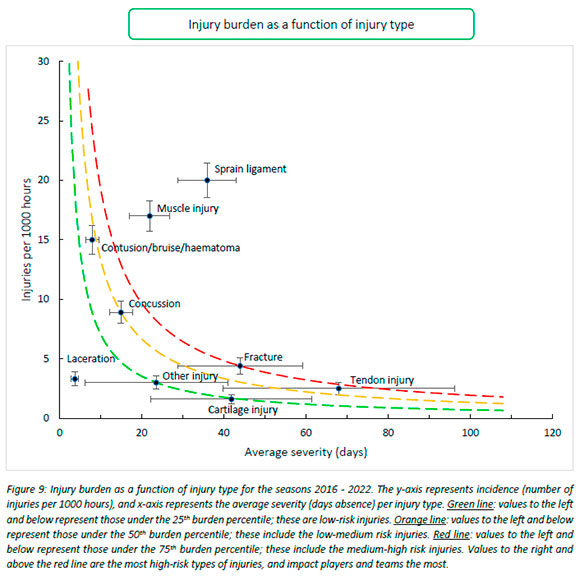
The most common Time-loss injuries during the Currie Cup 2022 tournament were joint (non-bone)/ligament injuries (comprised of dislocation/subluxation and sprain/ligament injuries) at 21 (14 to 28) injuries per 1000 player hours. The average severity of joint (non-bone)/ligament injuries in the Currie Cup 2022 was 38 (27 to 49) days.
Following joint (non-bone)/ligament injuries, muscle/tendon injuries (comprised of muscle rupture/strain/tear, tendon injury/rupture and tendinopathy injuries) were the next most common injury. The injury rate for muscle/tendon injuries was 17 (11 to 23) injuries per 1000 player hours. The average severity for muscle/tendon injuries was 36 (23 to 50) days. The injury incidence for the central nervous system during the Currie Cup 2022 was recorded at 10 (5 to 14) injuries per 1000 player hours. The average severity for central nervous system injuries was 24 (13 to 35) days.
Injury Diagnosis [9]
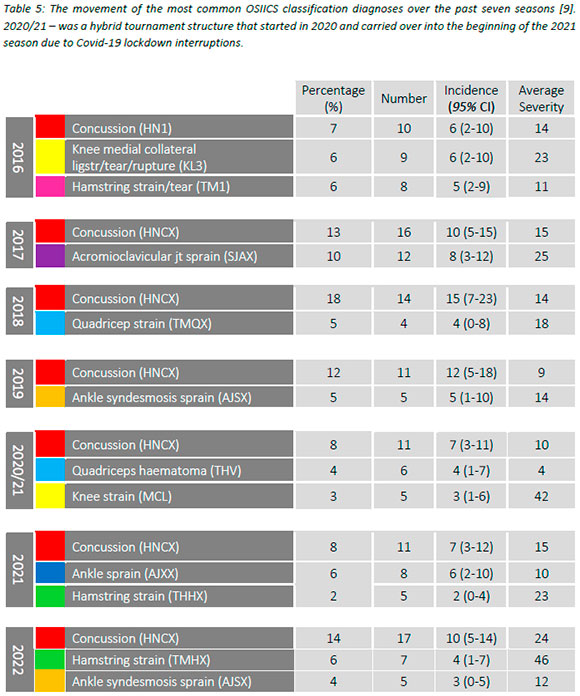
The most common Orchard Sports Injury Classification System (OSIICS) diagnosis [10] in the Currie Cup 2022 was Concussion (OSIICS code = HNCX) followed by Hamstring Strain (TMHX) (Table 5).
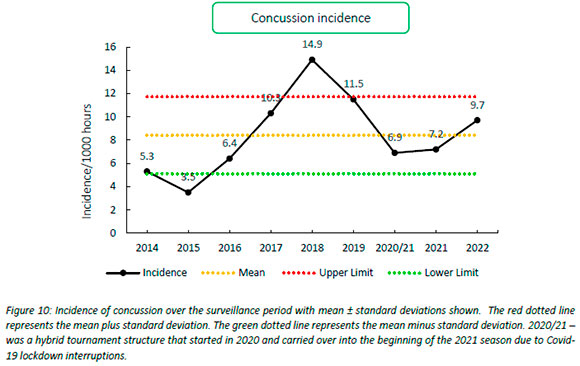
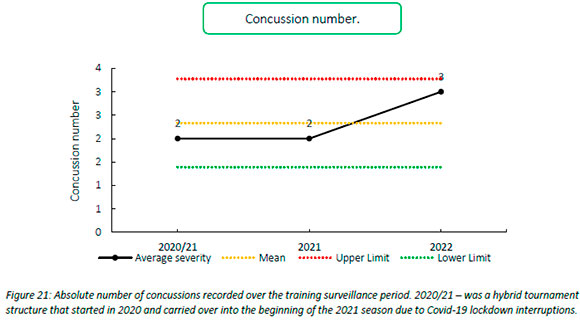
Concussions
Overall, concussions contributed to 17 injuries throughout the Currie Cup 2022 (14%). From 2020/21 to 2022, concussion rates have increased. Concussion incidence increased from 7.2 injuries per 1000 player hours in 2021 to 9.7 injuries per 1000 player hours in the Currie Cup 2022 tournament. This still falls within the expected season-to-season variation for the Currie Cup (Figure 10), with an overall grouped tournament average of 8.4 concussions per 1000 player hours over the data collection period. The average severity of concussions reported in the 2022 tournament was 24 days with a median of 13 days (IQR 12 - 27 days). The current South African Rugby concussion regulations do not normally allow for adult players to return to playing rugby within less than 12 days of the concussive event. Since this competition is held at the professional level and is a World Rugby approved tournament, the medical practitioners implement Advanced Care protocols. These protocols can potentially enable a player to return to play in less than 12 days. These regulations have recently been amended by World Rugby.
Advanced care clinical settings are defined in the World Rugby and SARU's Concussion Guideline documents:
(a) World Rugby Concussion Guideline document: https://playerwelfare.worldrugby.org/
(b) SARU's Concussion Guideline documents (When can a player safely return-to-play following a concussion): www.boksmart.com/concussion, and on MyBokSmart: https://my.boksmart.com/Documents/BokSmart#ConcussionManagement
Figure 11 shows the proportion of concussions caused by different injury events. Overall, the number of concussions increased since 2021. The main causes of concussion during the Currie Cup 2022 were Tackling (35%), followed by the Ruck (24%).
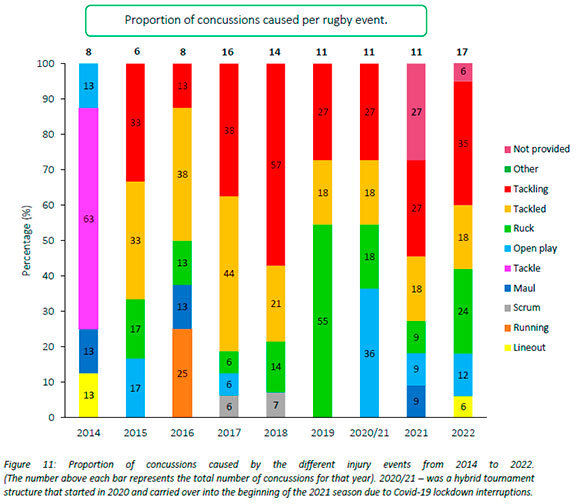
Figure 12 presents the mechanisms contributing to concussions in Tackling, Tackled, Ruck and the remaining concussion causing injury events from 2015 - 2022. Data have only been presented from 2015 onwards as Tackle related data were not captured separately for the Tackler and Ball Carrier in 2014.
Region of Injury
The shoulder and head were the most frequently injured body locations during the Currie Cup 2022 tournament (17% each), followed by the ankle (15%). Joint injuries (n = 6), followed by ligament injuries (n = 5), contributed to the most shoulder injuries. Concussions (n = 17) contributed to the most head injuries, whereas ligament injuries (n = 16) contributed to the most ankle injuries. Ligament injuries (n = 6) also accounted for most knee injuries. This was followed by joint injuries (n = 4), and muscle strain/spasm injuries (n < 3). Muscle strain/spasm injuries (n = 14) contributed to the most thigh injuries.
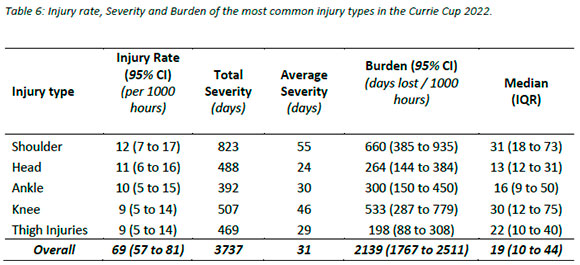
The average severity for shoulder injuries was 55 days absent and injury burden 660 days absent per 1000 player hours: the highest injury severity and burden. This was followed by knee injuries with 46 and 533 days respectively. Head injuries had an average severity of 24 days absent, and an injury burden of 264 days absent per 1000 player hours. Thigh injuries had the lowest average severity of 29 days absent, and an injury burden of 198 days absent per 1000 player hours. The median severity of shoulder injuries was the highest in the Currie Cup 2022 at 31 days absent. Twenty-five percent of shoulder injuries resulted in 18 or less days lost from training and matches, and 25% of all shoulder injuries resulted in 73 or more days lost from training and matches (Table 6).
When analysing the changes in incidence of the most injured body locations for the Currie Cup over the past seven seasons (2016-2022), the head consistently ranks high on the list of the most frequently injured body locations. However, the shoulder has taken the top spot and increased by 6% since the 2021 season with knee injuries moving down the list (Table 7).
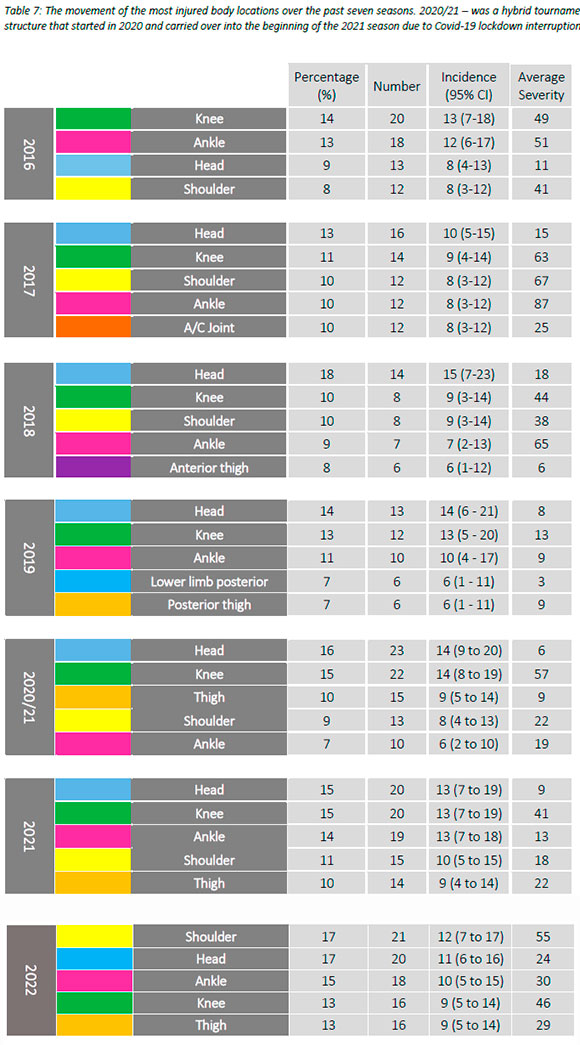
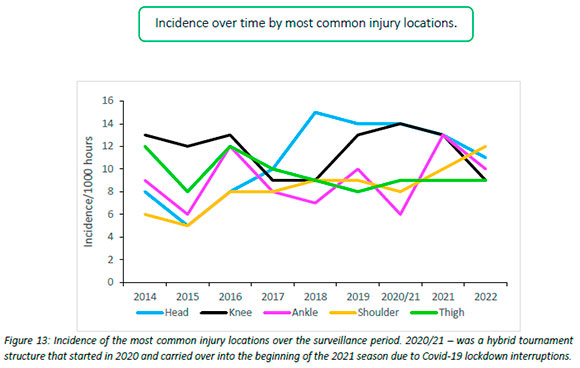
Figure 13 displays the movement of the most common injured body locations over the surveillance period (2014-2022). When examining the injury incidence patterns over the past nine years, a clear upward trend can be observed in shoulder injuries since the 2020/21 season, with a gradual increase since 2015. In the 2022 season, shoulder injuries reached the highest level recorded in the past nine years. Thigh injuries have levelled out over the past three years. Head injuries increased initially from 2015 to 2018, after which they stabilised and are on a downward trend since then (Figure 13). The trend is not the same, but the head injury data here links directly to the concussion section earlier in the report, since most head injuries were attributed to concussions.
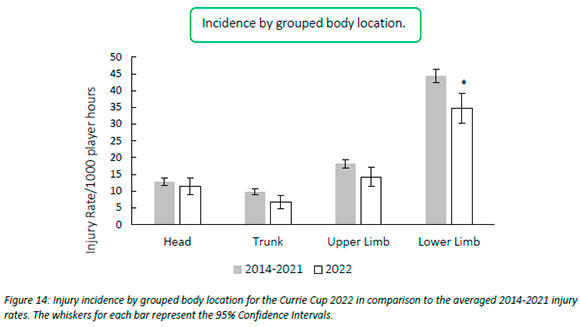
During the Currie Cup 2022, lower limb injury rates were significantly lower than their 2014-2021 averaged injury rates (Figure 14). During the Currie Cup 2022, the shoulder and head areas had the highest injury rates, with 12 (7 to 17) and 11 (6 to 16) injuries per 1000 player hours, respectively. The shoulder injury rate is similar to the meta-analysis [1] injury rate of 12 (10 to 14) injuries per 1000 player hours and the head injury rate was lower than that of the international meta-analysis [1] of 17 (14 to 20) injuries per 1000 player hours.
Injury Event
The Tackle (Ball Carrier) event accounted for the most injuries in the Currie Cup 2022 (24%, n = 29), followed by Open Play, accounting for 18% of injuries (n = 22) (Table 8). When comparing injury rates to the international meta-analysis, being tackled at 17 (11 to 23) injuries per 1000 player hours during the Currie Cup 2022 was similar to the meta-analysis results of 23 (21 to 25) injuries per 1000 player hours. Tackle (Tackler) injury rate in the Currie Cup 2022 at 11 (6 to 16) injuries per 1000 player hours was significantly lower than the meta-analysis rate of 23 (21 to 25) injuries per 1000 player hours. Albeit less than being tackled in incidence, the average and median severity of injuries to the tackler were notably greater. Ruck injury rate during the 2022 season at 9 (4 to 13) injuries per 1000 player hours was similar to the meta-analysis injury rate of 9 (7 to 11) injuries per 1000 player hours [1].
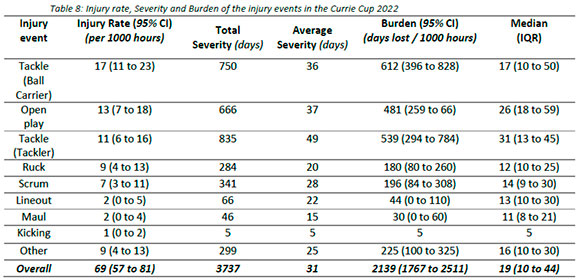
Figure 15 combines all the injury types from 2016 - 2022 and presents the injury burden picture over the past seven years. Injuries caused by Tackling have the highest injury burden for all teams, followed closely by injuries from being tackled. Both these injury events have a high combined injury incidence and average severity. Open play followed closely behind these two injury-causing events.
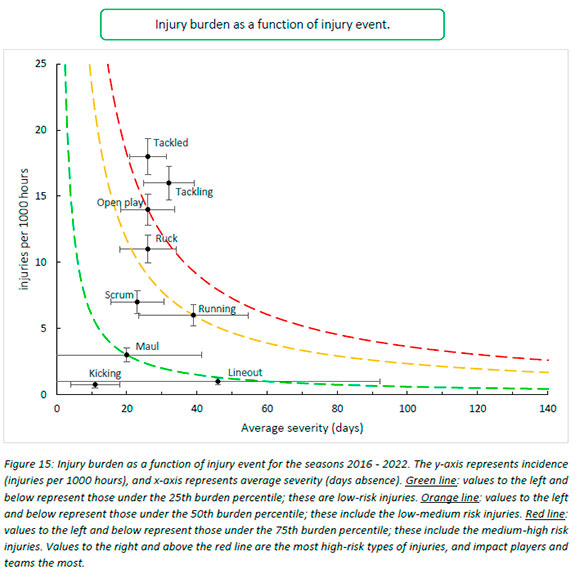
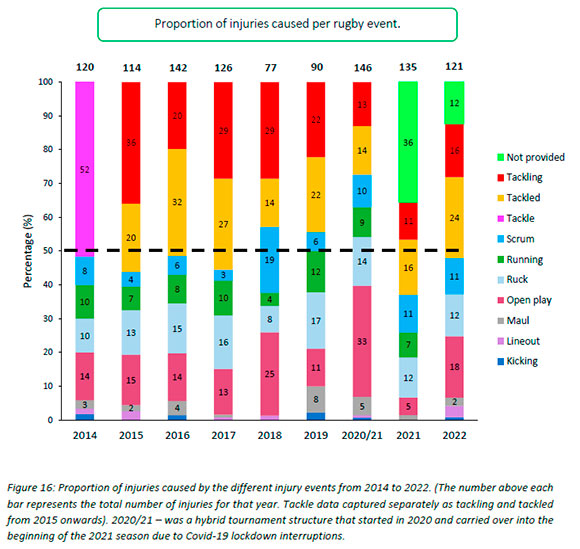
Figure 16 illustrates the proportion of injuries caused by different injury events from 2014 to 2022. Over the past six seasons, the rate of injuries caused by tackles has varied. Notably, the proportion of tackling-related injuries has remained relatively lower over the last three years.
Venue
Matches were played at eight different stadia during the tournament. This is the first year that the Danie Craven Stadium was used during the Currie Cup tournament and was only used for one match. Danie Craven Stadium's injury burden is far above the average injury burden and recorded the highest burden to date (Figure 17). Although with only one match played at the Danie Craven Stadium and the large 95%CI, one cannot draw any major conclusions. In 2022, Jonsson Kings Park's injury burden was significantly higher than its 2016-2021 injury burden average, whereas Mbombela Stadium's injury burden was significantly lower than its 2016-2021's injury burden average.
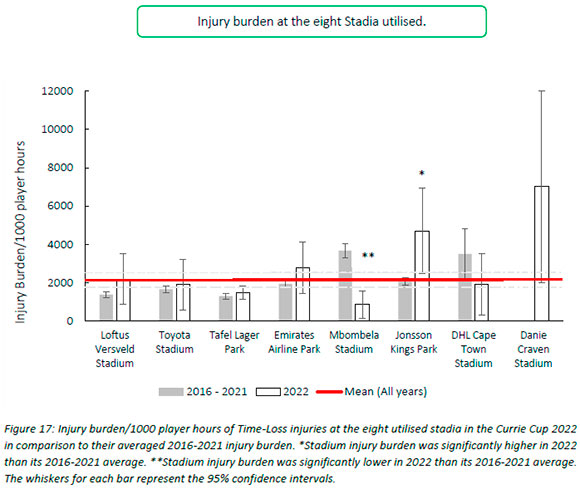
Table 9 shows the ranking of injury burden of the Stadia from the highest to lowest between 20162022. When combining the last seven season's data, it highlights that the Danie Craven Stadium, followed by Mbombela Stadium recorded the highest injury burdens overall, with only Mbombela's averaged injury burden being significantly higher than the grouped average injury burden from 20162022 (Table 9).
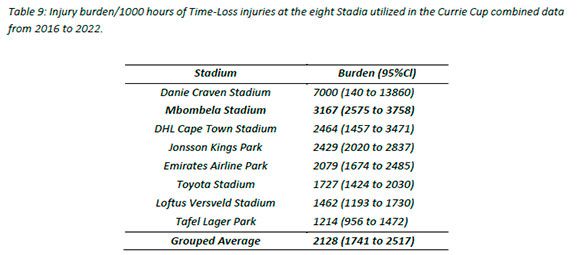
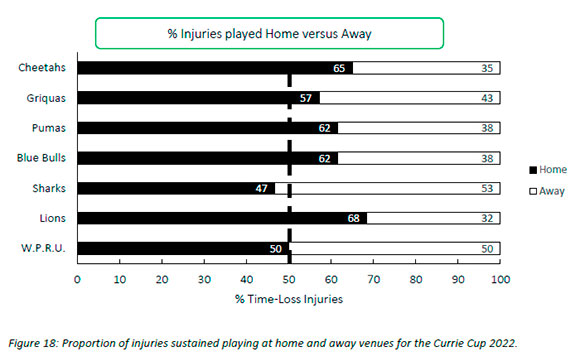
Figure 18 presents the proportion of injuries sustained playing at home and away venues in the Currie Cup 2022. When comparing injuries while playing away and at home in the Currie Cup 2022 tournament, playing at home at 40 (31 to 49) injuries per 1000 player hours, recorded a higher injury rate to playing away with 29 (21 to 37) injuries per 1000 player hours, but was not significantly different. With the exceptions of the Cell C Sharks and DHL Western Province (W.P.R.U.), all teams experienced more injuries when playing at home compared to playing away. DHL Western Province (W.P.R.U.) had an equal distribution of injuries at home and away matches, while Cell C Sharks experienced more injuries playing away.
TRAINING INJURIES
Overall, 61 Time-loss injuries were sustained during training in the Currie Cup 2022. The time-loss injuries resulted in an injury incidence of 2 (1.5 to 2.5) injuries per 1000 training hours which is lower than the meta-analysis injury incidence of 3 (1.9 to 4.0) injuries per 1000 training hours [1]. These time-loss injuries contributed to 34% of all injuries experienced during the Currie Cup Tournament over the 2022 rugby season. The average severity of training injury was 34 days, with a median severity (IQR) of 17 (10 to 46) days absent. Figure 19 shows the percentage of training injuries per training activity. Semi and full contact rugby skills accounted for the highest percentage of training injuries, which is expected given the nature of contact involved in those activities. Injuries associated with weights conditioning training increased (Table 10).
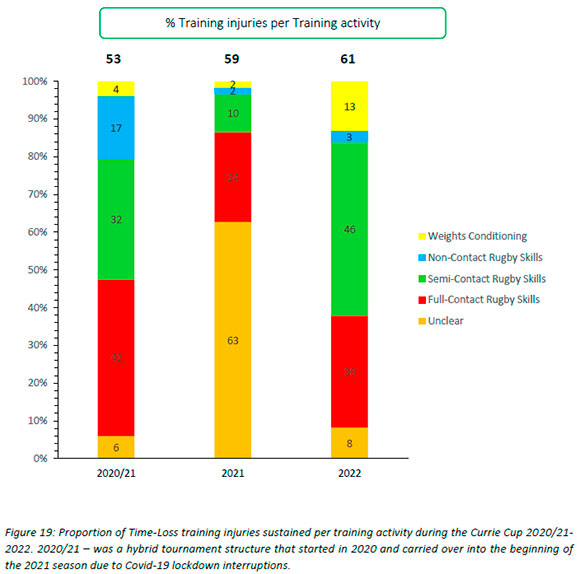
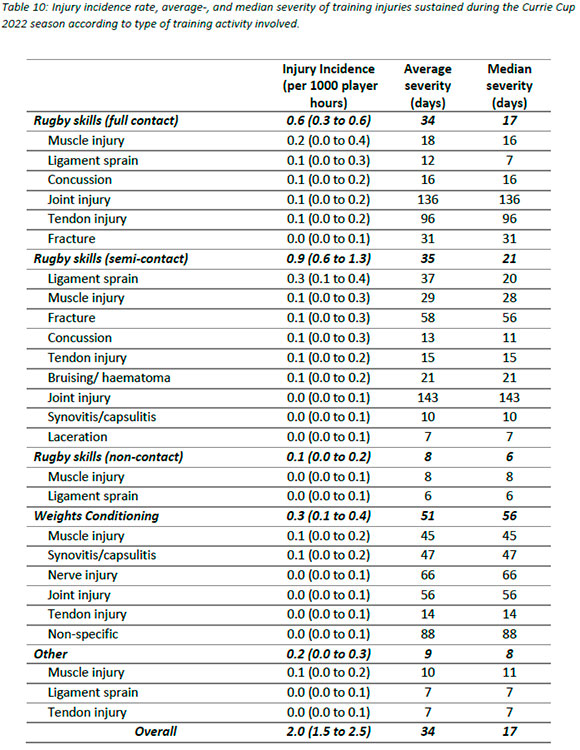
Table 10 presents the training injuries sustained during the Currie Cup 2022. The most common injury type sustained in full contact rugby skill activities was Muscle Injuries, and Joint Injuries had the highest average severity at 136 days (Table 10). Within semi-contact rugby skills, Ligament Sprains were the most common, whereas Joint Injuries again had the highest average severity of 143 days.
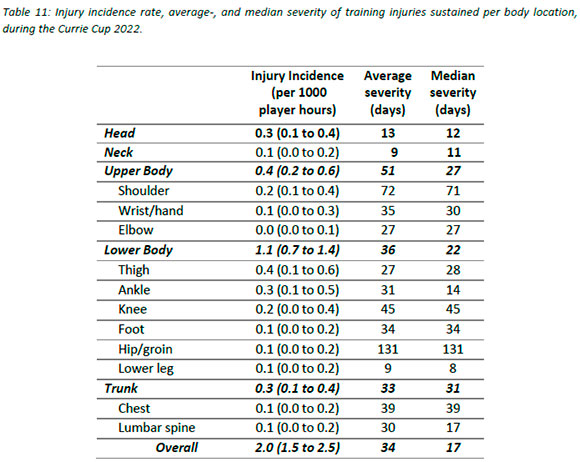
The thigh was the most injured body location in training accounting for 18% (n = 11) of all Time-Loss training injuries during the Currie Cup 2022, followed closely by the ankle (15%) and head (13%) (Table 11). Hip/Groin training injuries clearly had the highest average and median severities, followed by shoulder training injuries.
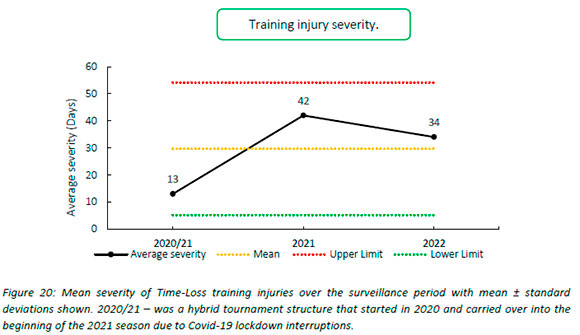
The average severity of training injuries for the Currie Cup 2022 was 34 days, which is higher than the average severity for 2020/21 but lower than the 2021 Currie Cup tournament average (42 days) (Figure 20).
Overall, concussions contributed to 3 training injuries throughout the Currie Cup 2022 (3%). This is similar to the 2020/21 and 2021 Currie Cup seasons.
References
1. Williams S, Robertson C, Starling L, McKay C, West S, Brown J, et al. Injuries in Elite Men's Rugby Union: An Updated (2012-2020) Meta-Analysis of 11,620 Match and Training Injuries. Vol. 52, Sports Med (Auckland, N.Z.). 2022. p. 1127-40. DOI: https://doi.org/10.1007/s40279-021-01603-w [ Links ]
2. Bahr R, Clarsen B, Derman W, Dvorak J, Emery CA, Finch CF, et al. International Olympic Committee consensus statement: methods for recording and reporting of epidemiological data on injury and illness in sport 2020 (including STROBE Extension for Sport Injury and Illness Surveillance (STROBE-SIIS)). Br J Sports Med: http://bjsm.bmj.com/lookup/doi/10.1136/bjsports-2019-101969 [ Links ]
3. Fuller CW, Molloy MG, Bagate C, Bahr R, Brooks JHM, Donson H, et al. Consensus statement on injury definitions and data collection procedures for studies of injuries in rugby union. Br J Sports Med. 2007;41(5):328-31. DOI: 10.1136/bjsm.2006.033282 [ Links ]
4. Fuller, C.W. A Kinetic Model Describing Injury-Burden in Team Sports. Sports Med 47, 26412651 (2017). https://doi.org/10.1007/s40279-017-0746-7 [ Links ]
5. Schenker N, Gentleman JF. On judging the significance of differences by examining the overlap between confidence intervals. Am Stat. 2001;55(3):182-6. DOI: http://dx.doi.org/10.1198/000313001317097960 [ Links ]
6. Starling L. Teams with lower injury rates have greater success in the Currie Cup rugby union competition. S Afr J Sports Med. 2019;Volume 31(1):1-2. DOI: 10.17159/2078-516X/2019/v31i1a6401 [ Links ]
7. Williams S, Trewartha G, Kemp SP, Brooks J, Fuller C, Taylor A, Cross M, Stokes K. Time loss injuries compromise team success in Elite Rugby Union: A 7-year prospective study. Br J Sports Med 50(11) 2016: 651-656. DOI: 10.1136/bjsports-2015-094798 [ Links ]
8. Paul, L; Readhead, CR; Viljoen, W; Starling, L; Lambert, M. SA Rugby Injury and Illness Surveillance and Prevention Project (SARIISPP): The Currie Cup Premiership Competition Injury Surveillance Report 2021. S Afr J Sports Med DOI: 10.17159/2078-516X/2022/v34i1a15259. [ Links ]
9. Orchard JW. John Orchard's Sports Injury Site - OSICS Download. 2019. https://www.johnorchard.com/osiics-version-history.html [ Links ]
10. Perez LT, Terrassa CS De, Rae KL. The Orchard Sports Injury Classification System ( OSICS ) Version 10. 2015;109-112. DOI: https://www.researchgate.net/publication/39498997 [ Links ]

