


Serviços Personalizados
Artigo
 Inglês (pdf)
 Artigo em XML
 Referências do artigo
Indicadores

Links relacionados
-
 Citado por Google
 -
 Similares em Google
Compartilhar

 Permalink
South African Journal of Sports Medicine
versão On-line ISSN 2078-516X
versão impressa ISSN 1015-5163
SA J. Sports Med. vol.33 no.1 Bloemfontein 2021
http://dx.doi.org/10.17159/2078-516x/2021/v33i1a11849
REPORTS
SA Rugby Injury and Illness Surveillance and Prevention Project (SARIISPP) Super Rugby Unlocked and the Carling Currie Cup Premiership Competition Injury Surveillance Report 2020/21
Lindsay StarlingI; Clint ReadheadII; Wayne ViljoenIII; Lara PaulIV; Mike LambertV
ICarling Currie Cup Injury Surveillance Manager
IISA Rugby, Senior Manager: Medical, and University of Cape Town
IIISA Rugby, Senior Manager: Rugby Safety, and University of Cape Town
IVUniversity of Cape Town
VUniversity of Cape Town

Executive Summary
The outbreak of the Coronavirus pandemic (COVID19) resulted in the 2020 Super Rugby competition being suspended in March 2020, at completion of round 7 of the competition, and the 2020 Carling Currie Cup competition did not take place as originally scheduled. Seven South African Rugby franchises returned to official competition on 9 October 2020. The seven franchises first played in a 7-round 2020 Super Rugby Unlocked tournament, after which the winners of this part of the combined tournaments, the Vodacom Blue Bulls, were crowned as the Super Rugby Unlocked Champions. This was followed immediately by a 7-round 2020/21 Carling Currie Cup, with knockout play-off rounds. The points from the Super Rugby Unlocked tournament were carried over into the Carling Currie Cup. This culminated in the Vodacom Blue Bulls also being crowned as the Carling Currie Cup 2020/21 Champions after the final play-off match. As the Super Rugby Unlocked and Carling Currie Cup competitions included the same seven franchises, with no break afforded between competitions, this report presents the combined data from both tournaments. Although the structure of the 2020/21 season was unique, data analysis revealed no apparent reasons for these data to be treated differently to previous seasons' data. As such the collective competition data is referred to as the 'Carling Currie Cup' 2020/21 throughout this report. Despite the disruptions to the 2020 season, and players potentially being unable to maintain the physical qualities necessary to protect themselves against injury, our analysis tells a positive story about how players were managed during these times, with injury rates being comparable to previous seasons' injury rates, and within the expected season-to-season limits of variation for the Carling Currie Cup.
As part of the SA Rugby Injury and Illness Surveillance and Prevention Project (SARIISPP), the Carling Currie Cup 2020/21 Premiership Division Competition (the 'Carling Currie Cup') injury data were recorded throughout the tournament by the medical doctors and medical support staff of the respective teams. All seven teams were required to record every match and training injury that occurred in their team.
The injury rate of Time-Loss injuries for the Carling Currie Cup 2020/21 was 91 (76 to 106) injuries per 1000 player hours (mean and 95% confidence intervals), which is higher than the international rate of 81 (63 to 105) injuries per 1000 player hours [1], but within the expected limits of season-to-season variation for the Carling Currie Cup. This equates to 1.8 injuries per team per match.
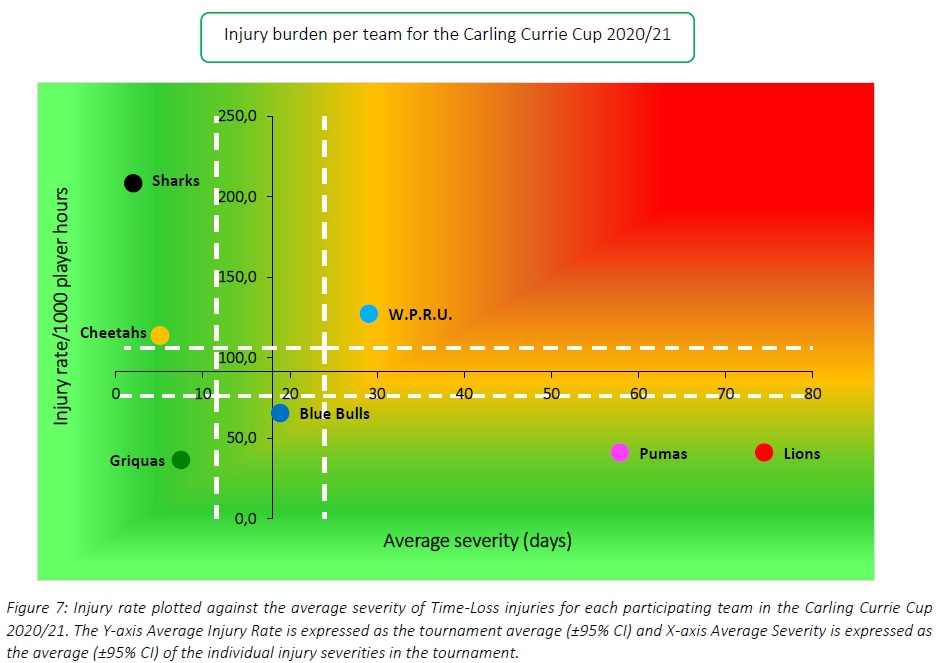
The Cell C Sharks had the highest injury rate for Time-Loss injuries for the 2020/21 tournament and this was significantly higher than their 2014-2019 tournament average. Despite having the highest injury rate, the Cell C Sharks had the lowest average severity and thus experienced a low burden of injury. What this means, is that although they had a high number of injuries, they did not lose many days of training and match play due to these injuries. This finding is interesting to note as the Cell C Sharks ranked 2nd in the tournament, and in previous years the teams who ranked in 1st or 2nd positions of the competition had significantly lower injury rates than those who ranked in last position [2]. The Vodacom Blue Bulls, who won both the Super Rugby Unlocked phase of the tournament and the Carling Currie Cup, had a moderate injury rate and average severity, resulting in them experiencing a moderate injury burden as a team. Conversely, the Xerox Golden Lions, who had the second lowest injury rate, had a high average severity of injury resulting in a high injury burden. This means, that although having a low number of injuries, these injuries resulted in many training and match days missed. Although teams may have a low injury rate, injuries of a high severity still represent a sizable burden to the team, resulting in many training and match days lost due to injury for that team. This highlights the importance of collecting severity data, and not simply injury rates on their own.
The average severity of Time-Loss injuries in the 2020/21 tournament was 18 days, which is lower than the 25 days reported in English Professional Rugby [3]. The median injury severity of all Time-Loss injuries was 4 days, with 25% of injuries lasting 1 day and 25% of injuries lasting 12 days or more due to injury.
Contusion/bruise injuries were the most common injury type in the 2020/21 tournament, with muscle (rupture/strain/tear) and sprained ligament injuries recording the second and third most common injury types, respectively. The head was the most commonly injured body location, with Concussions being the most common injury diagnosis for the fifth consecutive year. Open play accounted for the highest proportion of injuries in the 2020/21 tournament with collision being the secondary mechanism for 65% of the open play injuries. The injury rates for being tackled and tackling were comparable, however injuries from tackling carried a higher average severity than those from being tackled. The injury rate from the ruck was similar to both tackling and being tackled but had a lower average severity.
A total of 53 Time-Loss training injuries were sustained in the Carling Currie Cup 2020/21, meaning that 27% of all Time-Loss injuries, more than a quarter of all injuries, occurred in training activities. This equates to an incidence of 2.6 (1.9 to 3.2) injuries per 1000 training hours, which is comparable to the meta-analysis injury incidence of 3 (2 to 4) injuries per 1000 training hours [1]. The average severity of Time-Loss training injuries was 13 days, which is lower than the 20 days reported in the meta-analysis [1]. The majority (42%) of Time-Loss training injuries occurred in Full-Contact Rugby Skills training, followed by 32% in Semi-Contact Rugby Skills training.
In February 2020, the International Olympic Committee (IOC) published an updated consensus statement for methods of recording and reporting epidemiological data on injury and illness in sport [4]. The Carling Currie Cup 2020/21 report has aligned with this more recent consensus statement. In certain sections of this report, such as the subsequent injury section for example, additional details on injuries have been added to assist practitioners when they report these injuries. Details on these additions are described in the Definitions section of this report.
Introduction
In 2014, as part of the SA Rugby Injury and Illness Surveillance and Prevention Project (SARIISPP), the South African Rugby Union (SA Rugby) implemented a new standardised injury surveillance format for the Carling Currie Cup Premiership Division Competition. This required the team doctor or medical support staff to electronically capture all relevant match and training injury data according to the standardised BokSmart injury surveillance data capture format, which is aligned with the IOC consensus statement for injury recording in sport [4], and for rugby union [5].
Injury surveillance is a critical step in the development, and testing of the efficacy and effectiveness, of injury prevention strategies. Injury surveillance captured in the correct format enables the comparison of injury rates between teams within the same tournament, tournament injuries over successive years, and with other rugby injury surveillance studies. Literature describing tournament injuries presents the injury numbers as a rate where the total number of injuries is divided by the total amount of time exposed to the risk of experiencing an injury. An injury rate is expressed as the number of events per 1000 player exposure hours. Match exposure hours are calculated as the number of matches played multiplied by the number of exposed players (15) and the match exposure time (80 mins). Training exposure hours are calculated as the average number of players present at training multiplied by the average time spent training each week; this is then summed to the get training exposure hours over the competition period. This normalised version of the injury number facilitates comparison between teams in 2020/21, previous tournaments and the international injury surveillance literature. Throughout this report the normalised injury rates have been provided to allow for comparison with other tournaments and the international literature, as discussed, but every effort has been made to present these rates on a 'per team' and 'per match' level for easier and more pragmatic interpretation.
Since 2016, the Carling Currie Cup doctors or medical support staff were asked to record the physical return to play date of the injured players, thereby allowing for the actual severity of the injury to be calculated. For those cases, where the player had not returned to play by the start of the following year, doctors or medical support staff were asked to provide an estimated return to play date. The severity of these injuries was then calculated using the estimated date provided, and not the actual date. Calculating the actual severity of most injuries adds substantial value to the report as it enables one to determine the burden of the teams' injuries with greater accuracy. Injury burden is a combination of the injury rate and severity and is expressed as the number of days absent from training and matches per 1000 player hours. Throughout the report, in sections reporting on injury numbers and incidence only, the 2014 and 2015 season data are included, while sections reporting on injury severity and burden do not include the 2014 and 2015 season data, due to severity data only being captured from the 2016 season.
The Carling Currie Cup 2020/21 season saw the introduction of Time-Loss training injury and training exposure data being captured as a part of the SARIISPP. The addition of training exposure and injury information is a substantial addition to the SARIISPP, as it allows us to reflect a full competition injury picture. As this is the first season where training related data has been captured, this section is limited but will continue to grow and develop over the years.
It is important to note that a multitude of factors contribute to players' injury risk and injury causing events. The medical, conditioning, coaching staff, and the players themselves are equally responsible for ensuring that players are medically, mentally, and physically fit to handle the demands of the competition. Additionally, each player has unique intrinsic and extrinsic injury risk factors, which are beyond the control of the team's staff.
An inherent issue with most injury surveillance studies is that the teams' medical doctors or medical support staff are exclusively responsible for entering their team's injury data. As no audit process is done on the collection of these data, in many of these cases, the accuracy of the data is dependent on the compliance of the doctors or medical support staff. This potential limitation is present in most injury surveillance studies. To minimise this potential limitation, SARIISPP had a project coordinator who was in frequent contact with the doctors or medical support staff to ensure they were up to date with the data capturing.
The Carling Currie Cup 2020/21 semi-finals were contested between DHL Western Province vs. Cell C Sharks and Vodacom Blue Bulls vs. Xerox Golden Lions. The final was between Vodacom Blue Bulls vs. Cell C Sharks, with the Vodacom Blue Bulls eventually winning the tournament. The Vodacom Blue Bulls also won the Super Rugby Unlocked phase of the extended competition.
Definitions
All definitions are originally based on the 2007 consensus statement for injury reporting in rugby union [5] and have since been realigned with the latest International Olympic Committee (IOC) consensus statement for methods of recording and reporting epidemiological data on injury and illness in sport [4].
MEDICAL ATTENTION INJURY:
All injuries that were seen by the teams' doctor or medical support staff were classified as Medical Attention injuries, which are defined by the 2007 statement as an "injury that results in a player receiving medical attention" [5], and by the more recent IOC statement as "a health problem that results in an athlete receiving medical attention" [4].
TIME-LOSS INJURY:
Medical Attention injuries were further categorised as Time-Loss injuries, where appropriate, and defined by the 2007 statement as, "an injury that results in a player being unable to take a full part in future rugby training or match play" [5]. The IOC definition is, "a health problem that results in a player being unable to complete the current or future training session or competition" [4].
INJURY RATE:
For this report, an injury rate is the number of injuries expressed per 1000 player exposure hours. This method of expressing injury rate has been used in previous years' reports of the Carling Currie Cup Premiership tournament and other international literature, and therefore makes comparisons easy. Moreover, the injury rate is expressed as a mean with 95% confidence intervals. A 95% confidence interval around a mean value indicates that there is a 95% chance (i.e., very high chance) that the true value falls within this range. In this report, we present the 95% confidence intervals assuming normal distribution of the data and use the approach of examining the overlap of the confidence intervals, to determine whether the injury incidences are significantly different; if the range of confidence interval values of two comparisons do not overlap, there is a strong chance (95%) that their injury rates are different from each other. We have opted for this method because it is easy to use, conservative and less likely to produce false positive results [6].
MEDIAN (INTERQUARTILE RANGE):
When numbers are ordered from the lowest to highest, the median is the value which separates the higher half of the values from the lower half of the values. Simply put, it is the middle value of a list of ranked numbers. The interquartile range (IQR) describes the spread of the data. When rank ordered data are divided into quartiles the first and the third quartile represents the value under which 25% and 75% of the data points fall, respectively. As an example, a team may have a median injury severity of 32 days (IQR 7 to 40). This means that when the teams' injury severities are rank ordered the mid-point or median of the injury severities is 32 days. Also 25% of their injuries result in 7 or less days absent from training and matches and 25% of their injuries result in 40 days or more absent from training and matches.
META-ANALYSIS:
A meta-analysis is a study using statistical methods to combine multiple scientific studies with varying levels of evidence on the same topic to determine overall defining patterns and results from the combined data. As such, it represents the highest level of scientific evidence available. The findings in this report are compared to that of the most recent meta-analysis for rugby union injuries at a senior professional level [1]. Although this was published in 2013, it remains the most comprehensive assessment of injuries associated with rugby.
NEW, SUBSEQUENT AND RECURRENT INJURIES:
In 2019, in the Carling Currie Cup Premiership Division Competition, a 'New Injury' was defined as when a player sustained his first injury. Any injury that the same player sustained after this initial injury was defined as a 'Subsequent Injury'.
According to the more recent IOC statement, any subsequent injury to the same site and of the same type is referred to as a 'Recurrence' if the index injury was fully recovered before reinjury, and as an 'Exacerbation' if the index injury was not yet fully recovered [4].
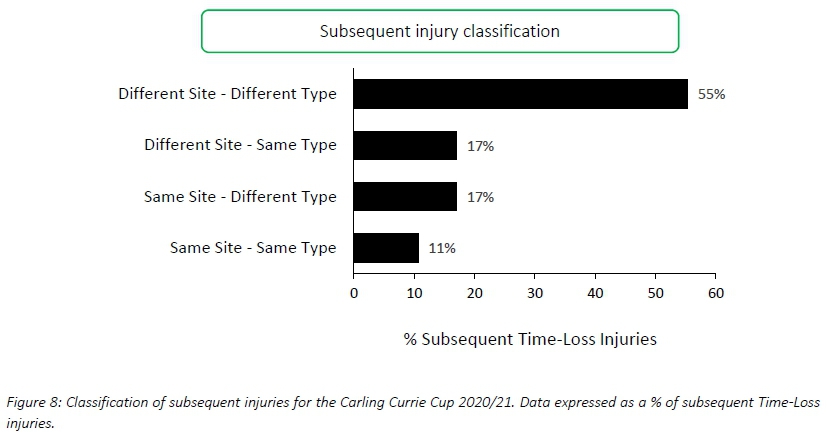
To provide more detail on the subsequent injuries for practitioners, we have further categorized the subsequent injuries in this report into one of four groups based on the OSICS classification diagnosis:
- Different site - Different type
- Different site - Same type
- Same site - Different type
- Same site - Same type
According to the 2007 Consensus Statement for rugby, any subsequent injury classified as 'Same site - Same type' was a 'Recurrent injury' [5].
INJURY SEVERITY:
The total severity of an injury is defined as "the number of days that have elapsed from the date of injury to the date of the player's return to full participation in team training and availability for match selection" [4], [5]. For each year, at the time of injury the doctors or medical support staff were asked to estimate the severity of the injury based on their clinical assessment of the injured player. These estimations were made according to the severity groupings provided in the 2007 consensus statement; Slight (0-1 days lost), Minimal (2-3 days lost), Mild (4-7 days lost), Moderate (8-28 days lost), Severe (>28 days lost), Career ending and Non-fatal catastrophic [5]. To align with the latest IOC statement the injuries have been re-grouped to reflect the severity groupings Ί-7 days', '8-28 days' and '>28 days' [4].
The average severity represents the average number of days lost per injury when dividing the accumulated total number of days lost by the total number of injury events. For example, a team may have a total severity of 550 days absent, accumulated from 22 injuries. The average severity of the team's injuries would therefore be 550/22, which equals, on average 25 days absent per injury.
INJURY BURDEN:
Injury burden is a combination of injury rate and severity. It is the injury rate multiplied by the average severity (number of days lost due to injury) and is expressed as the number of days absent per 1000 player hours. For example, a team who has an injury rate of 75 injuries per 1000 player exposure hours, and an average severity of 38 days lost per injury will have an injury burden of 2850 days absent per 1000 player hours (75 x 38).
OPERATIONAL INJURY BURDEN:
The operational burden is the expected number of days lost per injury per team for every match played over the tournament or season. The measure is an extrapolation of injury rates and severities over a season and includes the most severe injuries together with the least severe injuries in its estimation. For example, if a team has an operational injury burden of 2 days, it means that based on their injury rates and average severity, on average, 2 days absence can be expected from every match injury the team sustains.
MATCH INJURIES
Injured players
During the 'Carling Currie Cup' 2020/21, 99 players sustained a total of 146 Time-Loss injuries. Since we cannot account for all players who entered or left the match day squads during the tournament, either by injury replacement or otherwise, the following assumption was made: a total of 161 players were exposed to playing rugby matches in the tournament (7 teams x 23 players per match-day squad). Of these 161 players, 61% sustained a match injury at some stage in the tournament (Figure 1a). The proportion of players who experienced one Time-Loss injury decreased from 2019 to 2020/21, while the proportion of players who experienced 2 or 3 injuries increased from 2019 to 2020/21 (Figure 1b). Further analyses will focus on the absolute injury numbers, regardless of the number of players who sustained them.
Overall Injury Rate
Only the number of Time-Loss injuries, those which resulted in the player missing more than one training session or match, were considered for further analysis, because these injuries are more comparable between different teams, tournaments and with the published scientific literature [5].
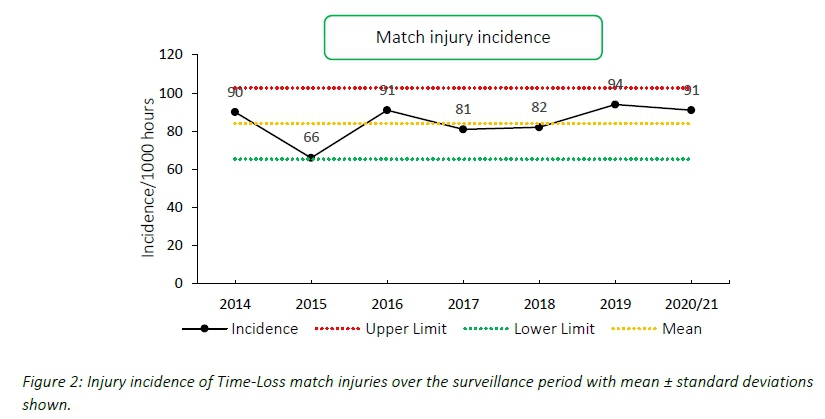
The overall match injury incidence for the Carling Currie Cup 2020/21 was 91 (76 to 106) injuries per 1000 player exposure hours. This is higher than the incidence of the meta-analysis (81 injuries per 1000 player hours, 63 to 105) [1], but is within the expected limits of season-to-season variation for the Carling Currie Cup (Figure 2). An injury incidence of 91 injuries per 1000 player hours equates to 1.8 injuries per team per match.
When comparing the team's 2014-2019 averaged tournament injury incidence to their 2020/21 injury incidence, the Phakisa Pumas experienced a significantly lower incidence in 2020/21 in comparison to their 2015-2019 tournament average (Figure 3; they never played in this division in 2014). The Cell C Sharks had a significantly higher incidence in 2020/21 in comparison to their 2014-2019 tournament average.
It remains interesting to note that the combined mean incidence and 95% CI for all teams for all years, 84 (79 to 90) injuries per 1000 player hours is similar to the summary of international data described in the meta-analysis of 81 (63 to 105) injuries per 1000 player hours [1].
Influence of the COVID19 suspension
Despite the outbreak of COVID19 and suspension of regular team training and match play, when players returned to competition, the overall 2020/21 season injury incidence [91 (76 to 106) injuries per 1000 player hours] was not significantly different to the 2014-2019 tournament mean [84 (79 to 90) injuries per 1000 player hours (Figure 3)]. Looking at the Time-Loss match injury incidence over the course of the 2020/21 season shows that there was no month in the season where the match injury incidence was significantly different to the 2020/21 mean injury incidence or to any other month in the season (Figure 4).
Overall Severity
The average severity of match injuries for the Carling Currie Cup 2020/21 was 18 days, which is lower than the average for the surveillance period 2016-2020/21 (28 days) but was within the expected limits of season-to-season variation (Figure 5). The median severity was 4 days (IQR 1 to 12). This means that the half-way mark of the injury severities was 4 days, with 25% of all Time-Loss injuries lasting for 1 day and 25% lasting 12 days or longer.
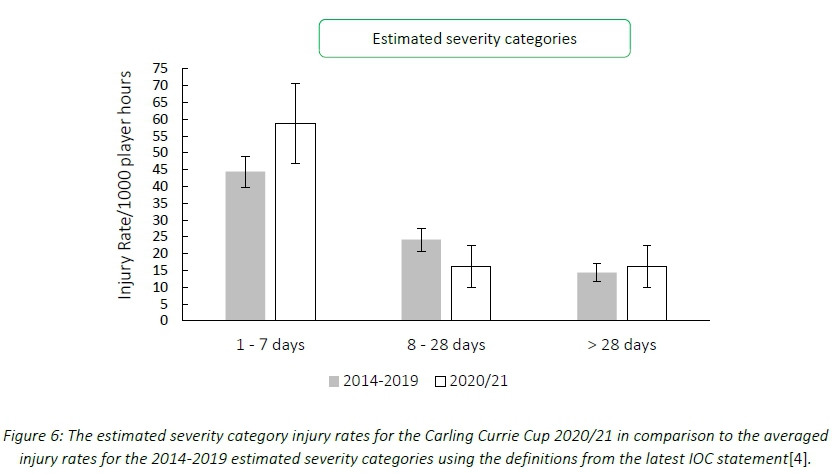
For each year, at the time of injury the doctors or medical support staff were asked to estimate the severity of the injury, based on their clinical assessment of the injured player. A 'Slight' injury refers to 0-1 days, 'Minimal' is 2-3 days, 'Mild' is 4-7 days, 'Moderate' is 8-28 days and 'Severe' is >28 days off rugby training and/or match play. These severity groupings are according to the original 2007 consensus statement for rugby union [5].
To align these data with the latest IOC statement the injuries have been re-grouped to reflect the severity groupings Ί-7 days', '8-28 days' and '>28 days' [4].
Figure 6 compares the estimated injury severity rates for the Carling Currie Cup 2020/21 tournament to the 2014-2019 tournament averaged rate. There were no significantly different injury severity rates in 2020/21 in comparison to previous years (Figure 6).
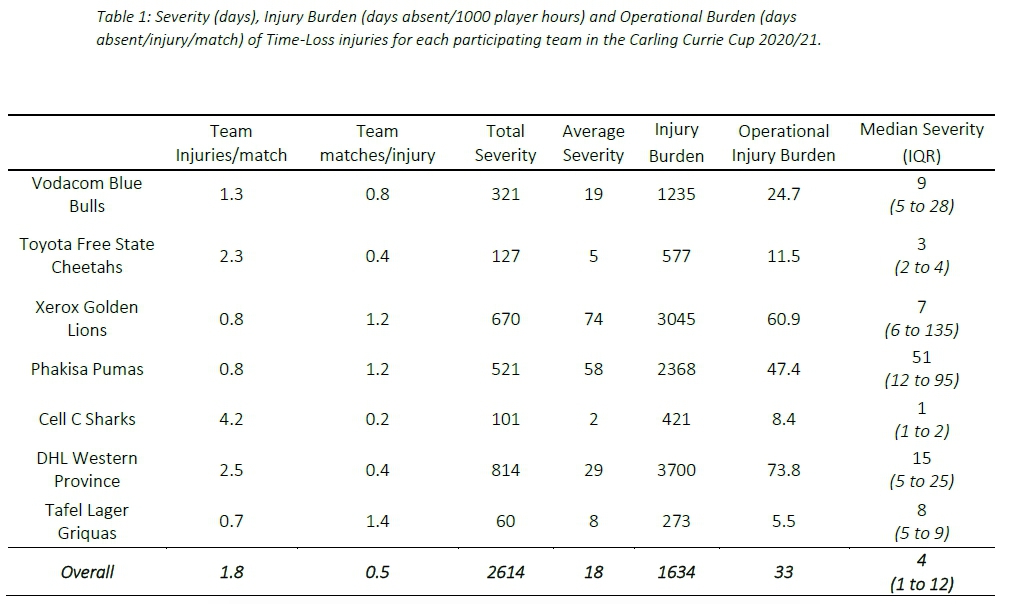
Table 1 describes the actual severity of each teams' Time-Loss injuries for the Carling Currie Cup 2020/21. The Vodacom Blue Bulls have again been used as a worked example to explain the Table. The Vodacom Blue Bulls sustained 1.3 injuries per match, meaning that for every 0.8 matches played they sustained one injury. In total, the Vodacom Blue Bulls lost 321 training and match days due to injury. This equates to an average of 20 training and match days lost for every injury sustained. The burden of the team's injuries equates to 1235 days lost per 1000 player hours. Translating this to an operational burden per match, it shows that the Vodacom Blue Bulls lost 24.7 days per injury per match over the season. The median injury severity for the Vodacom Blue Bulls was 9 days (IQR 5 to 28). This means that when severities of the Vodacom Blue Bulls Time-Loss injuries were rank ordered, the midpoint of the severities was 9 days off from rugby, with 25% of their injuries lasting equal to or less than 5 days off and 25% of their injuries lasting equal to or longer than 28 days off (Table 1).
The Cell C Sharks had the highest rate of Time-Loss injuries, but these were of low severity. Conversely, the Xerox Golden Lions had a low injury rate, but their injuries were of high severity (Figure 7). Teams who fall in the green zone (below average and 95%CI), will generally not be impacted as much by their injury burden, regardless of whether their injury rate or average severity is relatively high. As soon as the combination of rate and severity moves into the orange (close to average) and/or red zone (above average and 95% CI), the impact on team performance and player availability becomes more problematic.
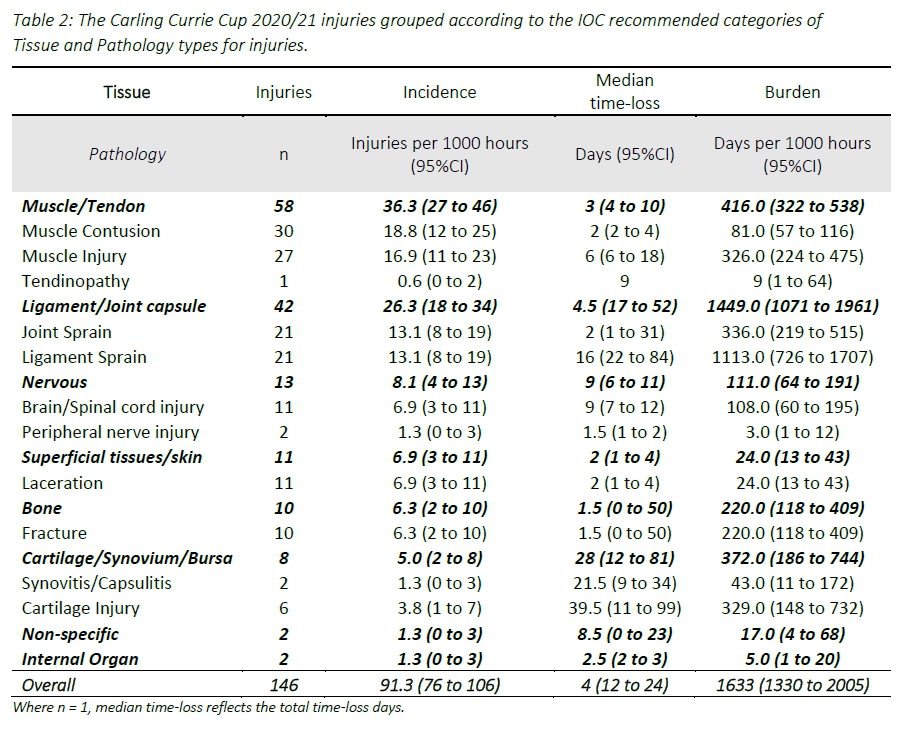
The data in this report is aligned with the most recent IOC consensus statement [4] and is further presented such that it facilitates comparison with previous season reports and the meta-analysis [1]. Table 2 presents the Carling Currie Cup 2020/21 injury data in the format recommended by the most recent IOC consensus statement. This provides an overview of the 2020/21 season's data in this format, with the data explored in more detail throughout the report.
New, Subsequent and Recurrent Injuries
Overall, the injury rate for New injuries for the Carling Currie Cup 2020/21 was 62 (50 to 74) injuries per 1000 player hours, which is lower than the meta-analysis [1] rate of 78 (74 to 83) injuries per 1000 player hours. The average severity for New injuries in the Carling Currie Cup 2020/21 was 8 (5 to 11) days, which is lower than the average severity reported in the meta-analysis [1] of 20 (15 to 24) days.
There were 32 players who sustained more than one injury in the Carling Currie Cup 2020/21. The majority (n = 26, 55%) of the subsequent injuries were at a different anatomical site and of a different type when compared to the first injury. These 'different site - different type' injuries together with the 'different site -same type' and 'same site - different type' injuries, would be classified as subsequent new injuries. (Figure 8).
A subsequent recurrent injury was any subsequent injury classified as 'same site - same type', which refers to the same location and same tissue type involved as the original index injury. There were five subsequent recurrent injuries in the Carling Currie Cup 2020/21. The overall injury rate for subsequent recurrent injuries was 3 (0.4 to 5.9) injuries per 1000 player hours, which is significantly lower than the meta-analysis rate of 11 (10 to 12) injuries per 1000 player hours [1]. When comparing the new and subsequent recurrent injuries across the Carling Currie Cup 2016 - 2020/21 tournaments, there was a decrease in the proportion of new injuries and increase in the proportion of subsequent recurrent injuries in 2020/21 in comparison to previous seasons (Table 3).
Injury Type
Contusion/bruise injuries (21%, n = 31) were the most common Time-Loss injuries recorded in the Carling Currie Cup 2020/21, with muscle (rupture/strain/tear) injuries comprising the second highest proportion (17%, n = 25). The median severity for contusion/bruise injuries was 2 days with 25% of injuries resulting in 1 day absent from training and matches, and 25% of injuries resulting in 4 or more days absent from training and matches (Table 4).
When the injury types from 2016 - 2020/21 were combined, ligament sprain injuries had the highest burden for teams, as they had both a high injury rate and average severity of injury. While not as high as ligament injuries, muscle injuries also had a high injury rate and average severity (Figure 9). Therefore, these two injury types still dominate, and impact teams more than the other injury types do.
For further comparison, the Carling Currie Cup 2020/21 Time-Loss injury types were grouped in a similar way to the meta-analysis of international studies [1]. With these groupings, aligned to the meta-analysis, the most common Time-Loss injury types in the Carling Currie Cup 2020/21 were joint (non-bone)/ligament injuries (comprised of dislocation/subluxation and sprain/ligament injuries).
The injury rate of 7 (3 to 11) injuries per 1000 player hours for the central nervous system during the Carling Currie Cup 2020/21, was comparable to the rate of "central/peripheral" system injuries of the meta-analysis, 8 (4 to 15) injuries per 1000 player hours [1].
The injury rate for muscle/tendon injuries (comprised of muscle rupture/strain/tear, tendon injury/rupture and tendinopathy injuries) was 18 (12 to 25) injuries per 1000 player hours. This was lower than the same type of injury grouping in the meta-analysis, which had a rate of 40 (21 to 76) injuries per 1000 player hours, albeit not significantly different [1]. The average severity for muscle/tendon injuries of 19 (13 to 28) days, in the Carling Currie Cup 2020/21 was similar to the average severity of 15 (5 to 24) days reported in the meta-analysis [1].
In contrast, joint (non-bone)/ligament injuries (comprised of dislocation/subluxation and sprain/ligament injuries) were comparable: 19 (13 to 26) injuries per 1000 player hours in the present study, compared to the 24 (18 to 65) injuries per 1000 player hours in the meta-analysis [1]. The average severity of joint (non-bone)/ligament injuries in the Carling Currie Cup 2020/21 was 31 (27 to 54) days, which is comparable to the average severity for the same types of injuries reported at 29 (19 to 39) days in the meta-analysis[1].
Injury Diagnosis [7]
The most frequent OSICS classification diagnosis7 in the Carling Currie Cup 2020/21 was HNCX Concussion. Concussions have remained the most frequently diagnosed injury for the past 5 seasons (Table 5).
Concussions
Concussions contributed to 8% (n = 11) of all Time-Loss injuries for the Carling Currie Cup 2020/21, which equates to an incidence of 6.9 (2.8 - 10.9) concussions per 1000 hours. Concussion incidence has trended downwards since 2018, and an incidence of 6.9 is slightly lower than the mean for the surveillance period but falls within the expected limits of season-to-season variation, for the Carling Currie Cup (Figure 10). The average severity of concussions reported in the 2020/21 tournament was 10 days (IQR 5 - 18 days). The current South African Rugby concussion regulations do not normally allow for adult players to return within less than 12 days of the concussive event. As this competition takes place at the professional level and is a World Rugby approved tournament, Advanced Care protocols are implemented and carried out by the medical practitioner that could potentially allow a player to return-to-play in less than 12 days.
Advanced care clinical settings are defined in the World Rugby and SARU's Concussion Guideline documents:
(a) World Rugby Concussion Guideline document - https://playerwelfare.worldrugby.org/
(b) SARU's Concussion Guideline documents (When can a player safely return-to-play following a concussion) www.boksmart.com/concussion
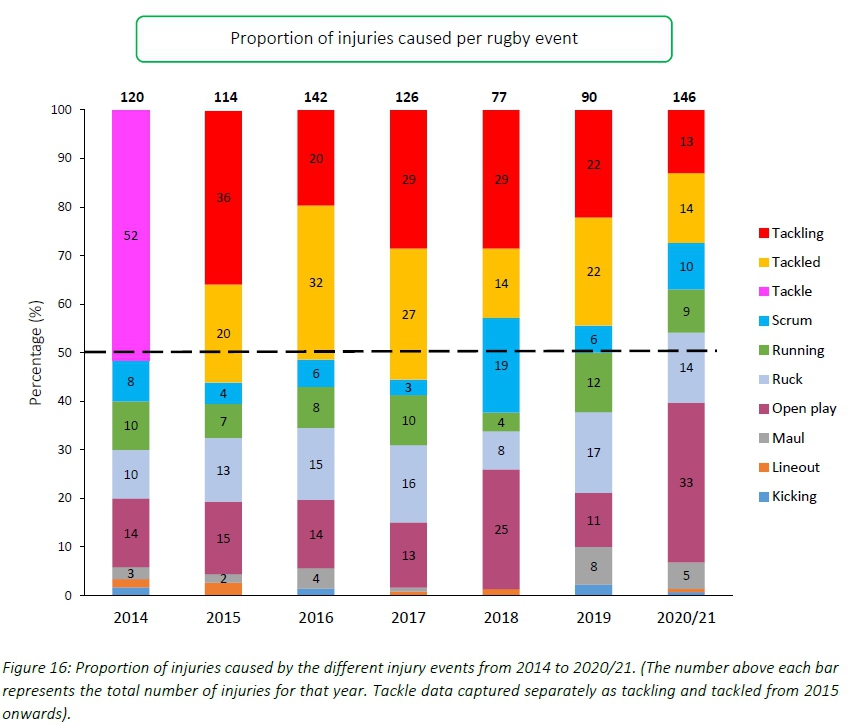
The proportion of concussions caused from Tackling (27%) and from being Tackled (18%) in the Carling Currie Cup in 2020/21 was identical to the 2019 season. In the 2019 season the majority of concussions were caused in the Ruck (55%), with the proportion of concussions occurring in the Ruck decreasing to 18% in the 2020/21 season (Figure 11). The majority of the concussions in the 2020/21 season came from Open play (36%), which were all caused by Collisions.
The mechanisms contributing to concussions in Tackling, Tackled, Ruck and the remaining concussion causing events from 2015 - 2020/21 have been presented in Figures 12 A - D. Data have only been presented from 2015 onwards as Tackle related data were not captured separately for the Tackler and Ball Carrier in 2014.
Region of Injury
The most frequently injured body location during the Carling Currie Cup 2020/21 was the Head (16%, n = 23), followed by the Knee (15%, n = 15). Injuries to the head comprised of concussion (n = 11), bruising (n = 2) and lacerations (n = 10). The average burden of head injuries in 2020/21 was 84 days absent per 1000 player hours. The median severity of head injuries in 2020/21 was 5 days absent, with 25% of head injuries resulting in 2 or less days lost from training and matches, and 25% of all head injuries resulting in 9 or more days lost from training and matches (Table 6).
When looking at the movement of the most common body locations for the Carling Currie Cup over the past five seasons, the head and knee have remained the first and second most injured body locations respectively from 2017-2020/21. While the incidence of injuries to the head and knee in the 2020/21 season are similar to that in 2019, the average severity of injuries to the knee has increased (Table 7).
When looking at the injury incidence of the most common injury locations over the surveillance period, the most noticeable trend is the initial increase in incidence of injuries to the head from 2014-2018, followed by a stabilization or levelling off thereafter. With the majority of injuries to the head comprising of concussions, this trend reflects a similar pattern to that seen in the concussion section above, albeit that the concussion rates decreased over the last two years. A variable trend in injury incidence is depicted in the other injury locations (Figure 13).
When anatomical body locations were grouped for comparison with the data from the meta-analysis [1], the lower limb recorded the highest injury rate for the Carling Currie Cup 2020/21, with an injury rate of 41 (31 to 51) injuries per 1000 player hours, which was similar to that of the mein terms of injury burden betweenta-analysis [1] at 47 (28 to 46) injuries per 1000 player hours (Figure 14). The injury rates for all grouped body locations in the Carling Currie Cup 2020/21 were comparable to their averaged 2014-2019 injury rates. The lower limb had the highest average severity of 29 days per injury, followed by the upper limb at 16 days per injury.
Injury Event
In the Carling Currie Cup 2020/21, open play accounted for the highest proportion (33%, n = 48) of injury causing events, with collision being the secondary mechanism for 65% of these injuries. The injury rates for being tackled (13 (8 to 19) injuries per 1000 player hours) and tackling (12 (7 to 17) injuries per 1000 player hours) were comparable to each other and to the meta-analysis [1]; with injury rates for being tackled at 12 (5 to 19) injuries per 1000 player hours and tackling at 19 (12 to 29) injuries per 1000 player hours, in the meta-analysis. The ruck also added to this with 13 (8 to 19) injuries per 1000 player hours: a similar rate to both ball carrier and tackler roles, and comparable to the meta-analysis rate for the ruck of 17 (11 to 26) injuries per 1000 player hours [1].
Combining injury types from 2016 - 2020/21 showed that injuries from tackling carry the highest burden for teams, followed closely by injuries from being tackled, as they both present with a high injury rate and a relatively higher average severity of injury. Open play followed closely behind these two events (Figure 15).
Over the past four seasons the proportion of injuries caused by Tackling has decreased. The 13% of injuries in the 2020/21 season, was the lowest proportion recorded for Tackling over the surveillance period. A Chi2 test revealed that any changes in the proportion of injury causing events observed over the surveillance period were not statistically significant. The proportion of injuries sustained in Open play (33%) in the 2020/21 season was the highest recorded over the surveillance period (Figure 16).
Venue
Matches were played at seven stadia during the tournament. The following Stadia's injury burden was significantly lower in 2020/21 than their 2015-2019 average: Mbombela Stadium, Jonsson Kings Park, Tafel Lager Park, Loftus Versfeld and Toyota Stadium. Emirates Airline Park's injury burden was significantly higher in 2020/21 than its 2015-2019 average (Figure 17).
Combining all season's data highlighted that Mbombela Stadium recorded the highest injury burden overall, with its injury burden being significantly higher than Jonsson Kings Park, Toyota Stadium, Loftus Versveld, Tafel Lager Park, and the grouped average injury burden from 2015-2020/21 (Table 9). Table 9 rank orders the Stadia from highest to lowest in terms of injury burden between 2015-2020/21.
Across all teams, and although not significant, playing at home [38 (28 to 47) injuries per 1000 player hours) had a lower injury rate than playing away [54 (42 to 59)] injuries per 1000 player hours) in the Carling Currie Cup 2020/21 tournament. The Cell C Sharks and Toyota Free State Cheetahs sustained more injuries playing at home than away, while all other teams sustained more injuries when playing away (Figure 18).
TRAINING INJURIES
There was a total of 53 time-loss training injuries sustained in the Carling Currie Cup 2020/21, which equates to an incidence of 2.6 (1.9 to 3.2) injuries per 1000 training hours and is comparable to the meta-analysis injury incidence of 3 (2 to 4) injuries per 1000 training hours [1]. These contributed to more than a quarter (27%) of all injuries sustained by the Carling Currie Cup squads over the 2020/2021 rugby season. The average severity of training injury was 13 days, with a median severity (IQR) of 6 (2 to 17) days absent. An average severity of 13 days lost per training injury is slightly lower than the meta-analysis of 20 days [1]. The majority of training injuries occurred in Full-Contact Rugby Skills training (42%) and Semi-Contact Rugby Skills training (32%) (Figure 19).
The most common injury type sustained in all training activities was Muscle Injuries, with Ligament Sprain Injuries sustained in Full-Contact Rugby Skills training carrying the highest average severity at 39 days (Table 10).
The knee was the most injured body location in training accounting for 15% (n = 8) of all Time-Loss training injuries during the Carling Currie Cup 2020/21 (Table 11).
References
[1] S. Williams, G. Trewartha, S. Kemp, and K. Stokes, "A meta-analysis of injuries in senior men's professional rugby union," Sport. Med., vol. 43, no. 10, pp. 1043-1055, 2013, doi: 10.1007/s40279-013-0078-1. [ Links ]
[2] L. T. Starling, "Teams with lower injury rates have greater success in the Currie Cup rugby union competition," S Afr J Sport. Med, vol. 31, no. 1, pp. 1-2, 2019, doi: 10.17159/2078-516X/2019/v31i1a6401. [ Links ]
[3] S. W. West et al., "Trends in match injury risk in professional male rugby union: A 16-season review of 10 851 match injuries in the English Premiership (2002-2019): The rofessional ugby njury urveillance roject," Br. J. Sports Med., pp. 1-7, 2020, doi: 10.1136/bjsports-2020-102529. [ Links ]
[4] R. Bahr et al., "International Olympic Committee consensus statement: Methods for recording and reporting of epidemiological data on injury and illness in sport 2020 (including STROBE Extension for Sport Injury and Illness Surveillance (STROBE-SIIS))," Br. J. Sports Med., vol. 54, no. 7, pp. 372-389, 2020, doi: 10.1136/bjsports-2019-101969. [ Links ]
[5] C. W. Fuller et al., "Consensus statement on injury definitions and data collection procedures for studies of injuries in rugby union," Br. J. Sports Med., vol. 41, no. 5, pp. 328-331, 2007, doi: 10.1136/bjsm.2006.033282. [ Links ]
[6] N. Schenker and J. F. Gentleman, "On judging the significance of differences by examining the overlap between confidence intervals," Am. Stat., vol. 55, no. 3, pp. 182-186, 2001. [ Links ]
[7] J. W. Orchard, "John Orchard's Sports Injury Site - OSICS Download," 2019. https://www.johnorchard.com/osics-downloads.html. [ Links ]

