


Services on Demand
Article
 English (pdf)
 Article in xml format
 Article references
Indicators

Related links
-
 Cited by Google
 -
 Similars in Google
Share

 Permalink
South African Journal of Sports Medicine
On-line version ISSN 2078-516X
Print version ISSN 1015-5163
SA J. Sports Med. vol.30 n.1 Bloemfontein 2018
http://dx.doi.org/10.17159/2078-516x/2018/v30i1a5053
ORIGINAL RESEARCH
A comparison of the physical demands of a one-day cricket game and the training sessions of provincial cricket players using Global Positioning System tracking software
Z WebsterI; A L TravillII
IMA (Sport, Re c and Ex Science); Department ofSport, Recreation and Exercise Science, University ofthe Western Cape, Cape Town, South Africa
IIPhD; Department ofSport, Recreation and Exercise Science, University ofthe Western Cape, Cape Town, South Africa
ABSTRACT
BACKGROUND: Cricket is a highly technical skills-based game and coaches consequently focus on the improvement of skills during training sessions. However, a certain level of physical fitness is required to execute these skills optimally. Coaches tend to give little focused attention to the development of physical fitness during training, which could lead to players being physically unprepared for the demands of a game.
OBJECTIVE: The purpose of this study was to assess and compare the physical demands of a one -day cricket game and a training session of provincial cricket players, using Global Positioning System units.
METHODS: Nineteen male provincial cricketers participated in the research. The participants were classified into five subdisciplines, namely, batting, fast bowling, spin bowling, fielding and wicketkeeping. The study employed a descriptive and comparative design as it essentially collected numerical data from Global Positioning System units to describe and compare the physical demands of a one-day game of cricket and a training session preceding these games. The variables used in the study included total distances travelled in the game which were divided into five movement categories, i.e. walking, jogging, running, striding and sprinting. Also included were average and maximum heart rates, number of sprints and average sprint distances.
RESULTS: There were significant differences across all subdisciplines and movement categories during training and the one-day game for provincial cricket players. Batsmen showed the greatest discrepancies between training and the game for all high-intensity movements (p<0.05).
CONCLUSION: The findings of this study highlight the different physical and physiological demands placed on players in the various sub-disciplines during training and the one-day game. The current study found the major disparity between training and the one-day game was amongst the batsmen.
Keywords: high-intensity movements, low-intensity activities, physical exertion, sub-disciplines
Cricketis a multifaceted, highly technic als port and coaches tend to focus on the improvement of individual skills during the training sessions while little attention is given to the physical demands of the game. However, the sport has evolved over the last few decades and the physical demands in the game have risen considerably, with a clustering of fixtures and many more competitions being played.[1]This has compelled coaches to focus more on the physical demands of the game.
In a sport such as cricket, the challenge is even more complex as it consists of different disciplines, each with its own distinct movement patterns, physical and physiological demands.2 Furthermore, there are three major formats of the game, i.e. multi-day games, one-day games (ODG) and T20 games. The latter two are shorter formats of the game which include more intense movements and consequently impose dissimilar physical and physiological demands on players.[3,4] Training should consequently be specifically geared towards the physical demands of these different formats. In order to do this, sports scientists and coaches require accurate information and an in-depth understanding of the physical demands of the different sub-disciplines and formats of cricket in order to develop and design appropriate training strategies and programmes.
In general, there are a wide variety of techniques available to assess and estimate the physiological and physical demands of sports, ranging from simple pen-and-paper methods and video recordings, to sophisticated electronic tracking devices.[5] Timemotion analysis using Global Position Analysis (GPS) is the most widespread approach for quantifying the physical demands of sports, including cricket.[6,7] Heart rate is a physiological variable which is commonly used to determine the internal training load.[8] Previous research which reported on heart rate responses to workload, highlights the irregular nature of the types of demand placed on cricketers.[9]Information regarding the physical demands of cricket has been mostly obtained from research conducted in simulated settings which, in theory, is not a true reflection of the demands of the real match situation.[10] The game of cricket has been considerably improved mainly through the introduction of injury prevention mechanisms among the players and the enhancement of performances by means of technology and sports sciences.[11]
Although cricket is one of the world's major team sports, there has been little attention given to the physical demands of the game in research[12] for the different game formats. As pre viously mentioned, this information has been obtaine d from research conducted in simulated settings, which is not a true reflection of the real game situation. Furthermore, there is a dearth of information on the physical demands of cricket training in particular, compared to that of the match situation. The purpose of this study was therefore to assess and compare the physical demands of an ODG and a cricket training session of provincial players across the different sub-disciplines (batting, fast bowling, spin bowling, fielding and wicketkeeping) using GPS units.
Methods
Study Design
This is a descriptive and comparative cross-sectional study of the movement patterns of provincial cricket players.
Participants
The sample was purposively selected and consisted of 19 male provincial cricket players. Players were classified into the five areas of play, namely: batting (n=6), fast bowling (n=5), spin bowling (n=2), fielding (n=4) and wicketkeeping (n=2) for comparative purposes. In this research, all seam bowlers "were classified as fast bowlers. The playing positions are not mutually exclusive as the same player fulfils various roles during the game. Data collected for bowlers and batters include the entire time they spent on the playing field. The "fielder" category included players who were not bowling or wicketkeeping during a fielding innings. Fielding was not subdivided into a specific fielding position. The data were collected at their home playing ground or regular training facility.
Ethical clearance
The methods and ethics of this research were approved by the Biomedical Research Committee of the University of the Western Cape. All participants provided written, signed consent to participate in the research. The registration number of the project is 15/6/34.
Research procedure
Data were collected during one official provincial ODG, as well as during the one training session leading up to the game. The data were then categorised into the five sub-disciplines or areas of play specified. However, bowling was further subdivided into fast bowlers and spin bowlers for comparative purposes. The data reflects the total time the players spent on the field during the entire game or training session.
GPS units (GP Sports, MinimaxX v2.0, 10Hz sampling rate) were attached to players by means of supporting harnesses for the duration of the game and in the training sessions. Recent research found the 10 Hz sampling frequency was up to six times more reliable at measuring instantaneous velocity than the five Hz units[13]. While research investigating the validity and inter-unit reliability of 10 Hz and 15 Hz GPS units for assessing athlete movement demands found that, in general, the 10 Hz GPS units measured movement demands with greater validity and inter-unit reliability than the 15 Hz units.[14] The unit used in the current study was able to measure maximum speed, average speed, distance travelled, position in the game, maximum heart rate and average heart rate. The units were splash-proof, weighed 110 g and used a rechargeable Li-ion battery. The unit included a GPS Sports Analysis System. It was switched on at the commencement of activity and switched off at the end of activity. This was done so that the researcher could avoid readings of inactivity outside of the field of play and those affecting the training and game data. Warm-up and cool-down sessions were excluded from the data collection process. The GPS system generated real-time data and recorded performance on a movement tracking system. Data were downloaded onto a computer for analysis after the training session and match.
The variables used in this study were time/duration of the session, total distances travelled, maximum heart rate, average heart rate, number of sprints and average sprint distances. Although there were a number of internal indicators of the physiological stress of movement, including metabolic responses and blood lactate concentrations, heart rate measurement emerged as one of the more popular approaches to monitor the internal responses of the physiological demands of cricket[8] which was used in the present study.
The distances travelled by the players were divided into five movement categories, namely, standing and walking [0.0 - 2.0 m/s], jogging [2.0 - 3.5 m/s], running [3.5 - 4.0 m/s], striding [4.0 - 5.0 m/s], and sprinting [>5 m/s]. The movement categories were pre-programmed and are in line with those used by other researchers.[4] Once the data were downloaded, it was categorised into these variable s for statistic al analysis. Walking and jogging were considered low-intensity activities, while running, striding and sprinting were categorised as high-intensity activities.
Statistical analysis
The statistical analysis was conducted by means of SPSS V23 software. Data are presented as means and standard deviations. A paired samples t-test was used to assess whether there were differences between the physical exertion during training and an ODG. A one-way ANOVA was conducted to test for differences between the sub-disciplines (batsmen, fast bowlers, spin bowlers, fielders, and wicketkeepers) in terms of their training loads and match loads. A post hoc Tukey test -was done to establish which means were significantly different from each other. The level of significance was set at p<0.05. Box plots were produced for average and maximum heart rates to illustrate the spread of the scores and the differences between training and game heart rates. Effect sizes were calculated to quantify the size of the differences between training and the ODG. Effect sizes were interpreted using Cohen's guidelines[15] (0.2=small; 0.5=medium; 0.8=large and 1.3=very large).
Results
Movement patterns
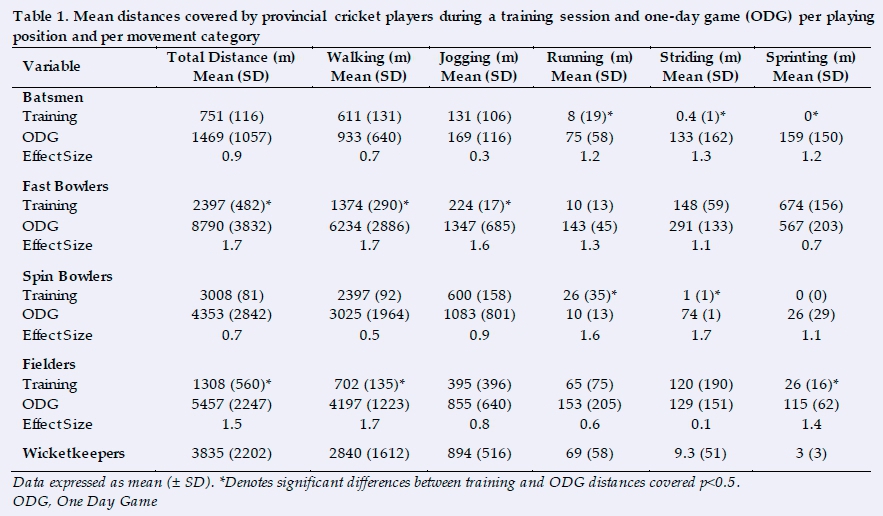
The distances covered by the cricketers during training and the ODG are shown in Table 1. The lowest distances recorded were for batsmen, with 751 m (116 m) and 1469 m (1057 m) for training and the ODG respectively. All the high-intensity movement components for batsmen (running, striding and sprinting) were significantly higher during the game compared to the training session (p<0.05).
Walking on the field made up 60% of the time for fast bowlers compared to 93% for wicketkeepers. Fast bowlers also showed the greatest differences in the distances in training and the ODG covered in the low-intensity movement categories. The percentages of the distances covered in the low-intensity movements were 56%, 9% and 3% for walking, jogging and running respectively during training, During an ODG the percentages for walking, jogging and running respectively were 68%, 11% and 3%. For the high-intensity movements, striding is closely matched between training (6%) and a game (4%), while sprinting during training is 23% of the distance covered and 13% for a game. The high-intensity movement patterns of fast bowlers did not differ between the ODG and training. This shows that physical exertion in terms of movement patterns for provincial fast bowlers during training is closely matched for high-and low-intensity movement categories
Spin bowlers covered more than twice the absolute total distance during the ODG (7100 m) in comparison to training (2400 m). Similar percentages of distance in all movement categories were covered between training and the ODG. The majority of movement for spin bowlers was spent on low-intensity activities during training with 76%, 22% and 1% for walking, jogging and running respectively, while 72%, 20%, and 3% were covered in the same categories during an ODG. For high-intensity movements, spin bowlers covered 0.5% and 2% of the distance during striding and sprinting respectively while covering 0.3% and 2% for the same movements during an ODG. It can be deduced that physical exertion in terms of movement categories for spin bowlers during training is closely matched to all the movement categories of an ODG.
Effect sizes show that the differences between training and the ODG for all sub-disciplines and for all movement categories were between medium and very large, with the majority falling in the very large category.
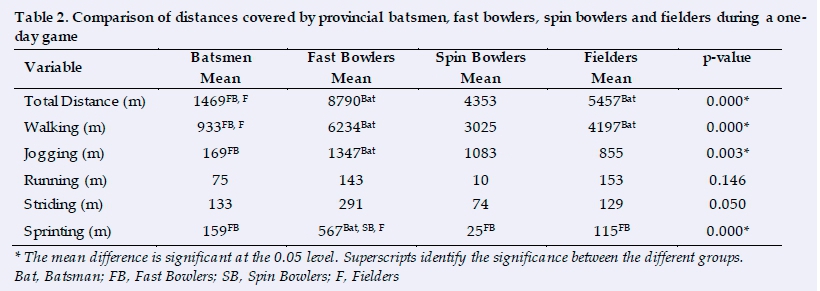
Most of the differences between sub-disciplines were recorded for batsmen and fast bowlers (Table 2). Fast bowlers differed from all other disciplines in terms of the sprint distances covered (p<0.05). Figures 1 and 2 summarise the average number of sprints and sprint distances completed by the cricket players per playing position during training compared to the ODG. Batters completed the biggest number of sprints during the ODG; however, this is not matched in their training, where no sprinting distances were recorded.
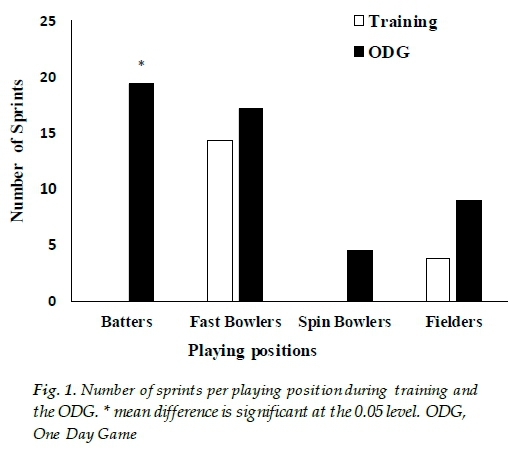
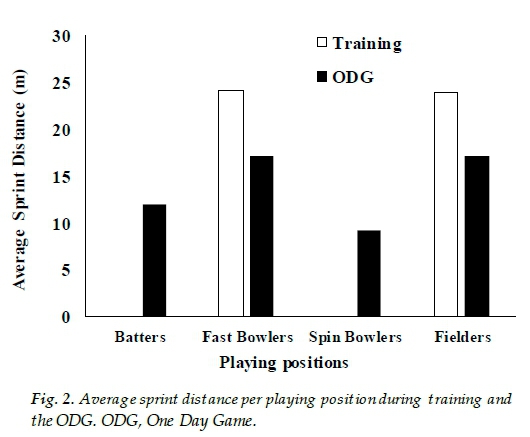
Although batsmen perform a greater number of sprints during the game compared to fast bowlers, their runs are shorter on average (12.8 m) and their top s pe eds s lowe r (24 km/h). Batsmen are the only players whose training sprint speeds do not match their game maximum speeds (p<0.05).
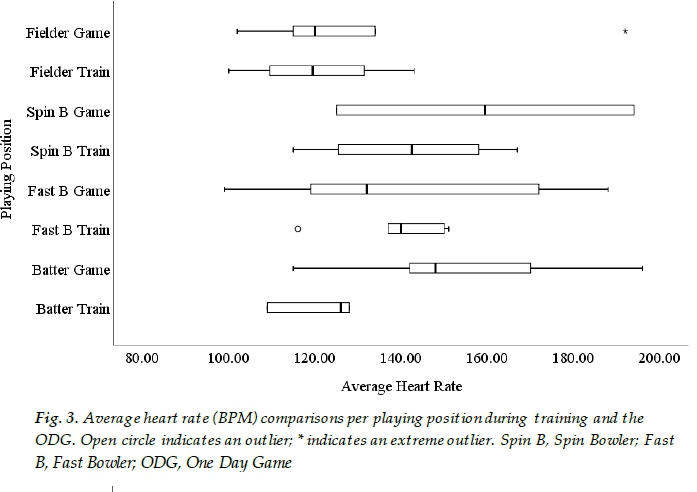
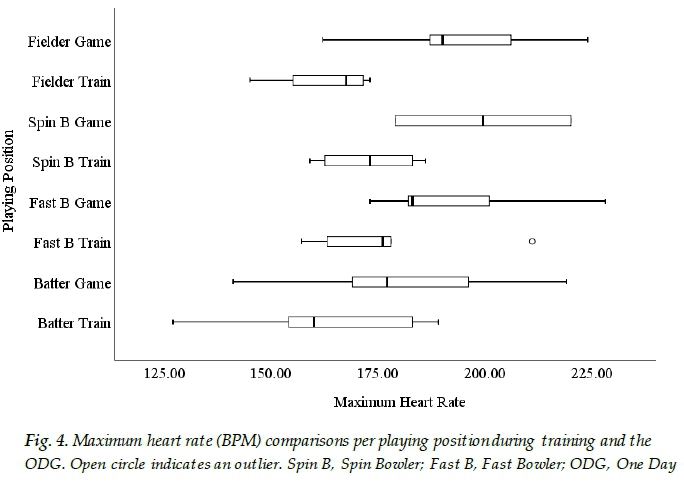
minimum and maximum heart rates of the cricket players during a training session compared to the ODG per subdiscipline (Figures 3 and 4). From the box plots, it can be seen that there are two outliers, one for the average heart rate of fast bowlers during training and the second one for the maximum heart rate of fast bowlers also during training. The distributions for some of sub-disciplines for both the average and maximum heart rates are significantly different. Higher average heart rates were recorded for all playing positions during the ODG compared to the training sessions, except for the fast bowlers. However, only the batsmen had significantly higher average and maximum heart rates (p<0.05).
Discussion
The research in this study found a great discrepancy between
Physiological responses
The box plots depict the differences in the median, the movement demands of the ODG and the training sessions, especially in the high-intensity categories. The effect sizes showe d that most differences in the movement patterns for all playing positons between training and the ODG were large or very large. The size differences for four of the six movement categories of fast bowlers were found to be very large, with the remaining two being large and medium respectively.
The disparity between training and the game is most pronounced amongst batsmen. It is the only sub-discipline where all high-intensity movement patterns differed significantly between training and the ODG. Results further showed that the batsmen did no sprinting during training. Although high levels of skill are critical to the success of batsmen, they do need to do a significant amount of sprinting between the wickets at relatively high speeds. It is important to note that the sprints by batsmen are performed with protective gear and playing implements, which places additional physical demands on the players. The lower maximum speeds recorded for batsmen could be as a consequence of their protective clothing worn. The mismatch between the movement patterns of batsmen during training and the ODG could have serious performance consequences for them given that the e stimated distance that can be covered by a batsman who scores 100 runs is 3200 m[1], while batsmen who bat throughout an entire innings can cover as much as 8700 m.[4] The lack of high-intensity training for batsmen suggests that the focus during their training is mainly on skill enhancements Similar to previous research,[16] the total distance covered by batsmen in the current study consisted predominantly of low-intensity activities which did not differ between training and the game.
The non-alignment of the physical demands placed on batsmen during training compared to the ODG is also reflected in the reported physiological parameters. They are the only players who had significantly higher maximum and average heart rates during the ODG (p<.05). Their maximum heart rates during the ODG ranged between 141 and 206 bt.min-1 (mean 180 bt.min-1) and between 127 and 189 bt.min-1 (mean 162 bt.min-1) during training. Their average heart rates also differed between training and the ODG, namely, 121 and 151 bt.min-1 respectively. These variances could be as a consequence of pervasive training methods, which may not best emulate the demands of cricket matches.
Fast bowlers covered the greatest absolute total distances in most movement categories compared to most of the other subdisciplines. They covered the greatest sprinting distances at the highest average speeds. The sprinting demands of their training in terms of high-intensity movement patterns and maximum (193 bt.min-1) and average heart rates (170 bt.min-1) matches the demands of the ODG. Net-based training adequately simulates the high-intensity movement patterns for fast bowlers. This could be the reason why no differences were found between the high-intensity movements in the training and the ODG. These findings are in line with those reported in previous research[17] showing that fast bowlers consistently performed at greater intensities than the other sub-disciplines.
Spin bowlers performed at a much lower intensity compared to the fast bowlers during both training and the game. The differences can be ascribed to movements associated with the various types of delivery, especially regarding their run-ups. The major discrepancies between training and the game for spin bowlers were recorded mainly in the high-intensity movement categories (running and striding).
Fielders, similar to fast bowlers, covered significantly greater total distances during the game compared to in training. The significant differences recorded for sprinting could be as a result of the increased effort made by fielders to save runs during the game. This also highlights the demand for more high-intensity movements during training for fielders to meet the demands of an ODG, a finding supported by previous research.[18]
It should be kept in mind that the differences between the distances covered during training and the ODG could be ascribed to variations in the duration of training sessions compared to a game. Furthermore, various researchers[4,7] agreed that the volume and duration of movement that a player in a particular position undertook depends largely on the game's circumstances. However, it is important to note that players are prepared to deal with especially the high-intensity movement demands of the game. According to current re search[16], high-intensity movements occupy a relatively small percentage of the total distances covered during a game, and could therefore be easily accommodated in the shorter training sessions.
Cricket, compared to most other field sports, consists mainly of low-intensity activities, such as walking. However, the shorter formats of cricket games do include more frequent high-intensity movements for all sub-disciplines.[3] This implies that high-intensity training should constitute the major part of training sessions even for the shorter formats of the game. This is supported by previous research[4] which found that the time spent sprinting per hour is 50-100% more in ODG than in multi-day cricket and that they further require greater intensity per unit of time.
There are two main training formats employed by cricket coaches of which the more common format is net-based training where the focus is skills development, while physiological development is largely coincidental[7,19]. Game-based training, on the other hand, simulates match conditions more closely and allows for significant physiological development.[7,12]
Conclusion
Time-motion analysis allows for the quantification of the physical and physiological demands of a cricket training session and the ODG for the various sub-disciplines. The findings of this study highlight the distinctive physical and physiological demands placed on players in the different subdisciplines during training and an ODG. The current study found that the major disparity between training and an ODG was amongst the batsmen. This is valuable information for conditioning coaches in their development of sub-discipline and match-format specific training programmes. Cricket training is generally skills and activity-based (batting, bowling, wicket keeping and fielding) and seldom replicates the game situation. It is recommended that game-based training should form part of the training regimes of teams. The results of the current study adds to the knowledge and understanding of the physical demands of ODG cricket and the extent to which a typical training session prepares players for the demands of the game. Another value of this study is that it investigated the differing positional demands associated with the game.
References
1. Noakes TD, Durandt JJ. Physiological requirements of cricket J Sports Sci 2000;18(12):919-929. [doi 10.1080/026404100446739] [ Links ]
2. Brewer C, Dawson D, Heasman J, et al. Movement pattern comparisons in elite (AFL) and sub-elite (WAFL) Australian football games using GPS, J Sci Med Sport 2010;13(6):618-623. [doi: 10.1016/ j.jsams.2010.01.005] [ Links ]
3. Aughey RJ. Applications of GPS technologies to field sports. Int J of Sports Physiol Perform 2011;6(3):295-310. [doi: 10.1123/ijspp.6.3.295] [ Links ]
4. Petersen CJ, Pyne D, Dawson B, et al. Movement patterns in cricket vary by both position and game format. J Sports Sci 2010;28(1):45-52. [doi: 10.1080/02640410903348665] [ Links ]
5. Edgecomb SJ, Norton KI. Comparison of global positioning and computer-based tracking systems for measuring player movement distance during Australian football. J Sci Med Sport 2006,9(1-2);25-32. [doi: 10.1016/ j.jsams.2006.01.003] [ Links ]
6. MacDonald D, Cronin J, Mills J, et al. Wicket keeping in c ric ket: a literature review. Int J Sports Sci Coach 2013;8(3):531-542. [doi: 10.1260/1747.9541. 8.3.531] [ Links ]
7. Vickery W, Dascombe BJ, Scanlan AT. A review of the physical and physiological demands associated with cricket fast and spin bowlers. Int J Sport Sci Coach 2018;13(2):290-301. [doi: 10.1177/1747954117731051 ]. [ Links ]
8. Scanlan AT, Berkelmans DM, Vickery WM, et al. A review of the internal and external physiological demands associated with batting in cricket. Int J Sports Physiol Perform 2016;11(8):987-997. [doi: 10.1123/ijspp.2016-0169] [ Links ]
9. Stretch RA, Lambert MI. Heart rate response of young cricket fast bowlers while bowling a six-over spell. S Afr J Sports Med 1999;6(1):15-19. [ Links ]
10. Houghton L, Dawson B, Rubenson J, et al. Movement patterns and physical strain during a novel, simulated cricket batting innings (BATEX). J Sports Sci 2011;29(8): 801-809. [doi: 10.1080/02640414.2011.560174] [ Links ]
11. Noorbhai MH, Noakes TD. Advances in cricket in the 21st century: Science, performance, and technology. Afr J Phys Health Educ Recreat Dance 2015; 21(4:2):1310-1320. [ Links ]
12. Pote L, Christie C. Impact of a simulated one-day international century on batting performance in cricket. J Sci Med Sport 2013;16 Suppl.1:e93-e94. [doi: 10.1016/j.jsams.2013.10.224] [ Links ]
13. Reardon C, Tobin DP, Delahunt E. Application of individualized speed thresholds to interpret position specific running demands in elite professional rugby union: A GPS study. PLoS One 2015;10(7):e0133410 [doi: 10.1371/journal.pone.0133410] [ Links ]
14. Johnston RJ, Watsford ML, Kelly SJ, et al. Validity and interunit reliability of 10 Hz and 15 Hz GPS units for assessing athlete movement demands. J Strength Cond Res 2014;28(6):1649 -1655. [doi: 10.1519/JSC.0000000000000323] [ Links ]
15. Cohen J. A power primer. Psychol Bull 1992;112(1):155-159. [PMID:19565683] [ Links ]
16. Duffield R, Drinkwater EJ. Time-motion analysis of Test and One-Day international cricket centuries, J Sports Sci 2008;26(5):457-464. [doi:10.1080/02640410701644026] [ Links ]
17. McNamara DJ, Gabbett TJ, Naughton G, et al. Training and competition workloads and fatigue responses of elite junior cricket players. Int J Sports Physiol Perform 2013;8(5):517-526. [doi: 10.1123/ijspp.8.5.517] [ Links ]
18. Rampinini E, Alberti G, Fiorenza M, et al. Accuracy of GPS devices for measuring high-intensity running in field-based team sports. Int J Sports Med 2015;36(1):49-53. [doi: 10.1055/s-0034-1385866] [ Links ]
19. Vickery W, Dascombe B, Duffield R, et al. Battlezone An examination of the physiological responses, movement demands and reproducibility of small-sided cricket games. J Sports Sci 2013;31(1):77-86. [doi: 10.1080/02640414.2012.720706] [ Links ]
 Correspondence:
A L Travill
atravill@uwc.ac.za

